
News | Market Wraps
Evening Wrap: ASX 200 smashes record as WiseTech leads Tech rally, Woolworths surges 13% on strong earnings
The S&P/ASX 200 closed 106 points higher, up 1.18%.

Mentioned
The S&P/ASX 200 closed 106 points higher, up 1.18%.
The ASX 200 surged 106 points to a record 9128.3, as a sharp rebound in technology stocks and strong earnings drove a broad-based rally, with investors shrugging off sticky inflation and leaning back into risk.
Technology and resources led the charge, with Information Technology (XIJ) (+5.9%) and Resources (XJR) (+2.5%) surging as beaten-down tech names bounced on easing AI fears and miners rallied on stronger commodity prices. Wisetech Global (WTC) (+11.0%), Siteminder (SDR) (+10.5%), Megaport (MP1) (+9.8%), Fortescue (FMG) (+4.7%) and BHP Group (BHP) (+3.2%) paced the gains.
Laggards were limited, but included Communication Services (XTJ) (-1.5%) and Consumer Discretionary (XDJ) (-0.4%), weighed by stock-specific earnings reactions and rate-sensitive consumer demand concerns. Telstra Group (TLS) (-3.0%), Domino’s Pizza Enterprises (DMP) (-11.1%) and Adairs (ADH) (-8.2%) led the declines.
In stock specific news:
Woolworths Group (WOW) (+13.0%) — surged on a strong earnings beat and upgraded trading outlook.
Tabcorp Holdings (TAH) (+23.5%) — soared after EBITDA beat expectations and dividend increased.
DroneShield (DRO) (+12.6%) — rallied on explosive revenue and profit growth.
Iress (IRE) (+9.6%) — gained on improved profit outlook driven by cost reductions.
Domino’s Pizza Enterprises (DMP) (-11.1%) — fell after cutting its dividend and weaker sales trends.
Flight Centre (FLT) (-3.2%) — slipped despite reaffirming guidance, with expectations already priced in.
In commodities, precious metals strengthened in Asian trade, with gold (+0.64%) at US$5,209/oz and silver (+3.3%) at US$90.40/oz, extending on continued safe-haven demand.
Lithium prices continued their sharp rebound in China trade, with carbonate futures up another 4% and spodumene rising 6.6%, driving strong gains in Liontown (LTR) (+9.4%), while rare earths names like Lynas Rare Earths (LYC) (+7.9%) also rallied on improving pricing signals.
Be sure to click/scroll through for the usual reporting of the major sector and stock-specific moves, the broker responses to them, as well as all the key economic data in tonight's Evening Wrap.
Also, I have detailed technical analysis on the Nasdaq Composite and the S&P/ASX 200 in today's ChartWatch.
Let's dive in!
Today in Review
Wed 25 Feb 26, 5:01pm (AEST)
Name | Value | % Chg |
|---|---|---|
Major Indices | ||
| ASX 200 | 9,128.3 | +1.18% |
| All Ords | 9,359.0 | +1.24% |
| Small Ords | 3,727.3 | +1.73% |
| All Tech | 2,694.7 | +3.97% |
| Emerging Companies | 3,237.9 | +2.10% |
Currency | ||
| AUD/USD | 0.711 | +0.74% |
US Futures | ||
| S&P 500 | 6,907.0 | +0.05% |
| Dow Jones | 49,232.0 | -0.01% |
| Nasdaq | 25,055.25 | +0.11% |
Name | Value | % Chg |
|---|---|---|
Sector | ||
| Information Technology | 1,698.8 | +5.88% |
| Consumer Staples | 12,653.5 | +5.67% |
| Materials | 24,843.7 | +2.68% |
| Energy | 9,645.2 | +0.86% |
| Financials | 9,986.5 | +0.58% |
| Health Care | 29,364.4 | +0.36% |
| Industrials | 8,649.8 | +0.30% |
| Real Estate | 3,631.8 | +0.07% |
| Consumer Discretionary | 3,675.7 | -0.38% |
| Utilities | 10,057.1 | -0.70% |
| Communication Services | 1,665.2 | -1.47% |
Markets
%20intraday%20chart_25%20Feb.png)
ASX 200 Session Chart
The S&P/ASX 200 (XJO) finished 106 points higher at 9,128.3, 1.17% from its session low and just 0.02% from its high. In the broader-based S&P/ASX 300 (XKO) advancers beat decliners by a convincing 201 to 82.
Fund flows: Is it time to buy ASX tech? Knock your socks off! 🧦
It wasn’t quite 1pm, perhaps just before 1.30pm — but we saw another big after lunch algo-order take the positive edge of today’s price action. Fortunately, there was a little spike in the closing price action to undo most of that order's impact (that's the vertical up-blip at the end of the intraday chart above).
I won’t pre-empt ChartWatch below, but that last up-blip has (for me) helped the ASX 200, aka the Old Tin Pot, close out a rather emphatic candle — that's entirely consistent with new all-time high.
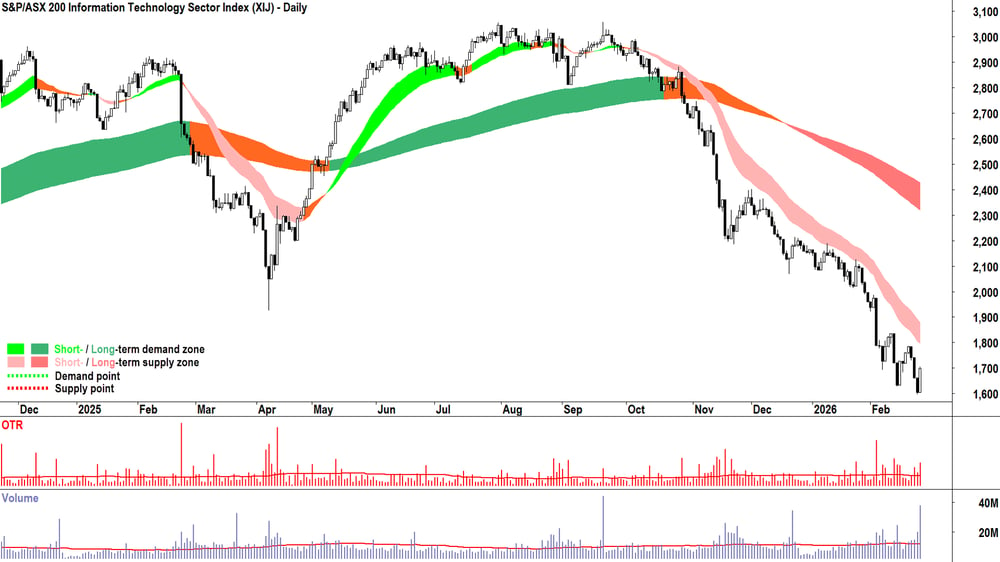
Unequivocally, today is a net-positive session, particularly from the standpoint of broadening participation. Information Technology (XIJ) (+5.9%) was decent today, and the other sector rotation victims Health Care (XHJ) (+0.4%) and Consumer Discretionary (XDJ) (-0.4%) weren’t their customary terrible.
S&P-ASX 200 Information Technology Sector Index chart
Sure, the math reminds us that if you plunge 48% since 19-Sep last year — as the XIJ has done — then today’s 6% rally is largely just a drop in the ocean. But, to summon another phrase… it’s also a vital step in the right direction.
Belief.
That’s what Tech needs now. 1. Belief the worst is over (i.e., the “AI will destroy everything that can be coded and sold as software” trade has run its course). But more importantly: 2. Belief that there’s a reason for Tech to go back up.
Because on point 2, maybe, just maybe... current pricing reflects software company's just deserts = they're the right price! 🍨
We can try and read the newspapers and watch interviews with experts to try to ascertain when 1 and 2 are locked in place… Or, we can choose instead to let the price action guide us. Price action, of course, is simply a schedule of how demand and supply are interacting over time.
If we assume that both the demand- and supply-sides will know well before us when 1 and 2 have occurred, then careful analysis of the price action should be sufficient.
So, if you’ve drunk the Kool Aid and have come around to my way of thinking, then you’ll be wanting to watch for the following signals on the XIJ chart that MOTN (More Often Than Not) indicate there's once again an excess of demand for tech stocks:
Short term uptrend = Light green short term trend ribbon, price consistently closing above the short term trend ribbon, the short term trend ribbon is expanding, the short term trend ribbon is acting as a zone of dynamic demand (i.e., the price is consistently bouncing up off the short term trend ribbon). ⏹️
Long term trend = Not down! I.e. it could be amber (it will do this first, i.e. neutral, i.e. equilibrium between demand and supply among longer term investors) or dark green (i.e., up, excess demand from longer term investors), the long term uptrend ribbon is beginning to act as a zone of dynamic demand ⏹️
Price action = Rising peaks and rising troughs (i.e., demand reinforcement and supply removal = but the dip + FOMO into rallies). ⏹️
Candles = Predominantly demand-side in nature (i.e., white-bodied and or downward pointing shadows, the longer the better) = pervasive programmed buy orders, buy the dip + FOMO into rallies). ⏹️
Volume = Several above average sessions accompanying the positive trends and price action described above, to signify an exhaustion of supply (i.e., final capitulation selling) is bashing against substantial increased buying interest / positional buying based on perceived attractive value. ⏹️
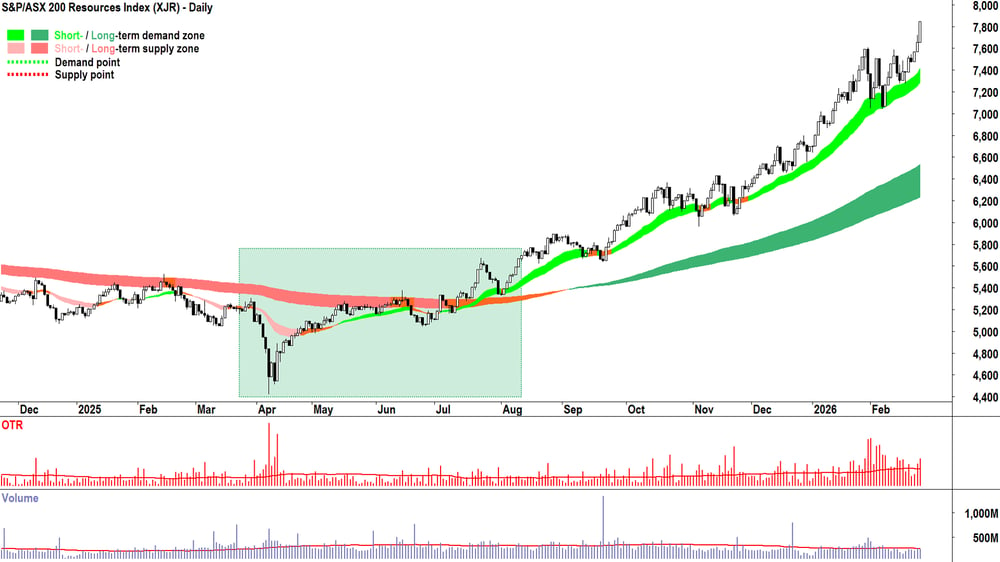
Basically, the XIJ would have to do what the now-mighty Resources (XJR) (+2.5%) sector did back between April and August last year — i.e., a textbook "Turnaround Setup"!
S&P-ASX 200 Resources Index chart
Logically, it will take some time for us to tick all of the above boxes for the XIJ. Well, it will take some time for me to tick them all — because you can knock your pretty little cotton socks off and do whatever you like!
You can, also — if you choose — buy right now in the absence of any of those things… thus betting that each will eventually occur to confirm your decision.
That’s what makes a market — and that’s what makes markets wonderful! We can all do whatever we want! 💪
Today's best blue chip gainers
Company | Last Price | Change $ | Change % | 1mo % | 1yr % |
|---|---|---|---|---|---|
Woolworths Group (WOW) | $35.63 | +$4.09 | +13.0% | +16.3% | +12.9% |
Wisetech Global (WTC) | $47.74 | +$4.75 | +11.0% | -24.3% | -49.5% |
Lynas Rare Earths (LYC) | $17.03 | +$1.25 | +7.9% | +6.4% | +147.2% |
Pro Medicus (PME) | $116.23 | +$8.08 | +7.5% | -38.9% | -59.0% |
Life360 (360) | $23.06 | +$1.3 | +6.0% | -25.3% | +1.1% |
Xero (XRO) | $75.76 | +$3.92 | +5.5% | -24.1% | -57.9% |
Nextdc (NXT) | $14.00 | +$0.72 | +5.4% | +2.1% | +1.7% |
Netwealth Group (NWL) | $25.38 | +$1.18 | +4.9% | -2.7% | -18.7% |
Fortescue (FMG) | $21.14 | +$0.94 | +4.7% | -3.3% | +17.6% |
IGO (IGO) | $8.72 | +$0.37 | +4.4% | -6.9% | +108.6% |
Technology One (TNE) | $23.43 | +$0.84 | +3.7% | -13.6% | -25.4% |
Evolution Mining (EVN) | $16.22 | +$0.51 | +3.2% | +9.9% | +156.6% |
BHP Group (BHP) | $56.51 | +$1.76 | +3.2% | +13.6% | +40.2% |
Treasury Wine Estates (TWE) | $4.64 | +$0.14 | +3.1% | -13.4% | -56.7% |
Hub24 (HUB) | $95.40 | +$2.84 | +3.1% | -7.7% | +18.6% |
Perseus Mining (PRU) | $6.05 | +$0.17 | +2.9% | -3.8% | +100.3% |
Charter Hall Group (CHC) | $21.47 | +$0.58 | +2.8% | -10.7% | +23.0% |
Car Group (CAR) | $24.59 | +$0.66 | +2.8% | -17.8% | -33.4% |
PLS Group (PLS) | $4.85 | +$0.13 | +2.8% | -2.2% | +142.5% |
Pinnacle Investment Management (PNI) | $15.48 | +$0.41 | +2.7% | -12.0% | -33.9% |
Today's worst blue chip losers
Company | Last Price | Change $ | Change % | 1mo % | 1yr % |
|---|---|---|---|---|---|
Ampol (ALD) | $27.75 | -$0.91 | -3.2% | -8.5% | +6.2% |
Telstra Group (TLS) | $5.09 | -$0.16 | -3.0% | +5.4% | +22.4% |
Light & Wonder (LNW) | $133.32 | -$3.79 | -2.8% | -18.3% | -15.9% |
Resmed Inc (RMD) | $35.53 | -$1. | -2.7% | -5.5% | -1.9% |
Eagers Automotive (APE) | $24.13 | -$0.58 | -2.3% | -14.8% | +93.6% |
Ramelius Resources (RMS) | $4.76 | -$0.11 | -2.3% | -3.4% | +69.4% |
Insurance Australia Group (IAG) | $6.60 | -$0.13 | -1.9% | -10.1% | -15.9% |
AGL Energy (AGL) | $9.98 | -$0.17 | -1.7% | +11.6% | -5.1% |
Wesfarmers (WES) | $79.99 | -$1.1 | -1.4% | -5.6% | +9.7% |
Challenger (CGF) | $8.89 | -$0.09 | -1.0% | -4.2% | +63.7% |
Amcor PLC (AMC) | $69.89 | -$0.7 | -1.0% | +8.1% | -11.8% |
Mirvac Group (MGR) | $2.01 | -$0.02 | -1.0% | +1.0% | -2.9% |
APA Group (APA) | $9.06 | -$0.09 | -1.0% | +0.8% | +17.7% |
Transurban Group (TCL) | $14.21 | -$0.14 | -1.0% | +2.9% | +8.2% |
Lendlease Group (LLC) | $4.16 | -$0.04 | -1.0% | -16.5% | -31.7% |
The Lottery Corp. (TLC) | $5.40 | -$0.05 | -0.9% | +3.6% | +8.0% |
Computershare (CPU) | $30.38 | -$0.27 | -0.9% | -14.1% | -26.9% |
Whitehaven Coal (WHC) | $7.88 | -$0.06 | -0.8% | -13.4% | +35.2% |
Ansell (ANN) | $32.02 | -$0.22 | -0.7% | -5.2% | -10.4% |
SGH (SGH) | $47.79 | -$0.21 | -0.4% | +0.8% | -8.7% |
ChartWatch
Nasdaq Composite Index
Analysis
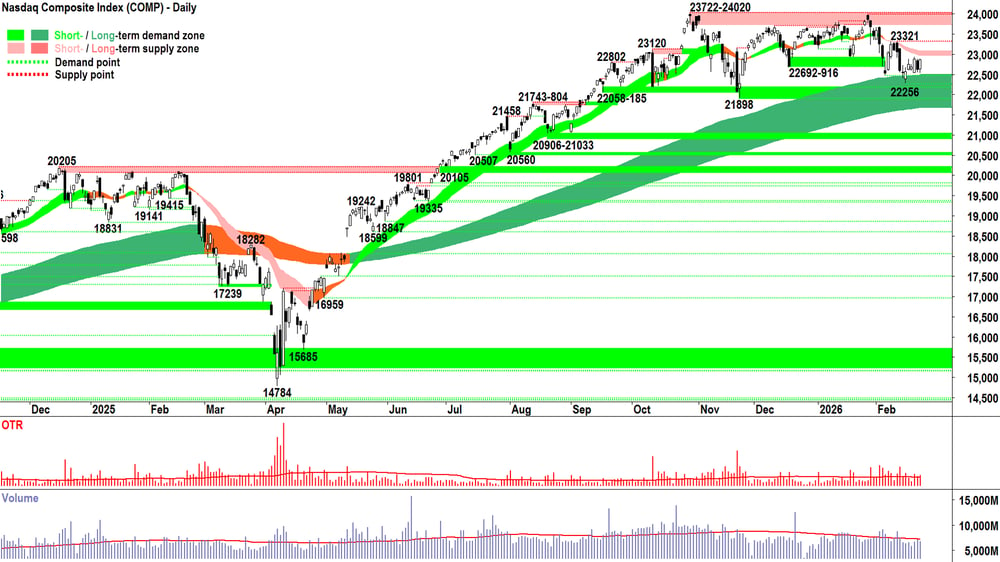
Yesterday we discussed the pincer move that the short- and long term trend ribbons were performing on the Comp’s price action.
We’re one day further along without resolution — but Monday’s candle (white-bodied + close near high) is a positive step. It's a positive step after a negative step.... that itself, occurred after a positive step... 🦓
Still, as chop-chop as the last few candles have been — it’s now 5 out of the last 6 showing white bodies, and each of that last half-dozen are respecting the dynamic demand at the long term uptrend ribbon.
= There's actually some excess demand at the long term uptrend ribbon! ✅
There’s not much I can add from my previous analysis here — because it’s not like the Comp is doing an ASX 200! 😉
So, ditto from yesterday’s post:
A close above the short term downtrend ribbon (presently 23025-23125) would be a significant win for the demand-side.
A close below the nearest point of demand 22256 — which likely sets a path towards a date with 21898 and the bottom of the long term uptrend ribbon (presently 21660-22480) — would be a significant win for the supply-side.
View
Given current, sorry state of affairs for the Comp's technicals — how can I possibly be anywhere else but 1/2RP with respect to my US portfolio risk limit!? 🤷 (RP = Risk Position — it reflects my personal allowable capital allocation limit for my investments in US stocks. So 1/2RP is 50%, 2/3RP is 67% and FRP is 100% 🪣).
Key levels
22461 is the critical point of demand. 21898 is the key local go-no-go zone for the Comp — a close below 21898 implies the supply-side is control of the Comp's short term price. A close below the low of the long term uptrend ribbon (presently 21677-22484), implies the long term uptrend is likely under significant pressure = ⚠️. 23321 is the nearest critical static point supply, but the short term downtrend ribbon (presently 22976-23082) may also impede upside price action.
S&P/ASX 200 (XJO)
%20chart_25%20Feb.png)
Analysis
Cue the 80’s Swan Lager Commercial!
They said the Old Tin Pot would never make it!
Old Tin Pot = ❌
Golden Le Creuset = ✅
Surely we have entered a new era ladies and gentlemen! An era of Australian stock market dominance! 💪
Okay, okay, let’s not get ahead of ourselves… Sure, we welcome the GLC’s new all time closing high — it’s first since 21-Oct last year — but all that really happened today is we ended up with a very credible white candle. Tick. But there are a few other ticks as well:
Above average volatility + above average volume (i.e., meaningful move + some interest and commitment behind it, likely also, clearing of that pesky excess supply at 9110-9116). ✅ ✅
In a short term uptrend = excess demand among short term traders ✅
In a long term uptrend = excess demand among long term investors ✅
With strong demand-side price action = buy the dip + FOMO into rallies ✅
With predominantly strong candles = pervasive buy programmed orders + buy the dip + FOMO into rallies ✅
That’s a lot of ticks!
Put them all together, and one must assume we're in a state of excess demand, and MOTN, excess demand = P ⬆️
Where to next?
9,500?
10,000?
Dare we dream? 🤔
Hey, pretty little cotton socks… Remember? You do you!
For me, this present demand-side controlled market will last as long as it lasts. I don’t need to know the exact point it will stop and reverse.
I’m guaranteed to always be one candle behind.
And that’s okay with me! 🧘
View
I am 2/3 RP 🪣 (i.e., my personal allowable capital allocation limit for my investments in Australian stocks is 67%).
Key levels
The short term uptrend ribbon (presently 8091-8936) is the closest zone of demand, a close below it would neutralise the present short term uptrend. 9110-9116 is the key zone of supply. Celebrations (and a move to FRP) are on hold until the demand-side can consume the highly motivated supply that appears to be residing there! 🧱
***NEW VIDEO DROPPED — LITHIUM + URANIUM REVIEWS! 📺***
ChartWatch *LIVE* Webinar
ChartWatch *LIVE* Webinars – WEEKLY Wednesday's @ 12pm AEDT
Learn more about technical analysis and trend following through real case studies on ASX stocks. Australia's premier technical analyst, Carl Capolingua, shares his unique insights on stocks as requested by viewers. Ask about a company in your portfolio or anything related to trading and investing and get Carl's expert opinion.
Places are limited so >REGISTER NOW!<
Economy
Today
11:30 AUS January Consumer Price Index (CPI)
Result: +3.8% p.a. actual vs +3.7% p.a. forecast vs +3.8% p.a. in December
Comment: Australian CPI surprised to the upside in January, with trimmed mean inflation lifting to a 16-month high of 3.4% up from 3.3% in December, nudging the Australian dollar 0.2% higher — and stoking renewed concerns that another RBA hike is coming.
Later this week
Thursday
11:30 AUS December Quarter Private Capital Expenditure (-0.1% q/q forecast vs +6.4% q/q previous)
Friday
11:30 AUS January Private Sector Credit (+0.7% m/m forecast vs +0.8% m/m previous)
Saturday
12:30 USA January Core Producer Price Index (PPI) (+0.3% m/m forecast vs +0.7% m/m previous)
Latest News
Interesting Movers
Trading higher
+27.5% Appen (APX) – FY25 Results and FY26 Outlook, general strength across the broader Information Technology sector today.
+23.5% Tabcorp Holdings (TAH) – Half year results presentation.
+19.9% Accent Group (AX1) – FY26 Half Year Results Investor Presentation.
+16.4% Helia Group (HLI) – 2025 Full Year Results Investor Presentation.
+14.0% ARB Corp. (ARB) – Rebounded after yesterday's sharp drop due to 1H FY2026 Results Presentation.
+13.2% Electro Optic Systems Holdings (EOS) – No news since 23-Feb 2025 Results Investor Presentation.
+13.0% Woolworths Group (WOW) – Half-Year Results Presentation.
+12.6% Droneshield (DRO) – FY2025 Investor Presentation.
+11.5% Forrestania Resources (FRS) – Forrestania Further Consolidates Forrestania Hub, rise is consistent with prevailing short and long term uptrends, a regular in ChartWatch ASX Scans Uptrends list 🔎📈
+11.0% Wisetech Global (WTC) – WTC reaffirms FY26 guidance & accelerates AI transformation.
+9.4% Liontown (LTR) – No news, general strength across the broader Lithium sector today.
+7.9% Lynas Rare Earths (LYC) – No news, general strength across the broader Rare Earths & Critical Minerals sector today.
+7.7% Iluka Resources (ILU) – No news, general strength across the broader Rare Earths & Critical Minerals sector today.
Trading lower
-11.1% (DMP) – Half Year 2026 Market Presentation.
-8.2% Adairs (ADH) – No news since 23-Feb ADH 1H FY2026 Results Presentation, fall is consistent with prevailing short and long term downtrends, a regular in ChartWatch ASX Scans Downtrends list 🔎📉
-7.0% Viva Energy Group (VEA) – No news since 24-Feb Results Presentation.
-6.9% OOH!Media (OML) – No news, fall is consistent with prevailing short and long term downtrends, a regular in ChartWatch ASX Scans Downtrends list 🔎📉
-5.5% G8 Education (GEM) – No news, fall is consistent with prevailing short and long term downtrends, a regular in ChartWatch ASX Scans Downtrends list 🔎📉
-5.4% Monadelphous Group (MND) – No news, pulled back after yesterday's sharp rally due to Monadelphous Reports 2026 Half Year Results.
Broker Moves
ARN Media (A1N)
Retained at sell at UBS; Price Target: $0.37
Abacus Group (ABG)
Retained at buy at Citi; Price Target: $1.40
Retained at buy at Shaw and Partners; Price Target: $1.40
Ama Group (AMA)
Retained at buy at Bell Potter; Price Target: $1.25 from $1.30
ARB Corporation (ARB)
Downgraded to neutral from buy at Citi; Price Target: $22.05 from $42.25
Retained at neutral at JPMorgan; Price Target: $25.50 from $29.00
Retained at outperform at Macquarie; Price Target: $29.95 from $35.80
Retained at overweight at Morgan Stanley; Price Target: $28.00 from $44.00
Upgraded to buy from accumulate at Morgans; Price Target: $31.85 from $32.00
Retained at buy at Ord Minnett; Price Target: $31.00 from $37.00
Upgraded to buy from neutral at UBS; Price Target: $25.50 from $27.85
AUB Group (AUB)
Retained at outperform at CLSA; Price Target: $31.60 from $37.45
Retained at overweight at Jarden; Price Target: $34.60 from $38.20
Retained at overweight at JPMorgan; Price Target: $35.00 from $42.00
Initiated at outperform at Macquarie; Price Target: $35.81
Retained at overweight at Morgan Stanley; Price Target: $45.00
Retained at buy at UBS; Price Target: $34.00 from $35.00
Accent Group (AX1)
Retained at neutral at Citi; Price Target: $1.08
Retained at neutral at UBS; Price Target: $1.10
BHP Group (BHP)
Retained at neutral at Citi; Price Target: $53.00 from $52.00
Cuscal (CCL)
Retained at buy at Bell Potter; Price Target: $5.10 from $4.60
Retained at buy at Ord Minnett; Price Target: $5.13
Centuria Capital Group (CNI)
Retained at neutral at UBS; Price Target: $2.03
Coronado Global Resources Inc (CRN)
Retained at hold at Bell Potter; Price Target: $0.38 from $0.43
Upgraded to outperform from underperform at Macquarie; Price Target: $0.50 from $0.40
Retained at hold at Ord Minnett; Price Target: $0.37 from $0.45
Retained at buy at UBS; Price Target: $0.36 from $0.39
Cedar Woods Properties (CWP)
Retained at buy at Bell Potter; Price Target: $10.20 from $10.00
Retained at buy at Shaw and Partners; Price Target: $9.55 from $9.40
Calix (CXL)
Retained at buy at Shaw and Partners; Price Target: $1.70
Dalrymple Bay Infrastructure (DBI)
Retained at buy at Citi; Price Target: $6.00 from $5.30
Downgraded to neutral from outperform at Macquarie; Price Target: $5.45 from $5.33
Downgraded to hold from accumulate at Morgans; Price Target: $5.35 from $5.10
Domino's Pizza Enterprises (DMP)
Retained at sell at Citi; Price Target: $19.85
EQ Resources (EQR)
Initiated at buy at Canaccord Genuity; Price Target: $0.40
EVT (EVT)
Retained at buy at Citi; Price Target: $16.85 from $17.30
Flight Centre Travel Group (FLT)
Retained at buy at Citi; Price Target: $16.75
Retained at buy at UBS; Price Target: $16.45
Fortescue (FMG)
Retained at neutral at UBS; Price Target: $20.00
G8 Education (GEM)
Retained at neutral at UBS; Price Target: $0.38 from $0.72
Gemlife Communities Group (GLF)
Retained at neutral at Citi; Price Target: $5.60
HMC Capital (HMC)
Retained at hold at Bell Potter; Price Target: $3.20 from $4.25
Upgraded to overweight from neutral at Jarden; Price Target: $3.30 from $4.00
Upgraded to outperform from neutral at Macquarie; Price Target: $3.96 from $4.63
hipages Group Holdings (HPG)
Retained at buy at Shaw and Partners; Price Target: $2.50 from $2.80
HUB24 (HUB)
Retained at buy at Citi; Price Target: $106.75 from $100.60
Integral Diagnostics (IDX)
Retained at buy at Canaccord Genuity; Price Target: $2.57 from $3.20
Retained at buy at Jarden; Price Target: $3.25 from $3.35
Retained at buy at Jefferies; Price Target: $3.60 from $3.40
Retained at outperform at Macquarie; Price Target: $3.50 from $3.40
Retained at buy at Ord Minnett; Price Target: $3.30
Retained at outperform at RBC Capital Markets; Price Target: $3.20 from $3.50
Ingenia Communities Group (INA)
Retained at neutral at UBS; Price Target: $5.00
Kelsian Group (KLS)
Retained at buy at Canaccord Genuity; Price Target: $6.00 from $5.80
Retained at positive at E&P; Price Target: $5.80 from $5.65
Retained at sector perform at RBC Capital Markets; Price Target: $4.25
Retained at buy at UBS; Price Target: $5.60 from $5.50
L1 Group (L1G)
Retained at neutral at UBS; Price Target: $1.12
Lindsay Australia (LAU)
Retained at buy at Shaw and Partners; Price Target: $1.00
LendLease Group (LLC)
Retained at hold at Ord Minnett; Price Target: $4.95 from $5.25
Mader Group (MAD)
Upgraded to buy from hold at Bell Potter; Price Target: $9.70 from $9.00
Retained at outperform at Macquarie; Price Target: $10.20
MAAS Group Holdings (MGH)
Retained at outperform at Macquarie; Price Target: $5.25 from $5.55
Retained at buy at Morgans; Price Target: $5.20 from $5.10
Minerals 260 (MI6)
Retained at speculative buy at Bell Potter; Price Target: $0.90 from $0.75
Monadelphous Group (MND)
Retained at buy at Bell Potter; Price Target: $37.00 from $33.00
Retained at buy at Citi; Price Target: $36.75 from $28.75
Retained at hold at CLSA; Price Target: $33.00 from $21.80
Downgraded to neutral from positive at E&P; Price Target: $34.20
Downgraded to neutral from overweight at Jarden; Price Target: $32.80 from $31.70
Downgraded to neutral from outperform at Macquarie; Price Target: $33.95 from $31.00
Downgraded to hold from buy at Morgans; Price Target: $33.85 from $29.00
Megaport (MP1)
Retained at buy at Morgans; Price Target: $16.00 from $15.50
Nanosonics (NAN)
Upgraded to hold from sell at Bell Potter; Price Target: $3.60 from $4.10
Retained at neutral at E&P; Price Target: $4.07 from $4.16
Retained at buy at Goldman Sachs; Price Target: $4.50 from $4.60
Retained at buy at Morgans; Price Target: $4.00 from $5.00
Retained at sector perform at RBC Capital Markets; Price Target: $3.75 from $4.00
Nine Entertainment Co. Holdings (NEC)
Retained at positive at E&P; Price Target: $1.30
Retained at neutral at JPMorgan; Price Target: $1.25
Retained at neutral at UBS; Price Target: $1.13 from $1.22
Navigator Global Investments (NGI)
Retained at buy at Ord Minnett; Price Target: $3.55 from $3.70
Noumi (NOU)
Retained at buy at Bell Potter; Price Target: $0.18
NEXTDC (NXT)
Retained at buy at Citi; Price Target: $19.00
Propel Funeral Partners (PFP)
Downgraded to neutral from positive at E&P; Price Target: $5.17 from $5.77
Retained at outperform at Macquarie; Price Target: $5.75 from $5.80
Retained at overweight at Morgan Stanley; Price Target: $6.00 from $6.50
Praemium (PPS)
Retained at buy at Bell Potter; Price Target: $1.20
Perenti (PRN)
Retained at buy at Citi; Price Target: $3.00 from $3.10
Scentre Group (SCG)
Retained at buy at Citi; Price Target: $4.40 from $4.60
Downgraded to hold from outperform at CLSA; Price Target: $3.72 from $4.35
Upgraded to neutral from underweight at Jarden; Price Target: $4.15 from $4.40
Upgraded to neutral from underperform at Macquarie; Price Target: $3.73 from $3.64
Steadfast Group (SDF)
Retained at buy at Citi; Price Target: $6.00 from $6.50
Retained at overweight at Morgan Stanley; Price Target: $6.74
SiteMinder (SDR)
Retained at buy at Citi; Price Target: $6.75
Retained at buy at UBS; Price Target: $8.30
SKS Technologies Group (SKS)
Downgraded to accumulate from buy at Morgans; Price Target: $5.10
Service Stream (SSM)
Retained at buy at Citi; Price Target: $2.65
Retained at buy at UBS; Price Target: $2.80
Tasmea (TEA)
Retained at buy at Morgans; Price Target: $5.25 from $5.40
Tetratherix (TTX)
Retained at speculative buy at Morgans; Price Target: $5.76
Tyro Payments (TYR)
Retained at buy at Canaccord Genuity; Price Target: $1.60 from $1.70
Retained at buy at Jefferies; Price Target: $1.30 from $1.40
Retained at buy at Morgans; Price Target: $1.55 from $1.70
Viva Energy Group (VEA)
Retained at hold at Jefferies; Price Target: $2.00
Retained at outperform at Macquarie; Price Target: $2.70
Retained at equal-weight at Morgan Stanley; Price Target: $2.09
Retained at buy at Ord Minnett; Price Target: $2.50 from $2.40
Retained at sector perform at RBC Capital Markets; Price Target: $1.90
Retained at buy at UBS; Price Target: $2.40 from $2.60
Vulcan Steel (VSL)
Retained at speculative buy at E&P; Price Target: $6.81 from $6.68
Retained at buy at UBS; Price Target: $7.65
Vysarn (VYS)
Retained at speculative buy at Morgans; Price Target: $0.90 from $0.64
Wildcat Resources (WC8)
Retained at buy at Shaw and Partners; Price Target: $1.20
Woodside Energy Group (WDS)
Retained at neutral at Citi; Price Target: $28.00 from $26.50
Retained at outperform at CLSA; Price Target: $32.05 from $31.25
Downgraded to neutral from overweight at Jarden; Price Target: $26.25 from $25.20
Retained at neutral at Macquarie; Price Target: $27.00
Retained at equal-weight at Morgan Stanley; Price Target: $26.00
Retained at buy at Morgans; Price Target: $30.50 from $29.80
Downgraded to lighten from hold at Ord Minnett; Price Target: $24.00
Retained at neutral at UBS; Price Target: $25.60 from $23.10
Woolworths Group (WOW)
Retained at neutral at Citi; Price Target: $31.00
Retained at neutral at UBS; Price Target: $30.75
Wisetech Global (WTC)
Retained at buy at Citi; Price Target: $109.15
Scans
Top Gainers
Code | Company | Last | % Chg |
|---|---|---|---|
| BEZ | Besra Gold Inc | $0.15 | +89.87% |
| C1X | Cosmos Exploration Ltd | $0.22 | +29.41% |
| APX | Appen Ltd | $1.69 | +27.55% |
| TAH | Tabcorp Holdings Ltd | $1.05 | +23.53% |
| AKA | Aureka Ltd | $0.14 | +21.74% |
Top Fallers
Code | Company | Last | % Chg |
|---|---|---|---|
| KLV | Klevo Rewards Ltd | $0.018 | -33.33% |
| SDV | Scidev Ltd | $0.235 | -31.88% |
| COS | Cosol Ltd | $0.24 | -30.44% |
| TIA | Tian An Australia Ltd | $0.265 | -20.90% |
| FWD | Fleetwood Ltd | $2.03 | -20.70% |
52 Week Highs
Code | Company | Last | % Chg |
|---|---|---|---|
| BEZ | Besra Gold Inc | $0.15 | +89.87% |
| C1X | Cosmos Exploration Ltd | $0.22 | +29.41% |
| PGO | Pacgold Ltd | $0.18 | +20.00% |
| MNE | Macallum New Energy Ltd | $0.235 | +17.50% |
| HLI | Helia Group Ltd | $6.26 | +16.36% |
52 Week Lows
Code | Company | Last | % Chg |
|---|---|---|---|
| SDV | Scidev Ltd | $0.235 | -31.88% |
| COS | Cosol Ltd | $0.24 | -30.44% |
| ABY | Adore Beauty Group Ltd | $0.51 | -17.74% |
| PGC | Paragon Care Ltd | $0.18 | -12.20% |
| CLU | Cluey Ltd | $0.052 | -10.35% |
52 Week Lows
Code | Company | Last | % Chg |
|---|---|---|---|
| SDV | Scidev Ltd | $0.235 | -31.88% |
| COS | Cosol Ltd | $0.24 | -30.44% |
| ABY | Adore Beauty Group Ltd | $0.51 | -17.74% |
| PGC | Paragon Care Ltd | $0.18 | -12.20% |
| CLU | Cluey Ltd | $0.052 | -10.35% |
Relative Strength Index (RSI) Oversold
Code | Company | Last | % Chg |
|---|---|---|---|
| PGC | Paragon Care Ltd | $0.18 | -12.20% |
| CGFPC | Challenger Ltd | $100.30 | -0.14% |
| GAME | Betashares Video Games and Esports ETF | $14.71 | +0.75% |
| CD2 | CD Private Equity Fund Ii | $0.47 | 0.00% |
| BUGG | Global X Cybersecurity ETF | $8.34 | +0.60% |
