Copper Chart
About & Performance
Copper (Cu) is a ductile metal that's an excellent conductor of electricity.
For this reason, more than half the world's copper is used in electrical motors, wiring or anything that requires electricity.
Global demand drives the price with emerging markets playing a significant role. China, in particular, has seen a large increase in copper consumption due to urbanisation and strong economic growth.
The world's primary market for copper trading is the London Metal Exchange (LME). The CME Group (COMEX) Futures, however, are the most quoted benchmark online, with prices displayed in $US per pound.
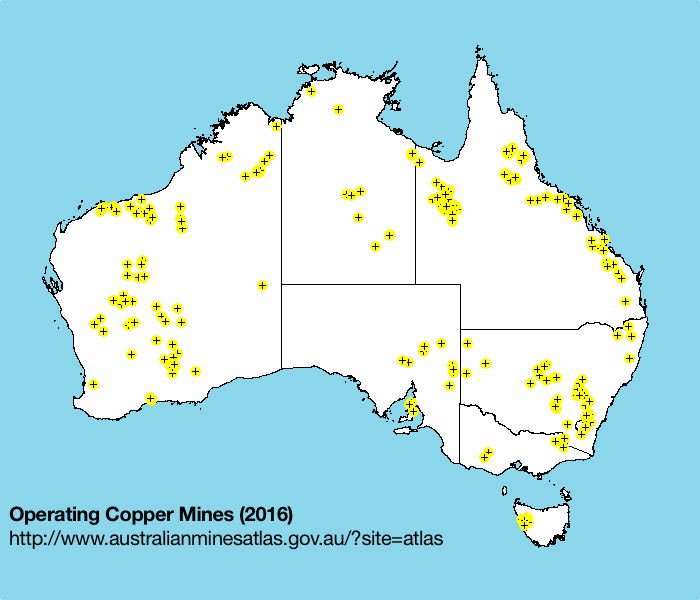
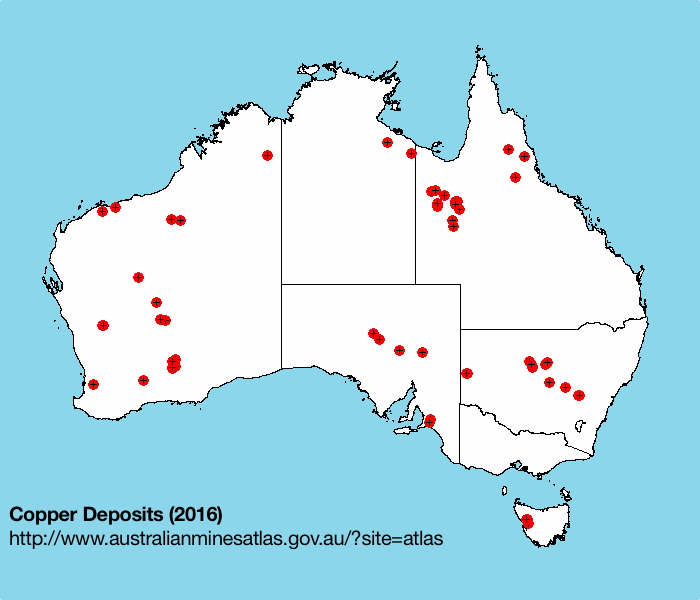
Australia holds about 13% of the world's copper resources which is second only to Chile (25%). The largest domestic resources are at Olympic Dam (SA) and Mount Isa (QLD).
| Copper Prices | AUD | USD |
|---|---|---|
| Pound (lb) | $9.06 | $6.34 |
| Kilogram (kg) | $19.98 | $13.97 |
9:48pm 16/07 AEST USD/lb
| Performance USD/lb | Amount | Change |
|---|---|---|
| 1 Week | +0.12 | +1.96% |
| 1 Month | -0.14 | -2.23% |
| YTD | +0.65 | +11.53% |
| 1 Year | +0.86 | +15.78% |
9:48pm 16/07 AEST USD/lb
ASX Copper Companies
| Code | Company | Price | Chg | % Chg | High | Low | Volume | Mkt Cap | 1 Year | |
|---|---|---|---|---|---|---|---|---|---|---|
| - | 29M |
29METALS Ltd
|
$0.23 | 0.00 | 0.00% | $0.235 | $0.225 | 2,973,048 | $402.52M | -27.84% |
| A1M |
Aic Mines Ltd
|
$0.67 | -0.145 | -17.79% | $0.77 | $0.66 | 6,718,253 | $534.41M | +116.13% | |
| AAJ |
Aruma Resources Ltd
|
$0.008 | -0.001 | -11.11% | $0.009 | $0.008 | 473,104 | $5.87M | +1.05% | |
| - | ADG |
Amara Minerals Ltd
|
$0.005 | 0.00 | 0.00% | $0.00 | $0.00 | - | $13.33M | -37.50% |
| - | AGC |
Australian Gold and Copper Ltd
|
$0.125 | 0.00 | 0.00% | $0.125 | $0.125 | 36,137 | $35.64M | -19.36% |
| AIS |
Aeris Resources Ltd
|
$0.385 | -0.01 | -2.53% | $0.40 | $0.375 | 4,749,406 | $576.38M | +108.11% | |
| - | AIV |
Activex Ltd
|
$0.018 | 0.00 | 0.00% | $0.00 | $0.00 | - | $5.63M | +157.14% |
| AKA |
Aureka Ltd
|
$0.095 | -0.001 | -1.04% | $0.095 | $0.095 | 106,000 | $15.12M | -2.06% | |
| AKN |
Auking Mining Ltd
|
$0.028 | +0.001 | +3.70% | $0.029 | $0.026 | 14,968,653 | $59.68M | +460.00% | |
| - | ALK |
Alkane Resources Ltd
|
$1.39 | 0.00 | 0.00% | $1.41 | $1.38 | 2,779,396 | $1.9B | +105.93% |
| AMI |
Aurelia Metals Ltd
|
$0.28 | -0.015 | -5.09% | $0.295 | $0.275 | 3,620,481 | $474.15M | +40.00% | |
| - | AML |
Aeon Metals Ltd
|
$0.005 | 0.00 | 0.00% | $0.00 | $0.00 | - | $5.48M | -28.57% |
| AMN |
Agrimin Ltd
|
$0.051 | -0.006 | -10.53% | $0.052 | $0.05 | 274,348 | $19.89M | -48.49% | |
| - | AOA |
Ausmon Resources Ltd
|
$0.001 | 0.00 | 0.00% | $0.00 | $0.00 | - | $1.35M | -50.00% |
| AR1 |
Austral Resources Australia Ltd
|
$0.065 | +0.004 | +6.56% | $0.065 | $0.061 | 2,240,362 | $162.18M | -59.38% | |
| - | ARI |
Arika Resources Ltd
|
$0.022 | 0.00 | 0.00% | $0.023 | $0.022 | 245,793 | $27.14M | -40.54% |
| - | ARV |
Artemis Resources Ltd
|
$0.004 | 0.00 | 0.00% | $0.004 | $0.004 | 181,693 | $15.77M | -30.00% |
| AS2 |
Askari Metals Ltd
|
$0.008 | -0.001 | -11.11% | $0.009 | $0.008 | 115,395 | $6.31M | +13.92% | |
| - | AUG |
Augustus Minerals Ltd
|
$0.036 | 0.00 | 0.00% | $0.00 | $0.00 | - | $9.29M | -20.00% |
| - | AVW |
Avira Resources Ltd
|
$0.008 | 0.00 | 0.00% | $0.008 | $0.008 | 291,876 | $4.6M | +14.29% |
| BHP |
BHP Group Ltd
|
$59.14 | -1.42 | -2.35% | $60.65 | $58.56 | 5,987,872 | $300.51B | +51.22% | |
| - | BMG |
Wa Gold Ltd
|
$0.035 | 0.00 | 0.00% | $0.00 | $0.00 | - | $44.14M | +250.00% |
| BOA |
BOA Resources Ltd
|
$0.059 | -0.004 | -6.35% | $0.063 | $0.059 | 158,887 | $17.15M | +227.78% | |
| BOC |
Bougainville Copper Ltd
|
$0.25 | +0.01 | +4.17% | $0.25 | $0.248 | 52,500 | $100.27M | -56.14% | |
| BUX |
Buxton Resources Ltd
|
$0.041 | +0.001 | +2.50% | $0.041 | $0.036 | 2,258,900 | $19.13M | -12.77% | |
| BVR |
Bellavista Resources Ltd
|
$0.365 | -0.01 | -2.67% | $0.375 | $0.36 | 161,481 | $78.83M | +23.73% | |
| - | BYH |
Bryah Resources Ltd
|
$0.004 | 0.00 | 0.00% | $0.00 | $0.00 | - | $5.94M | 0.00% |
| C29 |
C29 Metals Ltd
|
$0.013 | -0.002 | -13.33% | $0.014 | $0.013 | 171,555 | $2.91M | -40.91% | |
| CAE |
Cannindah Resources Ltd
|
$0.034 | +0.001 | +3.03% | $0.034 | $0.033 | 525,828 | $48.68M | +75.14% | |
| CAZ |
Cazaly Resources Ltd
|
$0.022 | +0.003 | +15.79% | $0.022 | $0.021 | 284,084 | $12.96M | +10.00% | |
| CBE |
Cobre Ltd
|
$0.265 | +0.005 | +1.92% | $0.27 | $0.25 | 4,813,052 | $256.1M | +562.50% | |
| CHN |
Chalice Mining Ltd
|
$1.15 | -0.04 | -3.36% | $1.19 | $1.15 | 1,330,854 | $448.69M | -36.29% | |
| - | CLE |
Cyclone Metals Ltd
|
$0.049 | 0.00 | 0.00% | $0.00 | $0.00 | - | $54.19M | -7.55% |
| - | COY |
Coppermoly Ltd
|
$0.004 | 0.00 | 0.00% | $0.004 | $0.004 | 246 | $3.53M | -63.64% |
| CPM |
Cooper Metals Ltd
|
$0.058 | -0.004 | -6.45% | $0.059 | $0.057 | 196,751 | $5.68M | +20.83% | |
| CPO |
Culpeo Minerals Ltd
|
$0.013 | +0.003 | +30.00% | $0.014 | $0.012 | 12,663,419 | $10.34M | +8.33% | |
| - | CRS |
Caprice Resources Ltd
|
$0.082 | 0.00 | 0.00% | $0.083 | $0.081 | 679,236 | $71.18M | +64.00% |
| - | CSE |
Copper Strike Ltd
|
$0.155 | 0.00 | 0.00% | $0.00 | $0.00 | - | $20.81M | 0.00% |
| CTM |
Centaurus Metals Ltd
|
$0.45 | -0.01 | -2.17% | $0.475 | $0.445 | 616,497 | $254.98M | +28.57% | |
| CUF |
Cufe Ltd
|
$0.055 | -0.005 | -8.33% | $0.062 | $0.055 | 10,597,643 | $114.04M | +587.50% | |
| - | CUL |
Cullen Resources Ltd
|
$0.006 | 0.00 | 0.00% | $0.00 | $0.00 | - | $4.16M | +20.00% |
| - | CUS |
Copper Search Ltd
|
$0.018 | 0.00 | 0.00% | $0.00 | $0.00 | - | $3.36M | -70.76% |
| CVV |
Caravel Minerals Ltd
|
$0.235 | -0.01 | -4.08% | $0.24 | $0.235 | 252,691 | $131.31M | +46.88% | |
| - | CWX |
Carawine Resources Ltd
|
$0.105 | 0.00 | 0.00% | $0.00 | $0.00 | - | $24.79M | +7.14% |
| - | CXM |
Centrex Ltd
|
$0.017 | 0.00 | 0.00% | $0.00 | $0.00 | - | $14.75M | -54.05% |
| CYM |
Cyprium Metals Ltd
|
$0.42 | -0.015 | -3.45% | $0.43 | $0.42 | 87,584 | $242.79M | +24.83% | |
| - | CZN |
Corazon Mining Ltd
|
$0.084 | 0.00 | 0.00% | $0.088 | $0.084 | 708,088 | $20.08M | -16.00% |
| - | DBO |
Diablo Resources Ltd
|
$0.012 | 0.00 | 0.00% | $0.00 | $0.00 | - | $6.06M | -25.00% |
| DEV |
DEVEX Resources Ltd
|
$0.26 | +0.01 | +4.00% | $0.26 | $0.24 | 842,347 | $184.69M | +198.85% | |
| - | DME |
Dome Gold Mines Ltd
|
$0.045 | 0.00 | 0.00% | $0.049 | $0.045 | 81,645 | $18.89M | -71.88% |
| - | DMM |
DMC Mining Ltd
|
$0.058 | 0.00 | 0.00% | $0.00 | $0.00 | - | $2.69M | 0.00% |
| DRE |
Dreadnought Resources Ltd
|
$0.013 | -0.001 | -7.14% | $0.014 | $0.013 | 2,873,360 | $74.43M | +18.18% | |
| DRX |
Diatreme Resources Ltd
|
$0.012 | +0.001 | +9.09% | $0.012 | $0.011 | 373,284 | $60.1M | -33.33% | |
| DVP |
Develop Global Ltd
|
$5.83 | -0.18 | -3.00% | $6.09 | $5.82 | 677,643 | $1.92B | +24.57% | |
| E25 |
Element 25 Ltd
|
$0.235 | -0.005 | -2.08% | $0.238 | $0.23 | 19,876 | $76.6M | +2.17% | |
| - | EEL |
Enrg Elements Ltd
|
$0.002 | 0.00 | 0.00% | $0.00 | $0.00 | - | $7.92M | -10.00% |
| - | EM2 |
Eagle Mountain Mining Ltd
|
$0.006 | 0.00 | 0.00% | $0.006 | $0.006 | 100,000 | $9.23M | +1.45% |
| ENR |
Encounter Resources Ltd
|
$0.25 | -0.005 | -1.96% | $0.255 | $0.25 | 92,551 | $140M | -10.71% | |
| EPM |
Eclipse Metals Ltd
|
$0.014 | -0.001 | -6.67% | $0.015 | $0.014 | 1,152,486 | $46.09M | -26.32% | |
| - | ERL |
Empire Resources Ltd
|
$0.007 | 0.00 | 0.00% | $0.007 | $0.007 | 31,230 | $14.61M | +16.67% |
| EVN |
Evolution Mining Ltd
|
$11.00 | -0.34 | -3.00% | $11.13 | $10.91 | 7,459,251 | $22.34B | +46.28% | |
| - | EVR |
EV Resources Ltd
|
$0.005 | 0.00 | 0.00% | $0.00 | $0.00 | - | $15.2M | -50.00% |
| - | FBM |
Future Battery Minerals Ltd
|
$0.065 | 0.00 | 0.00% | $0.00 | $0.00 | - | $43.85M | +242.11% |
| FEG |
Far East Gold Ltd
|
$0.16 | +0.005 | +3.23% | $0.16 | $0.15 | 60,953 | $66.72M | -8.57% | |
| FFM |
Firefly Metals Ltd
|
$1.76 | -0.085 | -4.62% | $1.84 | $1.76 | 2,698,872 | $1.35B | +59.08% | |
| FG1 |
FLYNN Gold Ltd
|
$0.022 | +0.001 | +4.76% | $0.022 | $0.022 | 5,202,952 | $13.39M | -25.90% | |
| FTL |
Firetail Resources Ltd
|
$0.11 | +0.012 | +12.25% | $0.12 | $0.10 | 1,881,323 | $49.01M | +52.78% | |
| - | G1A |
Galena Mining Ltd
|
$0.059 | 0.00 | 0.00% | $0.00 | $0.00 | - | $44.4M | 0.00% |
| G50 |
G50 Corp Ltd
|
$0.535 | +0.005 | +0.94% | $0.535 | $0.525 | 39,530 | $109.73M | +181.58% | |
| - | GAL |
Galileo Mining Ltd
|
$0.11 | 0.00 | 0.00% | $0.11 | $0.11 | 2,863 | $21.74M | -31.25% |
| - | GBZ |
GBM Resources Ltd
|
$0.029 | 0.00 | 0.00% | $0.00 | $0.00 | - | $131.03M | +222.22% |
| - | GCM |
GCM Corporation Ltd
|
$0.009 | 0.00 | 0.00% | $0.009 | $0.008 | 3,931,345 | $26.08M | -59.09% |
| - | GCR |
Golden Cross Resources Ltd
|
$0.002 | 0.00 | 0.00% | $0.00 | $0.00 | - | $2.19M | 0.00% |
| - | GES |
Genesis Resources Ltd
|
$0.005 | 0.00 | 0.00% | $0.00 | $0.00 | - | $3.91M | 0.00% |
| GRL |
Godolphin Resources Ltd
|
$0.018 | -0.001 | -5.26% | $0.019 | $0.018 | 182,982 | $15.25M | +63.64% | |
| HCH |
Hot Chili Ltd
|
$1.56 | +0.005 | +0.32% | $1.59 | $1.52 | 193,832 | $316.19M | +142.91% | |
| HGO |
Hillgrove Resources Ltd
|
$0.065 | -0.001 | -1.52% | $0.066 | $0.064 | 6,232,743 | $230.05M | +75.68% | |
| - | HOR |
Horseshoe Metals Ltd
|
$0.019 | 0.00 | 0.00% | $0.00 | $0.00 | - | $14.25M | -32.14% |
| - | IDA |
Indiana Resources Ltd
|
$0.022 | 0.00 | 0.00% | $0.00 | $0.00 | - | $14.17M | -74.27% |
| IGO |
IGO Ltd
|
$6.88 | -0.12 | -1.71% | $6.98 | $6.77 | 2,010,561 | $5.21B | +45.46% | |
| - | IMI |
Infinity Mining Ltd
|
$0.007 | 0.00 | 0.00% | $0.007 | $0.007 | 18,340 | $3.92M | -22.22% |
| IVR |
Investigator Silver Ltd
|
$0.046 | -0.002 | -4.17% | $0.048 | $0.046 | 3,129,295 | $119.67M | +76.92% | |
| JAV |
Javelin Minerals Ltd
|
$0.083 | -0.007 | -7.78% | $0.091 | $0.083 | 182,028 | $23.63M | +33.87% | |
| - | JGH |
Jade Gas Holdings Ltd
|
$0.105 | 0.00 | 0.00% | $0.00 | $0.00 | - | $216.81M | +191.67% |
| - | JRV |
Jervois Global Ltd
|
$0.011 | 0.00 | 0.00% | $0.00 | $0.00 | - | $29.73M | -35.29% |
| KFM |
Kingfisher Mining Ltd
|
$0.08 | +0.001 | +1.27% | $0.08 | $0.08 | 147,342 | $8.33M | +101.01% | |
| KGL |
KGL Resources Ltd
|
$0.205 | +0.005 | +2.50% | $0.205 | $0.20 | 1,433,739 | $158.13M | +137.51% | |
| KLI |
Killi Resources Ltd
|
$0.16 | -0.015 | -8.57% | $0.175 | $0.16 | 582,163 | $39.82M | +433.33% | |
| KNI |
Kuniko Ltd
|
$0.026 | -0.002 | -7.14% | $0.028 | $0.026 | 1,060,075 | $5.32M | -69.58% | |
| - | KZR |
Kalamazoo Resources Ltd
|
$0.14 | 0.00 | 0.00% | $0.00 | $0.00 | - | $43.98M | +52.17% |
| LDR |
Lode Resources Ltd
|
$0.079 | -0.001 | -1.25% | $0.08 | $0.075 | 321,906 | $15.98M | -39.23% | |
| - | LGM |
Legacy Minerals Holdings Ltd
|
$0.11 | 0.00 | 0.00% | $0.11 | $0.105 | 112,719 | $22.01M | -42.11% |
| LKY |
Locksley Resources Ltd
|
$0.059 | -0.001 | -1.67% | $0.061 | $0.058 | 2,191,141 | $22.13M | -48.70% | |
| - | LML |
Lincoln Minerals Ltd
|
$0.012 | 0.00 | 0.00% | $0.013 | $0.012 | 1,694,917 | $32.31M | +79.86% |
| LSA |
Lachlan Star Ltd
|
$0.105 | -0.005 | -4.55% | $0.105 | $0.105 | 43,378 | $39.01M | +28.05% | |
| - | LYN |
Lycaon Resources Ltd
|
$0.13 | 0.00 | 0.00% | $0.00 | $0.00 | - | $7.54M | -23.53% |
| - | M24 |
Mamba Exploration Ltd
|
$0.018 | 0.00 | 0.00% | $0.018 | $0.018 | 4,150 | $8.78M | +12.50% |
| - | M3M |
M3 Mining Ltd
|
$0.025 | 0.00 | 0.00% | $0.00 | $0.00 | - | $5.22M | -3.85% |
| - | MAG |
Magmatic Resources Ltd
|
$0.03 | 0.00 | 0.00% | $0.03 | $0.029 | 100,000 | $15.07M | -49.15% |
| MBK |
Metal Bank Ltd
|
$0.011 | -0.001 | -8.33% | $0.012 | $0.011 | 2,750,254 | $10.03M | -4.10% | |
| MDI |
Middle Island Resources Ltd
|
$0.017 | +0.001 | +6.25% | $0.017 | $0.017 | 84,945 | $16.89M | -10.53% | |
| MEU |
Marmota Ltd
|
$0.075 | -0.004 | -5.06% | $0.078 | $0.075 | 281,317 | $97.16M | +92.31% | |
| MMA |
Maronan Metals Ltd
|
$0.41 | -0.01 | -2.38% | $0.425 | $0.41 | 63,745 | $128.85M | +82.22% | |
| MOH |
Moho Resources Ltd
|
$0.008 | -0.001 | -11.11% | $0.008 | $0.008 | 500,000 | $8.41M | +60.00% | |
| MRD |
Mount Ridley Mines Ltd
|
$0.022 | -0.002 | -8.33% | $0.025 | $0.02 | 6,962,119 | $29.22M | +905.71% | |
| - | NFM |
New Frontier Minerals Ltd
|
$0.006 | 0.00 | 0.00% | $0.006 | $0.005 | 2,655,271 | $10.43M | -45.46% |
| - | NME |
NEX Metals Exploration Ltd
|
$0.011 | 0.00 | 0.00% | $0.00 | $0.00 | - | $3.76M | -42.11% |
| NMR |
Native Mineral Resources Holdings Ltd
|
$0.051 | +0.003 | +6.25% | $0.052 | $0.049 | 1,542,188 | $57.72M | -68.13% | |
| - | NTM |
NT Minerals Ltd
|
$0.003 | 0.00 | 0.00% | $0.00 | $0.00 | - | $3.63M | +50.00% |
| NWM |
Norwest Minerals Ltd
|
$0.007 | +0.001 | +16.67% | $0.007 | $0.007 | 687,435 | $7.57M | -50.00% | |
| NXM |
Nexus Minerals Ltd
|
$0.047 | +0.003 | +6.82% | $0.049 | $0.046 | 475,721 | $28.38M | -33.80% | |
| OCT |
Octava Minerals Ltd
|
$0.02 | +0.001 | +5.26% | $0.02 | $0.02 | 50,000 | $2.22M | -41.18% | |
| ORP |
Orpheus Uranium Ltd
|
$0.094 | -0.005 | -5.05% | $0.10 | $0.094 | 287,322 | $33.1M | +154.05% | |
| OSM |
Osmond Resources Ltd
|
$0.745 | +0.015 | +2.06% | $0.77 | $0.73 | 48,434 | $102.83M | -17.22% | |
| PNN |
Power Minerals Ltd
|
$0.115 | -0.005 | -4.17% | $0.12 | $0.115 | 225,746 | $50.34M | +98.28% | |
| POD |
Podium Minerals Ltd
|
$0.036 | +0.002 | +5.88% | $0.036 | $0.035 | 11,702 | $35.7M | -33.14% | |
| - | PRL |
Province Resources Ltd
|
$0.041 | 0.00 | 0.00% | $0.00 | $0.00 | - | $48.44M | 0.00% |
| PSL |
Paterson Resources Ltd
|
$0.033 | -0.001 | -2.94% | $0.033 | $0.033 | 10,550 | $18.22M | +65.17% | |
| PTR |
PTR Minerals Ltd
|
$0.084 | -0.001 | -1.18% | $0.086 | $0.084 | 100,822 | $33.2M | -77.30% | |
| - | PUA |
Peak Minerals Ltd
|
$0.049 | 0.00 | 0.00% | $0.00 | $0.00 | - | $142.46M | +1921.24% |
| PXX |
Polarx Ltd
|
$0.015 | +0.001 | +3.45% | $0.015 | $0.014 | 64,957 | $40.88M | +66.67% | |
| QML |
Qmines Ltd
|
$0.053 | +0.002 | +3.92% | $0.053 | $0.051 | 377,306 | $40.92M | +12.77% | |
| - | QXR |
QX Resources Ltd
|
$0.003 | 0.00 | 0.00% | $0.003 | $0.003 | 40,187 | $6.48M | -38.13% |
| - | RCR |
Rincon Resources Ltd
|
$0.014 | 0.00 | 0.00% | $0.015 | $0.014 | 1,349,336 | $7.31M | -6.67% |
| - | RDN |
Raiden Resources Ltd
|
$0.003 | 0.00 | 0.00% | $0.003 | $0.003 | 516,515 | $10.35M | -25.00% |
| - | REE |
RAREX Ltd
|
$0.013 | 0.00 | 0.00% | $0.014 | $0.013 | 564,514 | $15.82M | -51.85% |
| - | RIL |
Redivium Ltd
|
$0.004 | 0.00 | 0.00% | $0.00 | $0.00 | - | $13.61M | 0.00% |
| - | RIM |
Rimfire Pacific Mining Ltd
|
$0.013 | 0.00 | 0.00% | $0.013 | $0.012 | 95,487 | $36.05M | -45.83% |
| RIO |
RIO Tinto Ltd
|
$164.89 | -0.58 | -0.35% | $165.40 | $163.06 | 794,990 | $61.31B | +49.20% | |
| RMI |
Resource Minerals International Ltd
|
$0.18 | -0.01 | -5.26% | $0.195 | $0.18 | 1,198,119 | $167.33M | +1400.00% | |
| - | RNU |
Renascor Resources Ltd
|
$0.056 | 0.00 | 0.00% | $0.058 | $0.056 | 525,841 | $142.59M | -8.20% |
| - | RNX |
Renegade Exploration Ltd
|
$0.003 | 0.00 | 0.00% | $0.00 | $0.00 | - | $6.21M | -25.00% |
| - | RON |
Ronin Resources Ltd
|
$0.16 | 0.00 | 0.00% | $0.00 | $0.00 | - | $6.46M | +14.29% |
| RRR |
Revolver Resources Holdings Ltd
|
$0.068 | -0.002 | -2.86% | $0.073 | $0.068 | 314,893 | $21.26M | +13.33% | |
| - | RXM |
REX Minerals Ltd
|
$0.465 | 0.00 | 0.00% | $0.00 | $0.00 | - | $371.19M | +184.06% |
| - | SBR |
Sabre Resources Ltd
|
$0.007 | 0.00 | 0.00% | $0.00 | $0.00 | - | $4.72M | -30.00% |
| - | SCN |
Scorpion Minerals Ltd
|
$0.026 | 0.00 | 0.00% | $0.00 | $0.00 | - | $14.1M | +36.84% |
| - | SER |
Strategic Energy Resources Ltd
|
$0.135 | 0.00 | 0.00% | $0.00 | $0.00 | - | $8.93M | +12.50% |
| SFR |
Sandfire Resources Ltd
|
$18.65 | -0.37 | -1.95% | $18.96 | $18.37 | 924,177 | $8.71B | +69.08% | |
| SHN |
Sunshine Metals Ltd
|
$0.029 | +0.001 | +3.57% | $0.03 | $0.029 | 2,802,456 | $104.26M | +190.00% | |
| - | SKY |
SKY Metals Ltd
|
$0.24 | 0.00 | 0.00% | $0.25 | $0.23 | 1,132,741 | $238.16M | +242.86% |
| - | SMG |
Silver Metal Group Ltd
|
$0.00 | 0.00 | 0.00% | $0.00 | $0.00 | - | $0 | 0.00% |
| SVM |
Sovereign Metals Ltd
|
$0.52 | -0.005 | -0.95% | $0.53 | $0.51 | 370,517 | $341.1M | -30.20% | |
| TAT |
Tartana Minerals Ltd
|
$0.02 | -0.002 | -9.09% | $0.022 | $0.02 | 2,965,018 | $7.82M | -42.86% | |
| TM1 |
Terra Metals Ltd
|
$0.21 | -0.015 | -6.67% | $0.225 | $0.205 | 2,676,108 | $216.49M | +296.23% | |
| TMS |
Tennant Minerals Ltd
|
$0.008 | +0.001 | +7.14% | $0.008 | $0.007 | 1,266,636 | $9.99M | +7.14% | |
| TNC |
True North Copper Ltd
|
$0.40 | -0.01 | -2.44% | $0.405 | $0.38 | 129,561 | $62.15M | 0.00% | |
| - | TX3 |
Trinex Minerals Ltd
|
$0.18 | 0.00 | 0.00% | $0.00 | $0.00 | - | $8.4M | -52.76% |
| VAU |
Vault Minerals Ltd
|
$4.95 | +0.06 | +1.23% | $5.00 | $4.86 | 8,501,540 | $5.12B | +92.80% | |
| - | VRL |
Verity Resources Ltd
|
$0.014 | 0.00 | 0.00% | $0.014 | $0.014 | 944,411 | $6.87M | -40.60% |
| WA1 |
WA1 Resources Ltd
|
$11.51 | -0.15 | -1.29% | $11.60 | $11.26 | 159,394 | $855.01M | -35.30% | |
| - | WC1 |
West Cobar Metals Ltd
|
$0.015 | 0.00 | 0.00% | $0.015 | $0.015 | 1,218,500 | $6.24M | -16.67% |
| WCN |
White Cliff Minerals Ltd
|
$0.018 | +0.001 | +5.88% | $0.018 | $0.017 | 8,991,711 | $59.49M | -9.98% | |
| WGX |
Westgold Resources Ltd
|
$4.68 | +0.01 | +0.21% | $4.74 | $4.60 | 1,754,437 | $4.42B | +67.74% | |
| - | X64 |
Ten Sixty Four Ltd
|
$0.57 | 0.00 | 0.00% | $0.00 | $0.00 | - | $129.84M | 0.00% |
| - | XAM |
Xanadu Mines Ltd
|
$0.08 | 0.00 | 0.00% | $0.00 | $0.00 | - | $183.3M | +45.46% |
| ZIM |
Zimplats Holdings Ltd
|
$13.20 | -0.02 | -0.15% | $13.38 | $13.20 | 2,792 | $1.42B | -15.92% | |
| - | ZNC |
Zenith Minerals Ltd
|
$0.09 | 0.00 | 0.00% | $0.091 | $0.089 | 440,000 | $56.57M | +164.71% |
Australia holds 13% of the world's copper resources which is second only to Chile (25%). The largest domestic resources are at Olympic Dam (SA) and Mount Isa (QLD) [1] View an image of Australia's 2016 copper deposits and operating mines.
()
20min delayed
- (-)
Day High: -
Day Low: -
-
1 Year Return
Historical Chart
All Commodities
Aluminium Coal Cobalt Copper Crude Oil Gold Graphite Hydrogen Iron Ore Lead Lithium Mineral Sands Natural Gas Nickel Palladium Platinum Potash Rare Earth Silver Tin Uranium Vanadium ZincResources
![]()
(Spreadsheet)
Download a spreadsheet of the official copper price (USD/tonne) since 1978.
![]()
(High-Definition Map)
A huge 8MB image with all Australia's copper deposits.
![]()
All Australian Mineral Resources
(High-Definition Map)
A list of Australia’s major minerals with statistics and maps outlining all known deposits and operating mines.