Silver Chart
About & Performance
Silver(Ag) is a precious metal that's around 1 / 80 the price of gold.
Demand for silver comes equally from both industrial and investment avenues(significantly more than gold's 11% industrial demand). This unique balance means that the economic outlook for the world economy can directly affect the price.
The U.S. Geological Survey (2015) states the global usage of silver is:
- Electrical & Electronics - 29%
- Coins & Medals - 25%
- Photography - 8%
- Jewellery & Silverware - 7%
- Other - 31%
The London bullion market (LBMA) is regarded as the industry benchmark with the spot price set once daily at 12:00pm GMT in US dollars. COMEX Futures are usually quoted online as they are transparent and trade 24 hours a day.
The ETFs Physical Silver (ETPMAG) is the only ASX listed ETF that tracks the physical price of silver.
Market Index tracks the COMEX Futures.
| Silver Prices | AUD | USD |
|---|---|---|
| Troy ounce (oz) | $85.61 | $59.52 |
| Pound (lb) | $1,248.46 | $868.06 |
| Gram (g) | $2.75 | $1.91 |
| Kilogram (kg) | $2,752.39 | $1,913.74 |
9:48pm 10/07 AEST USD/oz
| Performance USD/oz | Amount | Change |
|---|---|---|
| 1 Week | -2.88 | -4.61% |
| 1 Month | -7.82 | -11.61% |
| YTD | -11.74 | -16.47% |
| 1 Year | +21.08 | +54.85% |
9:48pm 10/07 AEST USD/oz
ASX Silver Companies
| Code | Company | Price | Chg | % Chg | High | Low | Volume | Mkt Cap | 1 Year | |
|---|---|---|---|---|---|---|---|---|---|---|
| AAU |
Antilles Gold Ltd
|
$0.008 | -0.001 | -6.25% | $0.008 | $0.007 | 993,710 | $24.59M | +50.00% | |
| AGC |
Australian Gold and Copper Ltd
|
$0.125 | +0.005 | +4.17% | $0.135 | $0.12 | 140,149 | $35.64M | -21.88% | |
| AGD |
Austral Gold Ltd
|
$0.125 | -0.005 | -3.85% | $0.135 | $0.12 | 33,062 | $83.51M | +108.33% | |
| AIS |
Aeris Resources Ltd
|
$0.37 | +0.015 | +4.23% | $0.38 | $0.36 | 9,200,517 | $553.92M | +94.74% | |
| ALK |
Alkane Resources Ltd
|
$1.42 | +0.05 | +3.66% | $1.44 | $1.40 | 2,554,466 | $1.93B | +111.19% | |
| AMI |
Aurelia Metals Ltd
|
$0.28 | +0.01 | +3.70% | $0.285 | $0.28 | 2,333,046 | $474.15M | +40.00% | |
| - | AMN |
Agrimin Ltd
|
$0.056 | 0.00 | 0.00% | $0.00 | $0.00 | - | $21.84M | -28.21% |
| - | AOA |
Ausmon Resources Ltd
|
$0.001 | 0.00 | 0.00% | $0.00 | $0.00 | - | $1.35M | -33.33% |
| ARD |
Argent Minerals Ltd
|
$0.022 | -0.001 | -4.35% | $0.024 | $0.022 | 4,543,778 | $37.43M | +4.76% | |
| ASL |
Andean Silver Ltd
|
$2.02 | +0.07 | +3.59% | $2.04 | $1.97 | 254,702 | $429.65M | +74.14% | |
| AW1 |
American West Metals Ltd
|
$0.036 | +0.002 | +5.88% | $0.036 | $0.034 | 920,409 | $44.26M | -2.70% | |
| BHP |
BHP Group Ltd
|
$58.28 | +1.41 | +2.48% | $58.58 | $57.49 | 6,546,718 | $296.14B | +52.17% | |
| - | BMG |
Wa Gold Ltd
|
$0.035 | 0.00 | 0.00% | $0.00 | $0.00 | - | $44.14M | +250.00% |
| BSX |
Blackstone Minerals Ltd
|
$0.039 | -0.003 | -7.14% | $0.04 | $0.038 | 192,335 | $67.14M | -47.30% | |
| BVR |
Bellavista Resources Ltd
|
$0.40 | +0.03 | +8.11% | $0.415 | $0.38 | 528,942 | $86.39M | +31.15% | |
| CBE |
Cobre Ltd
|
$0.265 | -0.025 | -8.62% | $0.295 | $0.265 | 3,802,783 | $256.1M | +516.28% | |
| CYM |
Cyprium Metals Ltd
|
$0.43 | +0.025 | +6.17% | $0.435 | $0.415 | 195,523 | $248.57M | +31.67% | |
| DME |
Dome Gold Mines Ltd
|
$0.044 | +0.003 | +7.32% | $0.044 | $0.044 | 62,900 | $18.48M | -72.50% | |
| - | EEL |
Enrg Elements Ltd
|
$0.002 | 0.00 | 0.00% | $0.00 | $0.00 | - | $7.92M | -10.00% |
| EM2 |
Eagle Mountain Mining Ltd
|
$0.007 | +0.001 | +7.69% | $0.007 | $0.007 | 128,497 | $10.77M | +42.03% | |
| - | FG1 |
FLYNN Gold Ltd
|
$0.02 | 0.00 | 0.00% | $0.00 | $0.00 | - | $12.17M | -36.84% |
| - | G1A |
Galena Mining Ltd
|
$0.059 | 0.00 | 0.00% | $0.00 | $0.00 | - | $44.4M | 0.00% |
| GRL |
Godolphin Resources Ltd
|
$0.02 | +0.001 | +5.26% | $0.02 | $0.019 | 1,323,229 | $16.95M | +100.00% | |
| - | HRZ |
Maritana Minerals Ltd
|
$0.94 | 0.00 | 0.00% | $0.00 | $0.00 | - | $245.06M | +6.22% |
| - | ILT |
Iltani Resources Ltd
|
$0.40 | 0.00 | 0.00% | $0.40 | $0.40 | 1,709 | $31.89M | +116.22% |
| ION |
Iondrive Ltd
|
$0.033 | +0.004 | +13.79% | $0.033 | $0.03 | 1,675,338 | $42.77M | -31.25% | |
| IVR |
Investigator Silver Ltd
|
$0.049 | +0.001 | +2.08% | $0.051 | $0.048 | 5,833,255 | $127.47M | +104.17% | |
| KCN |
Kingsgate Consolidated Ltd
|
$4.99 | +0.21 | +4.39% | $5.00 | $4.85 | 525,940 | $1.33B | +99.60% | |
| KRM |
Kingsrose Mining Ltd
|
$0.023 | -0.003 | -11.54% | $0.026 | $0.023 | 683,447 | $17.33M | -28.13% | |
| LDR |
Lode Resources Ltd
|
$0.086 | -0.001 | -1.15% | $0.089 | $0.086 | 86,283 | $17.39M | -36.30% | |
| - | LYN |
Lycaon Resources Ltd
|
$0.13 | 0.00 | 0.00% | $0.00 | $0.00 | - | $7.54M | -23.53% |
| - | M24 |
Mamba Exploration Ltd
|
$0.019 | 0.00 | 0.00% | $0.00 | $0.00 | - | $9.26M | +46.15% |
| MKR |
Manuka Resources Ltd
|
$0.089 | +0.002 | +2.30% | $0.089 | $0.086 | 888,510 | $141.23M | +97.89% | |
| - | MMA |
Maronan Metals Ltd
|
$0.43 | 0.00 | 0.00% | $0.435 | $0.425 | 171,143 | $135.14M | +100.00% |
| - | MOH |
Moho Resources Ltd
|
$0.009 | 0.00 | 0.00% | $0.009 | $0.009 | 729 | $9.46M | +125.00% |
| - | MRD |
Mount Ridley Mines Ltd
|
$0.023 | 0.00 | 0.00% | $0.025 | $0.023 | 402,056 | $30.55M | +951.43% |
| MRQ |
MRG Metals Ltd
|
$0.004 | -0.001 | -12.50% | $0.004 | $0.004 | 25,011 | $10.45M | -12.50% | |
| MTH |
Mithril Silver and Gold Ltd
|
$0.24 | +0.01 | +4.35% | $0.245 | $0.24 | 18,658 | $45M | -45.46% | |
| NMG |
New Murchison Gold Ltd
|
$0.042 | +0.001 | +2.44% | $0.043 | $0.04 | 13,663,577 | $456.3M | +162.50% | |
| - | OLY |
Olympio Metals Ltd
|
$0.048 | 0.00 | 0.00% | $0.00 | $0.00 | - | $8.5M | -63.08% |
| POL |
Polymetals Resources Ltd
|
$0.915 | +0.015 | +1.67% | $0.94 | $0.905 | 502,460 | $281.36M | +25.34% | |
| - | PRS |
Prospech Ltd
|
$0.013 | 0.00 | 0.00% | $0.00 | $0.00 | - | $6.81M | -51.79% |
| - | PXX |
Polarx Ltd
|
$0.014 | 0.00 | 0.00% | $0.014 | $0.014 | 85,718 | $38.15M | +75.00% |
| - | RAG |
Ragnar Metals Ltd
|
$0.022 | 0.00 | 0.00% | $0.022 | $0.022 | 51,624 | $10.75M | +15.79% |
| - | RIE |
Riedel Resources Ltd
|
$0.021 | 0.00 | 0.00% | $0.00 | $0.00 | - | $5.51M | -16.24% |
| RND |
Rand Mining Ltd
|
$2.31 | +0.05 | +2.21% | $2.31 | $2.28 | 32 | $131.38M | +23.86% | |
| S32 |
SOUTH32 Ltd
|
$4.02 | +0.20 | +5.24% | $4.07 | $3.90 | 16,898,971 | $18.04B | +32.24% | |
| SFR |
Sandfire Resources Ltd
|
$18.83 | +0.68 | +3.75% | $19.11 | $18.64 | 1,320,086 | $8.79B | +69.64% | |
| - | SMG |
Silver Metal Group Ltd
|
$0.00 | 0.00 | 0.00% | $0.00 | $0.00 | - | $0 | 0.00% |
| - | SMI |
Santana Minerals Ltd
|
$0.45 | 0.00 | 0.00% | $0.465 | $0.445 | 1,592,201 | $443.59M | -16.67% |
| - | SRN |
Surefire Resources NL
|
$0.024 | 0.00 | 0.00% | $0.024 | $0.024 | 50,000 | $4.35M | -52.00% |
| SS1 |
Sun Silver Ltd
|
$0.945 | +0.045 | +5.00% | $0.97 | $0.90 | 1,407,298 | $173.89M | +22.73% | |
| SVL |
Silver Mines Ltd
|
$0.13 | +0.005 | +4.00% | $0.135 | $0.128 | 3,607,451 | $288.52M | +8.33% | |
| - | TAS |
Tasman Resources Ltd
|
$0.046 | 0.00 | 0.00% | $0.047 | $0.046 | 123,488 | $25.46M | +228.57% |
| - | TOR |
Torque Metals Ltd
|
$0.23 | 0.00 | 0.00% | $0.24 | $0.225 | 423,837 | $143.73M | +53.33% |
| USL |
Unico Silver Ltd
|
$0.68 | +0.025 | +3.82% | $0.705 | $0.655 | 2,012,621 | $431.43M | +115.87% | |
| WC1 |
West Cobar Metals Ltd
|
$0.017 | -0.001 | -2.94% | $0.017 | $0.016 | 1,383,518 | $6.86M | -8.33% | |
| WCE |
West Coast Silver Ltd
|
$0.115 | +0.01 | +9.52% | $0.115 | $0.103 | 540,015 | $41.68M | +40.24% | |
| - | XTC |
XTC Lithium Ltd
|
$0.00 | 0.00 | 0.00% | $0.00 | $0.00 | - | $0 | 0.00% |
| ZIM |
Zimplats Holdings Ltd
|
$13.35 | +0.53 | +4.13% | $13.35 | $12.82 | 3,236 | $1.44B | -11.53% |
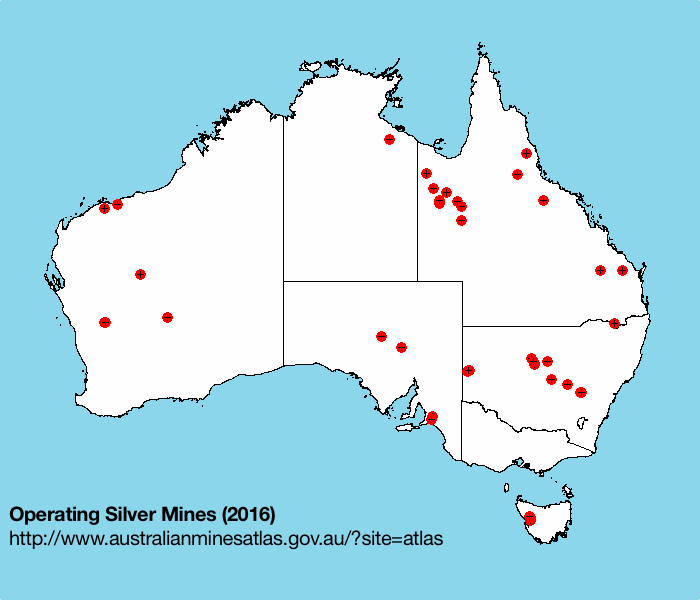
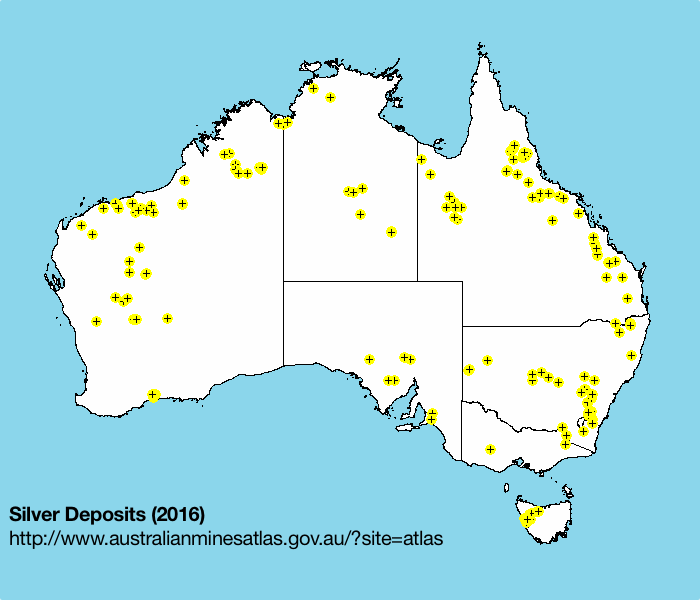
The ASX doesn't have many silver companies. Most companies mine silver as a by-product of producing other metals (e.g. lead, zinc, copper and gold). Australia holds around 16% of the world's silver resources with 55% located in Queensland [1]. View an image of Australia's 2016 silver deposits and operating mines .
()
20min delayed
- (-)
Day High: -
Day Low: -
-
1 Year Return
FAQs
Historical Chart
All Commodities
Aluminium Coal Cobalt Copper Crude Oil Gold Graphite Hydrogen Iron Ore Lead Lithium Mineral Sands Natural Gas Nickel Palladium Platinum Potash Rare Earth Silver Tin Uranium Vanadium ZincResources
![]()
(Spreadsheet)
Download a spreadsheet of the official silver price (USD/oz) since 1968.
![]()
All Australian Mineral Resources (9 Maps)
(High-Definition Map)
A list of Australia's major minerals with statistics and maps outlining all known deposits and operating mines.