
ASX Short Sale Positions
Daily update on all companies
Background
The goal of this page is to better inform ASX investors of short selling in the market.
Although short position data does not provide tradable signals, a large increase or decrease in a company’s short positions can be an early indicator of changing investor sentiment. It can also be used to uncover what the “professional money” is doing.
To see how short selling allows investors to profit from a falling market, read the "What is Short Selling?" tutorial under the table.
Short Sale Data
Short sale data shows the amount of shares on issue currently reported as short sold.
The data is four trading days behind today's date as reporting isn’t mandatory until 9am (Sydney) three business days (T+3) post trade.
Since June 2010 the Australian Securities and Investments Commission (ASIC) has required all stockbrokers to report their total short sale positions daily. This information is released four business days (T+4) after the trade on ASIC’s website.
The Australian Securities Exchange (ASX) publishes a list of short sale transactions reported on the most recent trading day.
Open ASX Short Positions
Data: 18 Jan 2021
Code | Company | Short | Week Mvt | Days to Cover | |
---|---|---|---|---|---|
1 | WEB | Webjet Ltd | 14.9% | +0.03% | 20.0 |
2 | TGR | Tassal Group Ltd | 12.2% | +0.11% | 34.6 |
3 | MSB | Mesoblast Ltd | 10.28% | +0.38% | 19.4 |
4 | SDA | Speedcast International Ltd | 9.27% | +0.09% | 0.0 |
5 | ING | Inghams Group Ltd | 8.39% | -0.07% | 35.7 |
6 | AVH | Avita Medical Inc | 8.22% | +0.50% | 4.8 |
7 | IVC | Invocare Ltd | 8.06% | -0.08% | 53.4 |
8 | A2M | The a2 Milk Company Ltd | 7.84% | -0.21% | 21.2 |
9 | SSM | Service Stream Ltd | 7.3% | +0.22% | 18.9 |
10 | MTS | Metcash Ltd | 7.27% | -0.03% | 28.1 |
11 | MYR | Myer Holdings Ltd | 7.19% | -0.65% | 20.6 |
12 | FLT | Flight Centre Travel Group Ltd | 7.14% | -0.47% | 8.5 |
13 | WSA | Western Areas Ltd | 7% | -0.14% | 13.0 |
14 | FNP | Freedom Foods Group Ltd | 6.94% | +0.07% | 0.0 |
15 | RSG | Resolute Mining Ltd | 6.88% | +1.59% | 12.2 |
16 | EML | EML Payments Ltd | 6.69% | +0.16% | 15.1 |
17 | Z1P | ZIP Co Ltd | 6.57% | -0.57% | 1.7 |
18 | NEA | Nearmap Ltd | 6.11% | -0.19% | 10.9 |
19 | EOS | Electro Optic Systems Holdings Ltd | 5.8% | +0.01% | 16.7 |
20 | NST | Northern Star Resources Ltd | 5.7% | +2.20% | 4.1 |
21 | CUV | Clinuvel Pharmaceuticals Ltd | 5.69% | -0.03% | 26.6 |
22 | BVS | Bravura Solutions Ltd | 5.6% | +0.77% | 8.8 |
23 | ALK | Alkane Resources Ltd | 5.42% | -0.02% | 11.8 |
24 | BOQ | Bank of Queensland Ltd | 5.15% | +0.21% | 17.6 |
25 | PME | Pro Medicus Ltd | 5.09% | -0.11% | 10.5 |
26 | BUB | Bubs Australia Ltd | 5.01% | -0.02% | 23.4 |
27 | JBH | JB Hi-Fi Ltd | 4.96% | -0.33% | 11.5 |
28 | BEN | Bendigo and Adelaide Bank Ltd | 4.81% | +0.05% | 21.2 |
29 | AMA | AMA Group Ltd | 4.79% | +0.02% | 24.8 |
30 | BGL | Bellevue Gold Ltd | 4.64% | +0.17% | 17.2 |
31 | SUL | Super Retail Group Ltd | 4.63% | -0.47% | 8.8 |
32 | SEK | Seek Ltd | 4.4% | -0.07% | 14.8 |
33 | GWA | GWA Group Ltd | 4.38% | -0.34% | 31.1 |
34 | SXL | Southern Cross Media Group Ltd | 4.35% | -0.14% | 20.4 |
35 | PAR | Paradigm Biopharmaceuticals Ltd | 4.28% | -0.03% | 22.0 |
36 | WHC | Whitehaven Coal Ltd | 4.24% | -0.76% | 3.6 |
37 | BKL | Blackmores Ltd | 4.16% | -0.06% | 45.9 |
38 | COE | Cooper Energy Ltd | 4.1% | -0.09% | 24.5 |
39 | PPT | Perpetual Ltd | 4.09% | +0.01% | 16.7 |
40 | OBL | Omni Bridgeway Ltd | 4.05% | +0.05% | 22.7 |
41 | SLC | Superloop Ltd | 4.04% | -0.01% | 28.8 |
42 | PGH | Pact Group Holdings Ltd | 3.92% | -0.02% | 100.8 |
43 | IEL | Idp Education Ltd | 3.87% | -0.05% | 20.4 |
44 | CLQ | Clean TEQ Holdings Ltd | 3.8% | -0.14% | 8.5 |
45 | WAF | West African Resources Ltd | 3.77% | +0.01% | 12.7 |
46 | SGM | Sims Ltd | 3.76% | -0.39% | 9.0 |
47 | ORE | Orocobre Ltd | 3.74% | -0.22% | 4.7 |
48 | CSR | CSR Ltd | 3.72% | +0.11% | 14.5 |
49 | BHP | BHP Group Ltd | 3.59% | 0.00% | 17.4 |
50 | TNE | Technology One Ltd | 3.55% | +0.38% | 3.7 |
51 | UWL | Uniti Group Ltd | 3.52% | -0.15% | 5.0 |
52 | AWC | Alumina Ltd | 3.49% | +0.16% | 7.5 |
53 | BIN | Bingo Industries Ltd | 3.49% | +0.06% | 7.5 |
54 | MP1 | Megaport Ltd | 3.47% | +0.11% | 4.9 |
55 | PLS | Pilbara Minerals Ltd | 3.45% | -0.38% | 2.6 |
56 | HVN | Harvey Norman Holdings Ltd | 3.42% | +0.37% | 10.2 |
57 | CLH | Collection House Ltd | 3.36% | -0.41% | 7.6 |
58 | SLR | Silver Lake Resources Ltd | 3.3% | +0.16% | 3.8 |
59 | SKI | Spark Infrastructure Group | 3.27% | +0.10% | 20.7 |
60 | AGL | AGL Energy Ltd | 3.25% | -0.40% | 8.5 |
61 | TPW | Temple & Webster Group Ltd | 3.21% | -0.06% | 5.0 |
62 | JIN | Jumbo Interactive Ltd | 3.2% | -0.19% | 11.6 |
63 | SHV | Select Harvests Ltd | 3.19% | +0.24% | 15.3 |
64 | INR | Ioneer Ltd | 3.17% | +0.02% | 6.5 |
65 | HUM | Humm Group Ltd | 3.1% | -0.03% | 9.6 |
66 | CGF | Challenger Ltd | 3.08% | +0.12% | 15.6 |
67 | RMS | Ramelius Resources Ltd | 3.04% | 0.00% | 4.6 |
68 | CVN | Carnarvon Petroleum Ltd | 2.97% | -0.01% | 29.1 |
69 | URW | Unibail-Rodamco-Westfield | 2.93% | +0.30% | 5.9 |
70 | ALG | Ardent Leisure Group Ltd | 2.89% | -0.08% | 15.6 |
71 | IFL | IOOF Holdings Ltd | 2.88% | +0.02% | 7.8 |
72 | PDN | Paladin Energy Ltd | 2.88% | -0.08% | 6.7 |
73 | GXY | Galaxy Resources Ltd | 2.86% | +0.01% | 2.8 |
74 | NAN | Nanosonics Ltd | 2.85% | -0.34% | 11.2 |
75 | KAR | Karoon Energy Ltd | 2.84% | +0.02% | 5.6 |
76 | TYR | Tyro Payments Ltd | 2.83% | +1.27% | 1.4 |
77 | HT1 | HT&E Ltd | 2.83% | 0.00% | 219.3 |
78 | ZNO | ZOONO Group Ltd | 2.78% | +0.28% | 21.6 |
79 | OPT | Opthea Ltd | 2.76% | +0.07% | 32.2 |
80 | CCP | Credit Corp Group Ltd | 2.71% | -0.47% | 9.7 |
81 | LIC | Lifestyle Communities Ltd | 2.7% | -0.02% | 33.5 |
82 | RRL | Regis Resources Ltd | 2.68% | +0.09% | 4.9 |
83 | ALX | Atlas Arteria | 2.65% | +0.04% | 19.7 |
84 | DOW | Downer Edi Ltd | 2.63% | -0.06% | 11.4 |
85 | EOF | Ecofibre Ltd | 2.54% | +0.13% | 41.0 |
86 | CMM | Capricorn Metals Ltd | 2.54% | +0.05% | 29.9 |
87 | NCZ | New Century Resources Ltd | 2.54% | -0.04% | 11.3 |
88 | SXY | SENEX Energy Ltd | 2.53% | -0.06% | 13.5 |
89 | NCK | Nick Scali Ltd | 2.51% | +0.26% | 10.3 |
90 | LOV | Lovisa Holdings Ltd | 2.5% | -0.11% | 27.6 |
91 | SKC | Skycity Entertainment Group Ltd | 2.5% | -0.02% | 61.0 |
92 | PNV | Polynovo Ltd | 2.43% | +0.16% | 3.6 |
93 | MYX | Mayne Pharma Group Ltd | 2.4% | -0.05% | 37.7 |
94 | NEC | Nine Entertainment Co. Holdings Ltd | 2.37% | +0.05% | 14.9 |
95 | LYC | Lynas Rare EARTHS Ltd | 2.37% | -0.15% | 2.1 |
96 | CWN | Crown Resorts Ltd | 2.3% | +0.04% | 14.0 |
97 | SPL | Starpharma Holdings Ltd | 2.27% | -0.76% | 17.3 |
98 | NHF | Nib Holdings Ltd | 2.25% | -0.12% | 11.1 |
99 | HUB | HUB24 Ltd | 2.21% | +0.21% | 5.2 |
100 | CIM | Cimic Group Ltd | 2.2% | -0.05% | 28.3 |
101 | OPY | Openpay Group Ltd | 2.18% | 0.00% | 2.2 |
102 | ABC | Adbri Ltd | 2.17% | -0.08% | 17.3 |
103 | SVW | Seven Group Holdings Ltd | 2.14% | -0.33% | 23.5 |
104 | SOL | Washington H Soul Pattinson & Company Ltd | 2.02% | -0.10% | 8.9 |
105 | EHL | Emeco Holdings Ltd | 2.01% | -0.12% | 8.4 |
106 | PRU | Perseus Mining Ltd | 2.01% | +0.30% | 3.1 |
107 | IMU | Imugene Ltd | 2% | +0.01% | 8.2 |
108 | MLX | Metals X Ltd | 1.95% | 0.00% | 3.5 |
109 | BPT | Beach Energy Ltd | 1.94% | -0.43% | 6.6 |
110 | VRT | Virtus Health Ltd | 1.94% | -0.01% | 13.5 |
111 | GEM | G8 Education Ltd | 1.9% | 0.00% | 8.4 |
112 | NWH | NRW Holdings Ltd | 1.9% | -0.03% | 5.6 |
113 | IRE | Iress Ltd | 1.83% | +0.08% | 11.2 |
114 | CPU | Computershare Ltd | 1.8% | -0.07% | 9.9 |
115 | ALU | Altium Ltd | 1.8% | +0.04% | 3.7 |
116 | JMS | Jupiter Mines Ltd | 1.79% | +0.08% | 23.6 |
117 | IPL | Incitec Pivot Ltd | 1.77% | +0.06% | 3.7 |
118 | APX | Appen Ltd | 1.72% | +0.06% | 2.8 |
119 | SAR | Saracen Mineral Holdings Ltd | 1.7% | +0.17% | 0.9 |
120 | CORE | ETFs Global Core Infrastructure ETF | 1.7% | +1.70% | 0.0 |
121 | TWE | Treasury Wine Estates Ltd | 1.67% | +0.03% | 6.0 |
122 | KGN | Kogan.com Ltd | 1.63% | -0.33% | 2.1 |
123 | MPL | Medibank Private Ltd | 1.61% | -0.03% | 6.6 |
124 | CLW | Charter Hall Long Wale REIT | 1.58% | +0.38% | 5.2 |
125 | REA | REA Group Ltd | 1.58% | +0.05% | 9.4 |
126 | AAC | Australian Agricultural Company Ltd | 1.54% | +0.02% | 32.3 |
127 | PBH | Pointsbet Holdings Ltd | 1.52% | +0.06% | 2.3 |
128 | MVP | Medical Developments International Ltd | 1.52% | -0.10% | 7.2 |
129 | ANN | Ansell Ltd | 1.5% | -0.04% | 3.9 |
130 | SYR | Syrah Resources Ltd | 1.49% | +0.34% | 1.6 |
131 | DEG | De Grey Mining Ltd | 1.48% | 0.00% | 5.2 |
132 | RWC | Reliance Worldwide Corporation Ltd | 1.46% | +0.24% | 6.7 |
133 | WTC | Wisetech Global Ltd | 1.46% | +0.04% | 7.7 |
134 | EXL | Elixinol Global Ltd | 1.42% | -0.05% | 2.5 |
135 | DXS | Dexus | 1.41% | -0.10% | 5.2 |
136 | PET | Phoslock Environmental Technologies Ltd | 1.4% | 0.00% | 0.0 |
137 | CMW | Cromwell Property Group | 1.39% | +0.06% | 15.5 |
138 | ISX | Isignthis Ltd | 1.37% | 0.00% | 0.0 |
139 | AMS | Atomos Ltd | 1.35% | +0.03% | 6.7 |
140 | SZL | Sezzle Inc | 1.35% | -0.14% | 1.7 |
141 | ILU | Iluka Resources Ltd | 1.35% | +0.51% | 2.7 |
142 | SGR | The Star Entertainment Group Ltd | 1.34% | -0.09% | 6.2 |
143 | NAB | National Australia Bank Ltd | 1.32% | +0.04% | 9.2 |
144 | QAN | Qantas Airways Ltd | 1.32% | -0.22% | 4.3 |
145 | MFG | Magellan Financial Group Ltd | 1.31% | +0.09% | 3.3 |
146 | ORI | Orica Ltd | 1.31% | -0.16% | 4.5 |
147 | OSH | Oil Search Ltd | 1.3% | +0.02% | 4.6 |
148 | PTM | Platinum Asset Management Ltd | 1.29% | +0.07% | 6.6 |
149 | SIV | SIV Capital Ltd | 1.28% | 0.00% | 108.4 |
150 | WOR | Worley Ltd | 1.28% | -0.33% | 5.2 |
151 | JHG | Janus Henderson Group Plc | 1.28% | +0.07% | 2.9 |
152 | MND | Monadelphous Group Ltd | 1.27% | -0.22% | 4.9 |
153 | VCX | Vicinity Centres | 1.25% | -0.08% | 5.2 |
154 | ELO | Elmo Software Ltd | 1.24% | 0.00% | 4.6 |
155 | APT | Afterpay Ltd | 1.23% | +0.03% | 1.7 |
156 | BLD | Boral Ltd | 1.22% | +0.02% | 5.5 |
157 | OZL | OZ Minerals Ltd | 1.22% | -0.78% | 3.7 |
158 | ELD | Elders Ltd | 1.2% | +0.70% | 2.4 |
159 | SCG | Scentre Group | 1.2% | +0.04% | 5.2 |
160 | WPL | Woodside Petroleum Ltd | 1.17% | -0.19% | 3.7 |
161 | AST | Ausnet Services Ltd | 1.17% | +0.02% | 9.2 |
162 | HSN | Hansen Technologies Ltd | 1.15% | +0.03% | 17.7 |
163 | NHC | New Hope Corporation Ltd | 1.14% | +0.05% | 7.3 |
164 | SBM | ST Barbara Ltd | 1.12% | +0.24% | 2.1 |
165 | LNG | Liquefied Natural Gas Ltd | 1.1% | 0.00% | 0.0 |
166 | MMS | Mcmillan Shakespeare Ltd | 1.1% | 0.00% | 5.8 |
167 | IGL | Ive Group Ltd | 1.08% | -0.07% | 8.2 |
168 | SFR | Sandfire Resources Ltd | 1.06% | -0.09% | 2.3 |
169 | ANZ | Australia and New Zealand Banking Group Ltd | 1.05% | +0.05% | 6.3 |
170 | CTD | Corporate Travel Management Ltd | 1.05% | -0.07% | 4.5 |
171 | IAG | Insurance Australia Group Ltd | 1.04% | +0.23% | 4.1 |
172 | LLC | Lendlease Group | 1.04% | +0.13% | 5.6 |
173 | RED | RED 5 Ltd | 1.03% | -0.01% | 4.8 |
174 | AMI | Aurelia Metals Ltd | 1.03% | +0.08% | 5.5 |
175 | SIQ | Smartgroup Corporation Ltd | 1.02% | +0.02% | 2.9 |
176 | SWM | Seven West Media Ltd | 1.02% | -0.01% | 2.5 |
177 | GMA | Genworth Mortgage Insurance Australia Ltd | 1.01% | -0.08% | 6.3 |
178 | SVY | Stavely Minerals Ltd | 1% | -0.03% | 9.9 |
179 | WPR | Waypoint REIT | 0.99% | +0.03% | 3.8 |
180 | MOC | Mortgage Choice Ltd | 0.99% | 0.00% | 11.0 |
181 | XRO | Xero Ltd | 0.98% | +0.09% | 3.2 |
182 | AMP | AMP Ltd | 0.98% | -0.07% | 4.8 |
183 | DMP | Domino's PIZZA Enterprises Ltd | 0.98% | -0.32% | 4.3 |
184 | EVT | Event Hospitality and Entertainment Ltd | 0.97% | +0.03% | 13.6 |
185 | AZJ | Aurizon Holdings Ltd | 0.97% | -0.08% | 2.9 |
186 | EVS | Envirosuite Ltd | 0.96% | +0.03% | 22.1 |
187 | WBC | Westpac Banking Corporation | 0.95% | +0.10% | 5.3 |
188 | ASM | Australian Strategic Materials Ltd | 0.95% | -0.04% | 2.0 |
189 | IPD | Impedimed Ltd | 0.95% | +0.03% | 4.1 |
190 | IRI | Integrated Research Ltd | 0.95% | +0.08% | 3.8 |
191 | COH | Cochlear Ltd | 0.95% | +0.50% | 3.1 |
192 | ORA | Orora Ltd | 0.93% | -0.08% | 3.9 |
193 | API | Australian Pharmaceutical Industries Ltd | 0.92% | -0.10% | 10.8 |
194 | NSR | National Storage REIT | 0.91% | 0.00% | 3.9 |
195 | EWC | Energy World Corporation Ltd | 0.91% | +0.13% | 8.9 |
196 | AMC | Amcor Plc | 0.91% | -0.31% | 4.2 |
197 | NWSLV | News Corporation | 0.9% | -0.01% | 0.0 |
198 | BWP | BWP Trust | 0.9% | +0.02% | 6.6 |
199 | CQR | Charter Hall Retail REIT | 0.88% | +0.01% | 4.5 |
200 | JHC | Japara Healthcare Ltd | 0.87% | -0.22% | 3.3 |
201 | WSP | Whispir Ltd | 0.86% | -0.05% | 1.2 |
202 | CNU | Chorus Ltd | 0.85% | +0.03% | 9.0 |
203 | DCN | Dacian Gold Ltd | 0.85% | +0.24% | 1.3 |
204 | PNI | Pinnacle Investment Management Group Ltd | 0.85% | -0.10% | 3.6 |
205 | NUF | Nufarm Ltd | 0.85% | -0.11% | 2.2 |
206 | STX | Strike Energy Ltd | 0.85% | +0.03% | 5.3 |
207 | CGC | Costa Group Holdings Ltd | 0.84% | -0.16% | 4.9 |
208 | SPT | Splitit Payments Ltd | 0.84% | +0.06% | 0.8 |
209 | NWL | Netwealth Group Ltd | 0.82% | +0.01% | 3.1 |
210 | MYS | Mystate Ltd | 0.81% | 0.00% | 13.1 |
211 | VEA | Viva Energy Group Ltd | 0.81% | +0.13% | 4.8 |
212 | ASX | ASX Ltd | 0.78% | +0.04% | 3.4 |
213 | VOC | Vocus Group Ltd | 0.78% | 0.00% | 5.4 |
214 | MNY | MONEY3 Corporation Ltd | 0.77% | -0.01% | 2.8 |
215 | STO | Santos Ltd | 0.76% | +0.05% | 3.0 |
216 | NXT | NEXTDC Ltd | 0.76% | +0.01% | 2.7 |
217 | IPH | IPH Ltd | 0.75% | +0.04% | 2.4 |
218 | UMG | United Malt Group Ltd | 0.72% | +0.02% | 2.1 |
219 | OCC | Orthocell Ltd | 0.72% | +0.03% | 0.8 |
220 | OSP | Osprey Medical Inc | 0.71% | -0.26% | 2.1 |
221 | A2B | A2B Australia Ltd | 0.71% | 0.00% | 19.3 |
222 | VHT | Volpara Health Technologies Ltd | 0.69% | -0.04% | 3.5 |
223 | RFF | Rural Funds Group | 0.69% | +0.01% | 10.6 |
224 | CWP | Cedar Woods Properties Ltd | 0.69% | +0.03% | 13.9 |
225 | ORG | Origin Energy Ltd | 0.68% | +0.11% | 2.0 |
226 | BET | Betmakers Technology Group Ltd | 0.68% | +0.07% | 1.3 |
227 | APA | APA Group | 0.68% | +0.02% | 4.8 |
228 | BGA | Bega Cheese Ltd | 0.68% | -0.13% | 2.8 |
229 | SHL | Sonic Healthcare Ltd | 0.68% | 0.00% | 3.5 |
230 | QUB | QUBE Holdings Ltd | 0.67% | +0.05% | 4.7 |
231 | CBA | Commonwealth Bank of Australia | 0.67% | +0.06% | 4.9 |
232 | WGX | Westgold Resources Ltd | 0.66% | +0.07% | 1.8 |
233 | AZS | AZURE Minerals Ltd | 0.65% | +0.31% | 0.9 |
234 | GOR | Gold Road Resources Ltd | 0.64% | -0.02% | 0.8 |
235 | CL1 | Class Ltd | 0.64% | 0.00% | 8.7 |
236 | OML | Ooh!Media Ltd | 0.64% | -0.03% | 2.4 |
237 | DRO | Droneshield Ltd | 0.64% | 0.00% | 2.2 |
238 | SVL | Silver Mines Ltd | 0.63% | -0.01% | 1.6 |
239 | SCP | Shopping Centres Australasia Property Group | 0.62% | -0.05% | 4.0 |
240 | SGP | Stockland | 0.62% | +0.31% | 2.4 |
241 | CBR | Carbon Revolution Ltd | 0.61% | +0.03% | 3.1 |
242 | RMD | Resmed Inc | 0.61% | +0.09% | 4.0 |
243 | WHA | Wattle Health Australia Ltd | 0.59% | 0.00% | 0.0 |
244 | S32 | SOUTH32 Ltd | 0.59% | +0.08% | 1.8 |
245 | CHN | Chalice Mining Ltd | 0.59% | -0.08% | 1.4 |
246 | DUB | Dubber Corporation Ltd | 0.59% | +0.02% | 1.7 |
247 | TIE | Tietto Minerals Ltd | 0.58% | +0.02% | 3.2 |
248 | AD8 | Audinate Group Ltd | 0.58% | -0.01% | 4.0 |
249 | BID | Bill Identity Ltd | 0.57% | +0.01% | 2.7 |
250 | IGO | IGO Ltd | 0.57% | -0.09% | 1.3 |
251 | CCX | City Chic Collective Ltd | 0.57% | -0.09% | 1.1 |
252 | BWX | BWX Ltd | 0.56% | +0.07% | 10.5 |
253 | SM1 | Synlait Milk Ltd | 0.56% | +0.01% | 19.8 |
254 | SSR | SSR Mining Inc | 0.56% | +0.22% | 14.6 |
255 | SYD | Sydney Airport | 0.55% | +0.01% | 3.1 |
256 | FFG | Fatfish Group Ltd | 0.55% | +0.01% | 1.0 |
257 | TAH | Tabcorp Holdings Ltd | 0.54% | -0.03% | 2.3 |
258 | NVA | Nova Minerals Ltd | 0.54% | +0.01% | 1.1 |
259 | GDI | GDI Property Group | 0.54% | 0.00% | 8.4 |
260 | KMD | Kathmandu Holdings Ltd | 0.53% | -0.01% | 6.1 |
261 | ASB | Austal Ltd | 0.52% | +0.02% | 1.3 |
262 | RIC | Ridley Corporation Ltd | 0.51% | -0.01% | 22.1 |
263 | BTH | Bigtincan Holdings Ltd | 0.5% | +0.04% | 1.2 |
264 | VUK | Virgin Money Uk Plc | 0.5% | -0.06% | 1.6 |
265 | APE | Eagers Automotive Ltd | 0.5% | -0.03% | 4.0 |
266 | HLO | Helloworld Travel Ltd | 0.5% | +0.04% | 2.8 |
267 | SLK | Sealink Travel Group Ltd | 0.49% | -0.02% | 3.1 |
268 | AEF | Australian Ethical Investment Ltd | 0.49% | -0.05% | 1.6 |
269 | CAN | Cann Group Ltd | 0.48% | +0.04% | 0.6 |
270 | OFX | OFX Group Ltd | 0.48% | +0.05% | 10.4 |
271 | ABY | Adore Beauty Group Ltd | 0.48% | -0.01% | 1.0 |
272 | JHX | James Hardie Industries Plc | 0.47% | +0.01% | 2.2 |
273 | NZM | NZME Ltd | 0.47% | +0.10% | 1.5 |
274 | CWY | Cleanaway Waste Management Ltd | 0.47% | -0.01% | 0.7 |
275 | RHC | Ramsay Health Care Ltd | 0.47% | +0.03% | 1.7 |
276 | RBTZ | Betashares Global Robotics and Artificial Intelligence ETF | 0.46% | +0.46% | 0.0 |
277 | MCP | Mcpherson's Ltd | 0.46% | -0.09% | 1.6 |
278 | AFG | Australian Finance Group Ltd | 0.45% | +0.08% | 2.0 |
279 | GPT | GPT Group | 0.45% | +0.10% | 2.7 |
280 | FBU | Fletcher Building Ltd | 0.45% | +0.01% | 4.0 |
281 | BLG | Bluglass Ltd | 0.44% | +0.01% | 3.8 |
282 | DRR | Deterra Royalties Ltd | 0.44% | +0.16% | 1.5 |
283 | ABR | American Pacific Borates Ltd | 0.44% | -0.01% | 2.1 |
284 | RDC | Redcape Hotel Group | 0.43% | 0.00% | 18.4 |
285 | SUN | Suncorp Group Ltd | 0.43% | -0.08% | 2.3 |
286 | PRN | Perenti Global Ltd | 0.43% | +0.05% | 2.1 |
287 | ABP | Abacus Property Group | 0.43% | +0.10% | 3.0 |
288 | RBL | Redbubble Ltd | 0.42% | +0.08% | 1.0 |
289 | MIN | Mineral Resources Ltd | 0.42% | -0.14% | 1.3 |
290 | LVT | Livetiles Ltd | 0.42% | -0.01% | 3.4 |
291 | TCL | Transurban Group | 0.4% | -0.09% | 2.1 |
292 | CQE | Charter Hall Social Infrastructure REIT | 0.4% | +0.01% | 2.7 |
293 | GOZ | Growthpoint Properties Australia | 0.4% | -0.01% | 5.5 |
294 | TTM | Titan Minerals Ltd | 0.4% | +0.07% | 0.3 |
295 | STA | Strandline Resources Ltd | 0.39% | 0.00% | 4.5 |
296 | TLS | Telstra Corporation Ltd | 0.39% | +0.11% | 2.6 |
297 | WES | Wesfarmers Ltd | 0.39% | 0.00% | 2.2 |
298 | WGN | Wagners Holding Company Ltd | 0.39% | -0.02% | 7.5 |
299 | BBUS | Betashares US Equities Strong Bear Currency Hedged (HF) | 0.39% | +0.39% | 0.0 |
300 | MQG | Macquarie Group Ltd | 0.39% | +0.05% | 2.3 |
301 | FZO | Family ZONE Cyber Safety Ltd | 0.39% | +0.08% | 2.9 |
302 | ISU | Iselect Ltd | 0.38% | 0.00% | 23.9 |
303 | REH | Reece Ltd | 0.38% | +0.01% | 4.0 |
304 | AGH | Althea Group Holdings Ltd | 0.37% | +0.04% | 1.1 |
305 | AVN | Aventus Group | 0.37% | 0.00% | 3.4 |
306 | RIO | RIO Tinto Ltd | 0.37% | +0.02% | 1.1 |
307 | WOW | Woolworths Group Ltd | 0.37% | +0.01% | 2.9 |
308 | MGR | Mirvac Group | 0.36% | -0.09% | 1.5 |
309 | OGC | Oceanagold Corporation | 0.36% | +0.03% | 0.3 |
310 | BUD | Buddy Technologies Ltd | 0.36% | -0.34% | 0.6 |
311 | BAP | Bapcor Ltd | 0.36% | -0.08% | 1.3 |
312 | MHJ | Michael Hill International Ltd | 0.35% | 0.00% | 10.5 |
313 | QBE | QBE Insurance Group Ltd | 0.35% | +0.07% | 1.0 |
314 | BKW | Brickworks Ltd | 0.34% | +0.01% | 2.0 |
315 | CNI | Centuria Capital Group | 0.34% | +0.02% | 4.6 |
316 | DHG | Domain Holdings Australia Ltd | 0.34% | +0.01% | 3.6 |
317 | IAP | Irongate Group | 0.34% | +0.04% | 3.2 |
318 | AIA | Auckland International Airport Ltd | 0.33% | -0.02% | 8.1 |
319 | MGX | Mount Gibson Iron Ltd | 0.33% | +0.03% | 3.5 |
320 | G1A | Galena Mining Ltd | 0.33% | 0.00% | 5.1 |
321 | PDL | Pendal Group Ltd | 0.33% | +0.10% | 1.4 |
322 | FBR | FBR Ltd | 0.33% | 0.00% | 1.6 |
323 | CIP | Centuria Industrial REIT | 0.33% | -0.02% | 1.4 |
324 | RCR | Rincon Resources Ltd | 0.33% | 0.00% | 1.0 |
325 | ALD | Ampol Ltd | 0.32% | +0.05% | 0.5 |
326 | IXC | INVEX Therapeutics Ltd | 0.31% | +0.01% | 1.3 |
327 | CHC | Charter Hall Group | 0.31% | -0.02% | 1.2 |
328 | BOT | Botanix Pharmaceuticals Ltd | 0.31% | -0.02% | 0.3 |
329 | COL | Coles Group Ltd | 0.31% | -0.10% | 2.6 |
330 | TPG | TPG Telecom Ltd | 0.3% | +0.01% | 8.0 |
331 | COF | Centuria Office REIT | 0.3% | -0.01% | 2.2 |
332 | VDGR | Vanguard Diversified Growth INDEX ETF | 0.3% | +0.30% | 0.0 |
333 | CAR | Carsales.com Ltd | 0.29% | +0.09% | 1.1 |
334 | IDX | Integral Diagnostics Ltd | 0.29% | +0.02% | 1.9 |
335 | DTL | Data#3 Ltd | 0.29% | -0.04% | 1.5 |
336 | REG | Regis Healthcare Ltd | 0.29% | -0.01% | 1.3 |
337 | GNC | Graincorp Ltd | 0.27% | +0.04% | 0.7 |
338 | ALL | Aristocrat Leisure Ltd | 0.27% | -0.02% | 1.0 |
339 | 360 | LIFE360 Inc | 0.27% | 0.00% | 0.7 |
340 | PCK | Painchek Ltd | 0.26% | 0.00% | 1.1 |
341 | PPS | Praemium Ltd | 0.26% | +0.05% | 0.6 |
342 | WCG | Webcentral Group Ltd | 0.26% | 0.00% | 3.5 |
343 | KNM | Kneomedia Ltd | 0.26% | 0.00% | 0.3 |
344 | FMG | Fortescue Metals Group Ltd | 0.25% | -0.03% | 1.5 |
345 | LNK | Link Administration Holdings Ltd | 0.25% | +0.02% | 0.4 |
346 | NGI | Navigator Global Investments Ltd | 0.24% | +0.09% | 0.7 |
347 | ALQ | Als Ltd | 0.24% | +0.09% | 1.5 |
348 | ARB | ARB Corporation Ltd | 0.24% | -0.04% | 1.3 |
349 | NIC | Nickel Mines Ltd | 0.23% | -0.03% | 0.9 |
350 | TRS | The Reject Shop Ltd | 0.23% | +0.23% | 0.8 |
351 | CLV | Clover Corporation Ltd | 0.23% | +0.01% | 1.6 |
352 | G88 | Golden Mile Resources Ltd | 0.23% | +0.01% | 0.9 |
353 | EHE | Estia Health Ltd | 0.22% | +0.03% | 1.0 |
354 | BXB | Brambles Ltd | 0.22% | -0.05% | 0.9 |
355 | SRV | Servcorp Ltd | 0.22% | 0.00% | 8.6 |
356 | AAJDA | Aruma Resources Ltd | 0.22% | +0.22% | 0.0 |
357 | MLD | Maca Ltd | 0.22% | -0.21% | 0.9 |
358 | NXS | Next Science Ltd | 0.22% | +0.01% | 2.3 |
359 | SGF | SG Fleet Group Ltd | 0.22% | 0.00% | 18.0 |
360 | TUA | Tuas Ltd | 0.22% | -0.01% | 6.3 |
361 | ECX | Eclipx Group Ltd | 0.21% | 0.00% | 2.0 |
362 | BBN | Baby Bunting Group Ltd | 0.21% | -0.01% | 0.6 |
363 | ABB | Aussie Broadband Ltd | 0.21% | 0.00% | 1.0 |
364 | ARV | Artemis Resources Ltd | 0.21% | 0.00% | 1.7 |
365 | BMN | Bannerman Resources Ltd | 0.21% | +0.08% | 0.5 |
366 | CE1 | Calima Energy Ltd | 0.21% | 0.00% | 1.9 |
367 | BRG | Breville Group Ltd | 0.19% | +0.04% | 0.8 |
368 | MVF | Monash Ivf Group Ltd | 0.19% | +0.02% | 1.7 |
369 | ADT | Adriatic Metals Plc | 0.18% | +0.01% | 2.2 |
370 | EVN | Evolution Mining Ltd | 0.17% | -0.53% | 0.5 |
371 | NWS | News Corporation | 0.17% | -0.16% | 0.5 |
372 | GUD | G.U.D. Holdings Ltd | 0.17% | +0.10% | 0.5 |
373 | FAR | FAR Ltd | 0.17% | 0.00% | 0.0 |
374 | ARF | Arena REIT | 0.17% | -0.03% | 2.4 |
375 | RAP | Resapp Health Ltd | 0.16% | -0.02% | 1.6 |
376 | SDF | Steadfast Group Ltd | 0.16% | -0.02% | 1.4 |
377 | INA | Ingenia Communities Group | 0.16% | +0.01% | 0.8 |
378 | AUB | AUB Group Ltd | 0.16% | 0.00% | 1.2 |
379 | GMG | Goodman Group | 0.15% | +0.04% | 1.0 |
380 | NCM | Newcrest Mining Ltd | 0.15% | -0.04% | 0.4 |
381 | VTG | Vita Group Ltd | 0.15% | 0.00% | 1.1 |
382 | HLS | Healius Ltd | 0.15% | +0.02% | 0.9 |
383 | VIP | VIP Gloves Ltd | 0.15% | +0.02% | 1.1 |
384 | NEU | Neuren Pharmaceuticals Ltd | 0.15% | 0.00% | 1.3 |
385 | TTT | Titomic Ltd | 0.14% | 0.00% | 0.7 |
386 | BDC | Bardoc Gold Ltd | 0.14% | 0.00% | 0.7 |
387 | NVX | Novonix Ltd | 0.14% | +0.04% | 0.1 |
388 | PMV | Premier Investments Ltd | 0.13% | +0.03% | 0.5 |
389 | SPK | Spark New Zealand Ltd | 0.13% | +0.01% | 2.3 |
390 | DNK | Danakali Ltd | 0.13% | 0.00% | 0.7 |
391 | CST | Castile Resources Ltd | 0.13% | -0.01% | 0.4 |
392 | YOJ | Yojee Ltd | 0.13% | +0.01% | 1.2 |
393 | OSX | Osteopore Ltd | 0.13% | +0.03% | 1.0 |
394 | CTM | Centaurus Metals Ltd | 0.13% | -0.01% | 0.9 |
395 | CRN | Coronado Global Resources Inc | 0.13% | 0.00% | 0.7 |
396 | FCL | Fineos Corporation Holdings Plc | 0.12% | +0.01% | 2.6 |
397 | FFX | Firefinch Ltd | 0.12% | -0.11% | 0.1 |
398 | VISM | Vanguard MSCI International Small Companies INDEX ETF | 0.12% | +0.12% | 0.0 |
399 | SOR | Strategic Elements Ltd | 0.12% | +0.10% | 0.0 |
400 | BSL | Bluescope Steel Ltd | 0.11% | -0.06% | 0.4 |
401 | HCT | Holista Colltech Ltd | 0.11% | 0.00% | 0.9 |
402 | CCL | Coca-Cola Amatil Ltd | 0.11% | +0.01% | 0.5 |
403 | FPH | Fisher & Paykel Healthcare Corporation Ltd | 0.11% | -0.07% | 0.9 |
404 | GAL | Galileo Mining Ltd | 0.11% | +0.01% | 0.1 |
405 | KRR | King River Resources Ltd | 0.11% | +0.02% | 0.2 |
406 | TNT | Tesserent Ltd | 0.1% | -0.09% | 0.3 |
407 | VDHG | Vanguard Diversified High Growth INDEX ETF | 0.1% | +0.10% | 0.0 |
408 | 9SP | 9 Spokes International Ltd | 0.1% | -0.01% | 0.2 |
409 | EVO | Evolve Education Group Ltd | 0.1% | -0.03% | 0.9 |
410 | SIG | Sigma Healthcare Ltd | 0.1% | -0.01% | 1.9 |
411 | OBM | Ora Banda Mining Ltd | 0.1% | 0.00% | 1.1 |
412 | WPP | WPP AUNZ Ltd | 0.1% | -0.01% | 1.1 |
413 | LBY | Laybuy Group Holdings Ltd | 0.1% | -0.06% | 0.4 |
414 | AMX | Aerometrex Ltd | 0.09% | 0.00% | 0.9 |
415 | DBI | Dalrymple Bay Infrastructure Ltd | 0.09% | +0.05% | 1.2 |
416 | LTR | Liontown Resources Ltd | 0.09% | -0.02% | 0.4 |
417 | RLG | Roolife Group Ltd | 0.09% | +0.09% | 0.3 |
418 | BRN | Brainchip Holdings Ltd | 0.09% | +0.01% | 0.1 |
419 | MCR | Mincor Resources NL | 0.09% | 0.00% | 0.7 |
420 | AVZ | AVZ Minerals Ltd | 0.09% | -0.03% | 0.1 |
421 | PNR | Pantoro Ltd | 0.08% | +0.02% | 0.5 |
422 | AX1 | Accent Group Ltd | 0.08% | +0.01% | 0.8 |
423 | ATU | Atrum Coal Ltd | 0.08% | -0.09% | 0.9 |
424 | CSL | CSL Ltd | 0.08% | -0.01% | 0.4 |
425 | PWH | PWR Holdings Ltd | 0.08% | 0.00% | 2.8 |
426 | STM | Sunstone Metals Ltd | 0.08% | 0.00% | 0.1 |
427 | HMC | Home Consortium | 0.08% | 0.00% | 2.7 |
428 | CKF | Collins Foods Ltd | 0.08% | +0.03% | 0.3 |
429 | AKP | Audio Pixels Holdings Ltd | 0.08% | 0.00% | 3.4 |
430 | BLX | Beacon Lighting Group Ltd | 0.07% | 0.00% | 1.2 |
431 | MDR | Medadvisor Ltd | 0.07% | 0.00% | 0.2 |
432 | AGI | Ainsworth Game Technology Ltd | 0.07% | +0.01% | 0.3 |
433 | NTO | Nitro Software Ltd | 0.07% | +0.02% | 0.4 |
434 | ATH | Alterity Therapeutics Ltd | 0.07% | -0.10% | 0.2 |
435 | CAT | Catapult Group International Ltd | 0.06% | +0.01% | 0.7 |
436 | 5GN | 5G Networks Ltd | 0.06% | +0.06% | 0.2 |
437 | WHK | Whitehawk Ltd | 0.06% | -0.04% | 0.0 |
438 | CIA | Champion Iron Ltd | 0.06% | -0.01% | 0.5 |
439 | STW | SPDR S&P/ASX 200 Fund | 0.06% | 0.00% | 0.3 |
440 | ANO | Advance Nanotek Ltd | 0.06% | 0.00% | 0.9 |
441 | AIZ | Air New Zealand Ltd | 0.06% | -0.01% | 0.8 |
442 | PAA | Pharmaust Ltd | 0.06% | +0.02% | 0.4 |
443 | DDR | Dicker Data Ltd | 0.06% | +0.01% | 0.9 |
444 | PEK | Peak Resources Ltd | 0.05% | 0.00% | 0.1 |
445 | AQZ | Alliance Aviation Services Ltd | 0.05% | 0.00% | 1.2 |
446 | DEV | DEVEX Resources Ltd | 0.05% | +0.02% | 0.2 |
447 | CEN | Contact Energy Ltd | 0.05% | 0.00% | 7.1 |
448 | LPI | Lithium Power International Ltd | 0.05% | +0.02% | 0.0 |
449 | PLL | Piedmont Lithium Ltd | 0.05% | +0.04% | 0.1 |
450 | AVA | AVA Risk Group Ltd | 0.05% | +0.04% | 0.1 |
451 | TGN | Tungsten Mining NL | 0.05% | 0.00% | 1.3 |
452 | BIT | Biotron Ltd | 0.05% | 0.00% | 0.2 |
453 | SSG | Shaver Shop Group Ltd | 0.05% | 0.00% | 0.6 |
454 | CDD | Cardno Ltd | 0.04% | 0.00% | 2.1 |
455 | SRN | Surefire Resources NL | 0.04% | +0.04% | 0.0 |
456 | CYL | Catalyst Metals Ltd | 0.04% | 0.00% | 1.1 |
457 | AGY | Argosy Minerals Ltd | 0.04% | -0.01% | 0.0 |
458 | BDA | Bod Australia Ltd | 0.04% | 0.00% | 0.2 |
459 | OKU | Oklo Resources Ltd | 0.04% | +0.01% | 0.6 |
460 | SO4 | Salt Lake Potash Ltd | 0.04% | 0.00% | 0.1 |
461 | AJM | Altura Mining Ltd | 0.04% | 0.00% | 0.0 |
462 | NUH | Nuheara Ltd | 0.04% | +0.02% | 0.1 |
463 | GPR | Geopacific Resources Ltd | 0.04% | 0.00% | 0.4 |
464 | SKT | Sky Network Television Ltd | 0.04% | 0.00% | 1.7 |
465 | PPH | Pushpay Holdings Ltd | 0.04% | -0.06% | 0.2 |
466 | EMV | Emvision Medical Devices Ltd | 0.04% | +0.04% | 0.1 |
467 | ALC | Alcidion Group Ltd | 0.04% | +0.01% | 0.2 |
468 | AUT | Auteco Minerals Ltd | 0.04% | 0.00% | 0.3 |
469 | NOX | Noxopharm Ltd | 0.04% | +0.03% | 0.1 |
470 | TD1 | Tali Digital Ltd | 0.04% | -0.01% | 0.1 |
471 | TLX | TELIX Pharmaceuticals Ltd | 0.04% | +0.01% | 0.2 |
472 | HPI | Hotel Property Investments | 0.04% | -0.01% | 0.5 |
473 | KSL | Kina Securities Ltd | 0.04% | 0.00% | 0.3 |
474 | VML | Vital Metals Ltd | 0.04% | -0.09% | 0.0 |
475 | AIS | Aeris Resources Ltd | 0.04% | -0.01% | 0.2 |
476 | LEP | Ale Property Group | 0.03% | +0.03% | 0.9 |
477 | DTC | Damstra Holdings Ltd | 0.03% | +0.01% | 0.2 |
478 | CPH | Creso Pharma Ltd | 0.03% | -0.09% | 0.0 |
479 | PAC | Pacific Current Group Ltd | 0.03% | 0.00% | 0.4 |
480 | IMD | IMDEX Ltd | 0.03% | 0.00% | 0.3 |
481 | DJRE | SPDR Dow Jones Global Real Estate Fund | 0.03% | +0.03% | 0.0 |
482 | PPE | People Infrastructure Ltd | 0.03% | +0.02% | 0.1 |
483 | TSO | Tesoro Resources Ltd | 0.03% | +0.01% | 0.1 |
484 | APD | Apn Property Group | 0.03% | 0.00% | 0.7 |
485 | BKY | Berkeley Energia Ltd | 0.03% | 0.00% | 1.2 |
486 | BOE | Boss Energy Ltd | 0.03% | 0.00% | 0.1 |
487 | BAT | Battery Minerals Ltd | 0.03% | -0.01% | 0.0 |
488 | NXL | NUIX Ltd | 0.03% | 0.00% | 0.1 |
489 | VUL | Vulcan Energy Resources Ltd | 0.03% | -0.03% | 0.0 |
490 | VAE | Vanguard Ftse Asia Ex Japan Shares INDEX ETF | 0.03% | +0.03% | 0.0 |
491 | WWI | West Wits Mining Ltd | 0.03% | -0.02% | 0.1 |
492 | WMX | Wiluna Mining Corporation Ltd | 0.03% | +0.01% | 0.4 |
493 | MMM | Marley Spoon AG | 0.02% | 0.00% | 0.3 |
494 | MOE | Moelis Australia Ltd | 0.02% | -0.01% | 1.2 |
495 | DCG | Decmil Group Ltd | 0.02% | 0.00% | 0.2 |
496 | BFG | Bell Financial Group Ltd | 0.02% | 0.00% | 0.3 |
497 | MMI | Metro Mining Ltd | 0.02% | 0.00% | 0.1 |
498 | PRX | Prodigy Gold NL | 0.02% | 0.00% | 0.1 |
499 | FLC | Fluence Corporation Ltd | 0.02% | 0.00% | 0.6 |
500 | IFM | Infomedia Ltd | 0.02% | 0.00% | 0.3 |
501 | CDA | Codan Ltd | 0.02% | -0.01% | 0.2 |
502 | HFR | Highfield Resources Ltd | 0.02% | 0.00% | 0.9 |
503 | VVA | Viva Leisure Ltd | 0.02% | +0.01% | 0.2 |
504 | AXE | Archer Materials Ltd | 0.02% | +0.02% | 0.0 |
505 | EEG | Empire Energy Group Ltd | 0.02% | -0.01% | 0.3 |
506 | WGO | Warrego Energy Ltd | 0.02% | 0.00% | 0.1 |
507 | SKY | SKY Metals Ltd | 0.02% | 0.00% | 0.1 |
508 | PPC | Peet Ltd | 0.02% | 0.00% | 0.7 |
509 | TLG | Talga Group Ltd | 0.02% | 0.00% | 0.0 |
510 | ICQ | Icar Asia Ltd | 0.01% | 0.00% | 0.5 |
511 | EDE | Eden Innovations Ltd | 0.01% | 0.00% | 0.0 |
512 | ACW | Actinogen Medical Ltd | 0.01% | 0.00% | 0.1 |
513 | AOF | Australian Unity Office Fund | 0.01% | 0.00% | 1.1 |
514 | 4DX | 4DMEDICAL Ltd | 0.01% | 0.00% | 0.1 |
515 | KCN | Kingsgate Consolidated Ltd | 0.01% | 0.00% | 0.1 |
516 | AUZ | Australian Mines Ltd | 0.01% | 0.00% | 0.0 |
517 | PRS | Prospech Ltd | 0.01% | 0.00% | 0.0 |
518 | FML | Focus Minerals Ltd | 0.01% | 0.00% | 0.7 |
519 | MYQ | Myfiziq Ltd | 0.01% | +0.01% | 0.0 |
520 | GGG | Greenland Minerals Ltd | 0.01% | -0.04% | 0.0 |
521 | VHY | Vanguard Australian Shares High Yield ETF | 0.01% | +0.01% | 0.1 |
522 | TGA | Thorn Group Ltd | 0.01% | 0.00% | 0.2 |
523 | GML | Gateway Mining Ltd | 0.01% | +0.01% | 0.0 |
524 | TRY | Troy Resources Ltd | 0.01% | 0.00% | 0.1 |
525 | SMP | Smartpay Holdings Ltd | 0.01% | 0.00% | 0.0 |
526 | SRG | SRG Global Ltd | 0.01% | 0.00% | 0.1 |
527 | IFT | Infratil Ltd | 0.01% | 0.00% | 1.5 |
528 | OMH | Om Holdings Ltd | 0.01% | 0.00% | 0.1 |
529 | RHP | Rhipe Ltd | 0.01% | 0.00% | 0.1 |
530 | BSX | Blackstone Minerals Ltd | 0.01% | 0.00% | 0.0 |
531 | GSS | Genetic Signatures Ltd | 0.01% | +0.01% | 0.1 |
532 | PAI | Platinum Asia Investments Ltd | 0.01% | 0.00% | 0.1 |
533 | FMS | Flinders Mines Ltd | 0.01% | 0.00% | 0.5 |
534 | RXL | ROX Resources Ltd | 0.01% | +0.01% | 0.0 |
535 | ADI | Apn Industria REIT | 0.01% | -0.01% | 0.1 |
536 | MAH | Macmahon Holdings Ltd | 0.01% | 0.00% | 0.1 |
537 | NEW | NEW Energy Solar | 0.01% | 0.00% | 0.1 |
538 | MCY | Mercury NZ Ltd | 0.01% | +0.01% | 2.9 |
539 | GLL | Galilee Energy Ltd | 0% | 0.00% | 0.1 |
540 | LYL | Lycopodium Ltd | 0% | 0.00% | 0.1 |
541 | WAM | WAM Capital Ltd | 0% | 0.00% | 0.0 |
542 | MME | Moneyme Ltd | 0% | 0.00% | 0.2 |
543 | PAN | Panoramic Resources Ltd | 0% | 0.00% | 0.0 |
544 | BKG | Booktopia Group Ltd | 0% | 0.00% | 0.0 |
545 | DTZ | DOTZ Nano Ltd | 0% | 0.00% | 0.0 |
546 | E2M | E2 Metals Ltd | 0% | 0.00% | 0.0 |
547 | LCL | Los Cerros Ltd | 0% | 0.00% | 0.0 |
548 | YFZ | Youfoodz Holdings Ltd | 0% | 0.00% | 0.0 |
549 | BPM | BPM Minerals Ltd | 0% | 0.00% | 0.0 |
550 | SHJ | Shine Justice Ltd | 0% | 0.00% | 0.1 |
551 | BLU | Blue Energy Ltd | 0% | 0.00% | 0.0 |
552 | MEZ | Meridian Energy Ltd | 0% | 0.00% | 0.2 |
553 | ETHI | Betashares Global Sustainability Leaders ETF | 0% | 0.00% | 0.0 |
554 | RDY | Readytech Holdings Ltd | 0% | 0.00% | 0.0 |
555 | GWR | GWR Group Ltd | 0% | 0.00% | 0.0 |
556 | BSE | Base Resources Ltd | 0% | 0.00% | 0.1 |
557 | RMC | Resimac Group Ltd | 0% | 0.00% | 0.0 |
558 | MAQ | Macquarie Telecom Group Ltd | 0% | 0.00% | 0.0 |
559 | ANG | Austin Engineering Ltd | 0% | 0.00% | 0.0 |
560 | OCL | Objective Corporation Ltd | 0% | 0.00% | 0.0 |
561 | LIT | Lithium Australia NL | 0% | 0.00% | 0.0 |
562 | PPK | PPK Group Ltd | 0% | 0.00% | 0.0 |
563 | SVH | Silver Heritage Group Ltd | 0% | -0.39% | 0.0 |
564 | BCN | Beacon Minerals Ltd | 0% | 0.00% | 0.0 |
565 | IVR | Investigator Resources Ltd | 0% | 0.00% | 0.0 |
566 | HDN | Homeco Daily Needs REIT | 0% | 0.00% | 0.0 |
567 | BKI | BKI Investment Company Ltd | 0% | 0.00% | 0.0 |
568 | ITG | Intega Group Ltd | 0% | 0.00% | 0.0 |
569 | PGC | Paragon Care Ltd | 0% | 0.00% | 0.0 |
570 | EXP | Experience Co Ltd | 0% | 0.00% | 0.0 |
571 | VN8 | VONEX Ltd | 0% | 0.00% | 0.0 |
572 | PXS | Pharmaxis Ltd | 0% | 0.00% | 0.0 |
573 | ADN | Andromeda Metals Ltd | 0% | -0.01% | 0.0 |
574 | AAJ | Aruma Resources Ltd | 0% | 0.00% | 0.0 |
575 | ARG | Argo Investments Ltd | 0% | 0.00% | 0.0 |
576 | RXM | REX Minerals Ltd | 0% | 0.00% | 0.0 |
577 | GTN | GTN Ltd | 0% | 0.00% | 0.0 |
578 | VEADA | Viva Energy Group Ltd | 0% | 0.00% | 0.0 |
579 | PGL | Prospa Group Ltd | 0% | 0.00% | 0.0 |
580 | KRM | Kingsrose Mining Ltd | 0% | 0.00% | 0.0 |
581 | JLG | Johns LYNG Group Ltd | 0% | 0.00% | 0.0 |
582 | SGH | Slater & Gordon Ltd | 0% | 0.00% | 0.0 |
583 | MOZ | Mosaic Brands Ltd | 0% | 0.00% | 0.0 |
584 | GMV | G Medical Innovations Holdings Ltd | 0% | 0.00% | 0.0 |
585 | AYS | Amaysim Australia Ltd | 0% | 0.00% | 0.0 |
586 | FCT | Firstwave Cloud Technology Ltd | 0% | 0.00% | 0.0 |
587 | PSI | PSC Insurance Group Ltd | 0% | 0.00% | 0.0 |
588 | AAA | Betashares Australian High Interest Cash ETF | 0% | 0.00% | 0.0 |
589 | CXL | CALIX Ltd | 0% | 0.00% | 0.0 |
590 | SDL | Sundance Resources Ltd | 0% | 0.00% | 0.0 |
591 | AHY | Asaleo Care Ltd | 0% | -0.20% | 0.0 |
592 | FID | Fiducian Group Ltd | 0% | 0.00% | 0.0 |
593 | EBO | Ebos Group Ltd | 0% | 0.00% | 0.0 |
594 | GRL | Godolphin Resources Ltd | 0% | 0.00% | 0.0 |
595 | BLY | Boart Longyear Ltd | 0% | 0.00% | 0.0 |
596 | ZIM | Zimplats Holdings Ltd | 0% | 0.00% | 0.0 |
597 | SF1 | Stemify Ltd | 0% | 0.00% | 0.0 |
598 | EMR | Emerald Resources NL | 0% | 0.00% | 0.0 |
599 | FRI | Finbar Group Ltd | 0% | 0.00% | 0.0 |
600 | WJA | Wameja Ltd | 0% | 0.00% | 0.0 |
601 | S2R | S2 Resources Ltd | 0% | 0.00% | 0.0 |
602 | MSL | MSL Solutions Ltd | 0% | 0.00% | 0.0 |
603 | PGF | PM Capital Global Opportunities Fund Ltd | 0% | 0.00% | 0.0 |
604 | RFG | Retail Food Group Ltd | 0% | 0.00% | 0.0 |
605 | FLN | Freelancer Ltd | 0% | 0.00% | 0.0 |
606 | BKT | Black Rock Mining Ltd | 0% | 0.00% | 0.0 |
607 | MGOC | Magellan Global Fund (Open Class) (Managed Fund) | 0% | 0.00% | 0.0 |
What is Short Selling?
Short selling is one of the most difficult concepts for novice investors to grasp.
The goal is to profit from a falling market by “borrowing” shares in a company to sell at the current market price, and buy those shares back at a later date after the price has fallen. The difference between the initial sell price and the later buyback price is the profit.
The easiest way to grasp the concept is to compare it with traditional share investment.
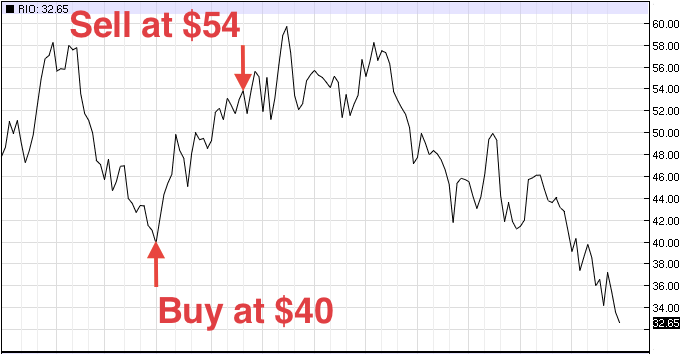
Long (Buy)
Going “long” is the traditional way of investing in the stock market; you profit when the share price goes up.
- You believe a companies share price will rise
- You buy shares at $40
- The share price rises to $54
- You sell the shares for a profit of $14 per share
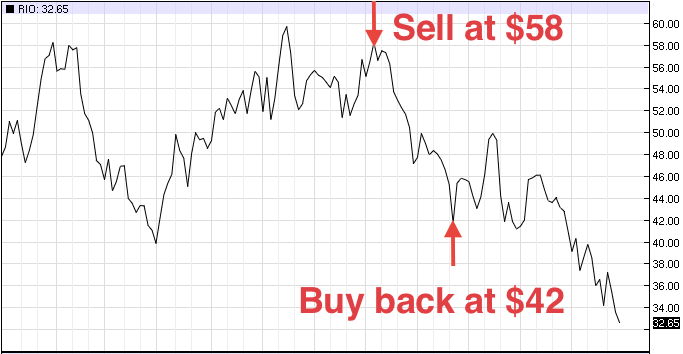
Short (Sell)
Going “short” is the opposite; you profit when the share price goes down.
- You believe a companies share price will fall
- You sell 1,000 "borrowed" shares at $58
- The share price falls to $42
- You buy 1,000 shares (to close the trade) at $42
- You made a profit of $16 per share

How can you sell shares you don’t own?
The most common way is called “Covered Short Selling” and it involves “borrowing” the shares from someone else (organised by your stockbroker).
To open a trade: You borrow shares and sell them at the current market price.
To close the trade: You buyback the same number of shares and return them to the original shareholder.
Another way is to “Naked Short Sell” and it involves a stockbroker placing a sell order on your behalf, even though you haven't borrowed any shares (hence the term "naked"). To close the trade you must buy back the exact number of shares that you originally sold.
Remember that everything is done on a computer. You’re not actually buying and selling a tangible asset; all that’s required is that the numbers in the regulator’s computer “even out” at the end.
Why would someone allow their stock to be short sold? Lenders can charge a borrowing fee which is passed on to the short seller. This is also why short sale positions tend to be shorter in investment duration than long trades.
Short Selling Advantages
1. Profit in a falling market
You can make money when share prices are falling.
2. Hedge your portfolio to reduce drawdown
A portfolio can be hedged with “short” positions to reduce drawdowns in down trending markets. Should the stock market turn negative, any profit made in the “short” trades will help counteract the losses made in the long trades.
Disadvantages
1. Difficulty to participate
Few Australian stockbrokers have the ability to short sell and those that do often have many obstacles. Additional paperwork, collateral requirements, pre-authorisation per trade, higher fees and a minimum trade size of $50,000 may be set.
2. Risk is unlimited
With traditional share investment your risk is limited to the amount you spent on the initial purchase (a share price can’t go below zero). With short selling a trade isn’t closed until you buyback the original number of shares sold, so your risk is unlimited (there is not upper limit to how high a share price can go).
For example, in 2008 Volkswagen was involved in a massive short-squeeze.
Short sellers panicked because the share price was rising and they were losing money. To close their trades they needed to buyback the original number of shares they sold.
A "snowball" effect ensued with all short sellers trying to close their trades at the same time, driving the share price even higher.
The Volkswagen share price rose from €200 to over €1,000 in just over a month.

3. Limited number of approved ASX companies to sell
There is a limited number of ASX companies that are allowed to be sold short. Leveraged equities publish a list of approved companies along with the collateral requirements.
Why is Short Selling Allowed?
Short selling provides liquidity and brings price efficiency into the market.
In 2008, ASIC placed stricter controls on covered short selling and banned naked short selling outright in an attempt to bring order to the market turmoil. Although it could easily be argued that the ban reduced fear and reduced the number of people “sitting on the sidelines”, studies have found that the consequence was higher volatility and decreased liquidity.
How to "Go Short" in Australia
Short selling ASX companies should only be conducted by experienced investors. You will need to shop around for a stockbroker who is able to facilitate short trades.
Alternatively, you can profit from a falling market by purchasing an Exchange Traded Fund (ETF) that specialises in short selling.
BetaShares Australian Equities Bear Hedge Fund (BEAR) is an ETF that can be bought and sold just like ordinary shares with no extra paperwork, fees or obstacles. The fund short sells ASX SPI 200 futures contracts so that any fall in the S&P/ASX 200 index will result in an increase in the fund’s value. Therefore, the share price of BEAR ETF will rise if the stock market falls.
Using an ETF like the BEAR is a great way for the average investor to profit from, or protect against a fall in the overall Australian stock market.
Additional Links
Shortman - An excellent website that covers Australian short selling
Short Selling Regulatory Guide 196 (PDF) - ASIC’s detailed guide
Short Selling Reporting Obligations in Australia (PDF) - A law firm’s excellent summary