Dividend Yield Basics
A Beginner's Guide to Dividend Yield Investing
Last Updated: 10 August 2022
When listed companies make a profit, they must decide how much to save for future growth and how much to give back to shareholders via a dividend.
The amount a company will save (or distribute) can vary significantly and it usually depends on the type of company involved.
“Growth” companies tend to use profits to fund future growth and pay little, if any dividends.
“Yield” companies tend to be well established (e.g. Telstra and BHP) and have little room for rapid expansion. They have no need for additional funds so they pay a higher proportion of their profit to investors as a dividend.
Dividend Yield Ratio
The Dividend Yield Ratio is the most commonly quoted financial ratio and shows how much a company pays out in dividends each year. It’s expressed as a percentage and is calculated by dividing the annual dividends paid out by the current share price.
| Dividend Yield = | dividends per share |
| current share price |
| Example | |
|---|---|
| Interim dividend | $1.00 |
| Final dividend | $1.50 |
| Share price | $35.60 |
| (1.00 + 1.50) / 35.60 = 0.07 or 7.0% | |
Considering the yield offered by many large ASX listed companies is higher than the current RBA Cash Rate of 1.85%Aug 22, investing for dividends can be an attractive strategy for the conservative portion of an investor's portfolio.
How often are dividends paid?
Most ASX large-cap companies pay dividends twice a year about six months apart; an interim and a final dividend.
Listed Funds tend to pay quarterly, while small-cap companies often don’t pay a dividend and instead elect to reinvest their profits into future growth prospects.
If a special event or situation arises, a company may also elect to pay a “special” dividend at any time.
Details of all historical dividend payments must be declared to the market and can be found in a company's ASX announcements.
Taxation Benefits
Some companies pay dividends to investors AFTER they have paid 30% tax on profits (Australia’s current corporate tax rate for companies with more than $50m turnoverATO). These dividends are referred to as “Franked” and investors receive a credit for the amount of tax already paid (referred to as Franking Credits or Imputation Credits).
For example
A company pays a fully franked dividend of $70 to an investor with a $30 franking credit attached (30% of 100). This means the total dividend before tax paid was actually $100.
The investor must declare the full amount ($100) in their taxable income even though they only received a payment of $70.
At tax time, if the investor had a tax rate of 20% they would be required to pay $20 in tax (20% of $100). As $30 tax has already been paid by the company before distributing the dividend, the investor would receive a tax refund of $10 ($30 - $20).
The opposite would be true for an investor with a tax rate of 45%. As only 30% tax had been paid on the dividend, the investor would be required to pay an additional $15 ($45 - $30 already paid).
Some dividends are distributed unfranked, which means no tax has been paid by the company and tax is payable on the whole amount.
Read the Basics of Franking Credits page for more details.
Note: To receive a Franking Credits, you must hold a share for 45 days.
Important Terminology
Ex-Dividend Date
Share purchases made on or after this day are not entitled to the dividend. The company's share price will usually fall by an amount equal to the dividend.
Record Date
The day share registries determine who is entitled to the dividend. Anyone who is not a registered shareholder at 5pm (Sydney) on the Record Date will be denied the dividend. As share purchases take two business days to settle, the Record Date is set two business days after the ex-dividend date.
Payment Date
The day shareholders get paid the dividend (usually two to three weeks after the Record Date).
Dividend Reinvestment Plan (DRP)
Some companies allow shareholders to reinvest their dividends back into the company at a discount to the current share price. This is achieved via a DRP.
Market Index keeps a list of all ASX companies with an active DRP status.
Caveat emptor
Prior to purchasing any high yield share, it’s important to establish the reason why the company is paying such a high dividend. Three common reasons include:
1. A falling share price
2. Poor future prospects
3. A once-off special dividend
These pitfalls are especially apparent on the ASX. State Street Global Advisors (SSgA) conducted a study on all S&P/ASX 200 constituents from December 1999 to May 2010 found that 65% of companies with yields in excess of 10% saw an average share price performance of negative 20% in the preceding year.
So to prevent any unexpected surprises, ensure any high yield investment is not due to a large once-off dividend and that the company has the capacity to pay and maintain the dividend it is currently paying.
Dividend Yield Investing
| ADVANTAGES | DISADVANTAGES |
|---|---|
| Provides Income - Dividends can be used for reinvestment or personal use. | Less Growth - High yield companies return profits back to investors instead of reinvesting for future growth. |
| Lower Risk - High yield companies are generally well established blue chips that are less likely to experience extreme volatility. | Average Returns - Investing only in large blue chip companies makes outperforming the benchmark index more difficult. |
| Capital Protection - Dividends provide a buffer against capital loss. |
A Basic Strategy
“Dogs of the Dow” is a simple dividend yield investment strategy that rose to prominence in the 1990s due to its simplicity and strong returns.
The strategy involves purchasing the 10 highest yielding companies from the Dow Jones Index at the commencement of each calendar year and rebalancing the portfolio annually.
Proponents of the strategy argue that large blue chip companies are generally fundamentally sound and a high dividend yield only indicates a short-term negative change in market sentiment or business conditions. Therefore, high yield companies are closer to the bottom of their business cycle and are more likely to see greater capital growth than their low yield counterparts.
The underlying principle was initially proposed by Benjamin Graham more than 70 Years ago and made popular in the book Beating the Dow (1991) by Michael O’Higgins. According to the author, the strategy outperformed the Dow Jones by an average of 6.18% per annum from 1973 - 1991.
The results post release of the book have been less than stellar, but on a risk-adjusted basis the returns are superior.
| DOGS OF THE DOW | ||
|---|---|---|
| Year | Dogs Portfolio | Dow Jones |
| 1991 - 2011 | 10.8% | 10.8% |
| 2012 | 5.7% | 7.3% |
| 2013 | 30.3% | 26.5% |
| 2014 | 7.0% | 7.5% |
| 2015 | -1.2% | -2.2% |
| 2016 | 16.1% | 13.4% |
| 2017 | 19.4% | 25.1% |
| 2018 | 0.0% | -5.6% |
| 2019 | 15.5% | 22.3% |
| 2020 | -12.6% | 7.2% |
Modified for the ASX
The Dogs of the Dow strategy has been modified for use on the ASX and renamed "Dingoes of the ASX".
Advocates of the strategy purchase the 10 highest dividend yield companies in the S&P/ASX 50 on the first trading day of the year. No changes are made to the portfolio during the year and all shares are sold on the last trading day of the year. The process is then repeated each calendar year.
Studies on its effectiveness first surfaced around 2000 and while results were initially superior to the All Ordinaries they now display mixed results.
A well conducted study by Alles and Sheng was published in The Finsia Journal of Applied Finance (Issue 3, 2008) found that during the test period (2000 - 2007) the strategy "provided positive abnormal returns” when compared to the All Ordinaries.
Three separate S&P/ASX indices were tested and it was found that "the S&P/ASX 50 provided distinctly superior returns compared to those of the S&P/ASX 20 and S&P/ASX 100".
Dingoes of the ASX
| 10 YEAR PERFORMANCE | ||
|---|---|---|
| Dingoes | S&P/ASX 50 Accum. | |
| 2012 | 27.5% | 22.0% |
| 2013 | 22.6% | 22.1% |
| 2014 | 17.7% | 5.3% |
| 2015 | -5.9% | 1.0% |
| 2016 | 25.7% | 10.9% |
| 2017 | 4.9% | 9.5% |
| 2018 | -9.6% | -1.5% |
| 2019 | 9.3% | 24.4% |
| 2020 | -2.9% | -1.9% |
| 2021 | 4.5% | 17.0% |
| Average | +9.38% | +10.88% |
| All returns include dividends | ||
2 Problems for ASX Investors
Two major issues arise when a high yield strategy is applied to ASX stocks.
Sector bias against resource companies as most have low dividends (preferring to use profits for future exploration) and towards Real Estate Investment Trusts (REITs) which pay large distributions.
Inaccurate benchmark due to large-caps being over weight in the index. In August 2022, just five companies (BHP, CBA, CSL, NAB and WBC) account for ~25% of the S&P/ASX 50 market capitalisation. Three of the companies are banks and that makes the benchmark place too much emphasis on the performance of the Australian finance sector.
| 2022 DINGOES OF THE ASX | ||
|---|---|---|
| Code | Company | Yield |
| FMG | Fortescue Metals Group Ltd | 18.64% |
| BHP | BHP Group Ltd | 9.70% |
| RIO | Rio Tinto Ltd Ltd | 8.85% |
| AZJ | Aurizon Holdings Ltd | 8.25% |
| SGP | Stockland Stapled | 5.97% |
| SUN | Suncorp Group Ltd | 5.92% |
| WBC | Westpac Banking Corporation Ltd | 5.53% |
| APA | APA Group Stapled | 5.17% |
| ANZ | Australia and New Zealand Banking Group Ltd | 5.16% |
| GPT | GPT Group Stapled | 4.89% |
| 1. Companies not in the S&P/ASX 50 were excluded even if they met the top 50 market capitalisation requirement | ||
What’s the Best Yield Approach?
While following a mechanical strategy has its merits (easy to follow and low maintenance), a more holistic approach to share market investing is probably better suited for use on the ASX. Using the dividend yield ratio as a tool within a broader investment strategy allows for better management of risk and the use of common sense.
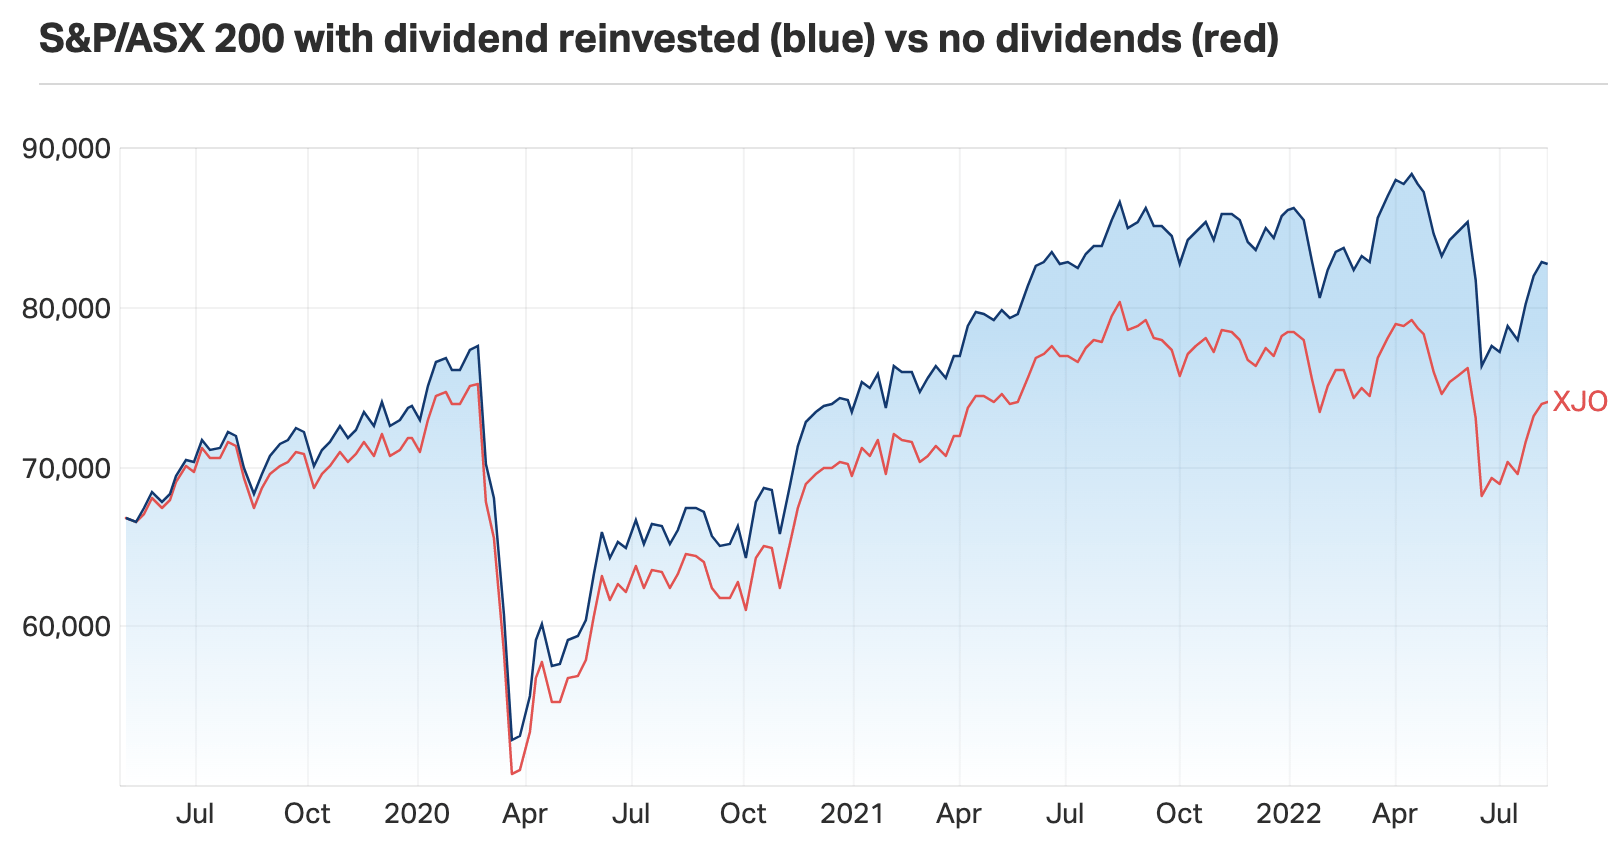
As at August 2022, there's 14 ETFs that target Australian high-yield companies. In the image below you can see that using yield as the sole basis for investment isn't always the most profitable investment strategy in Australia.
For this reason, Market Index recommends using a scan to help locate high yield companies that may warrant further investigation.
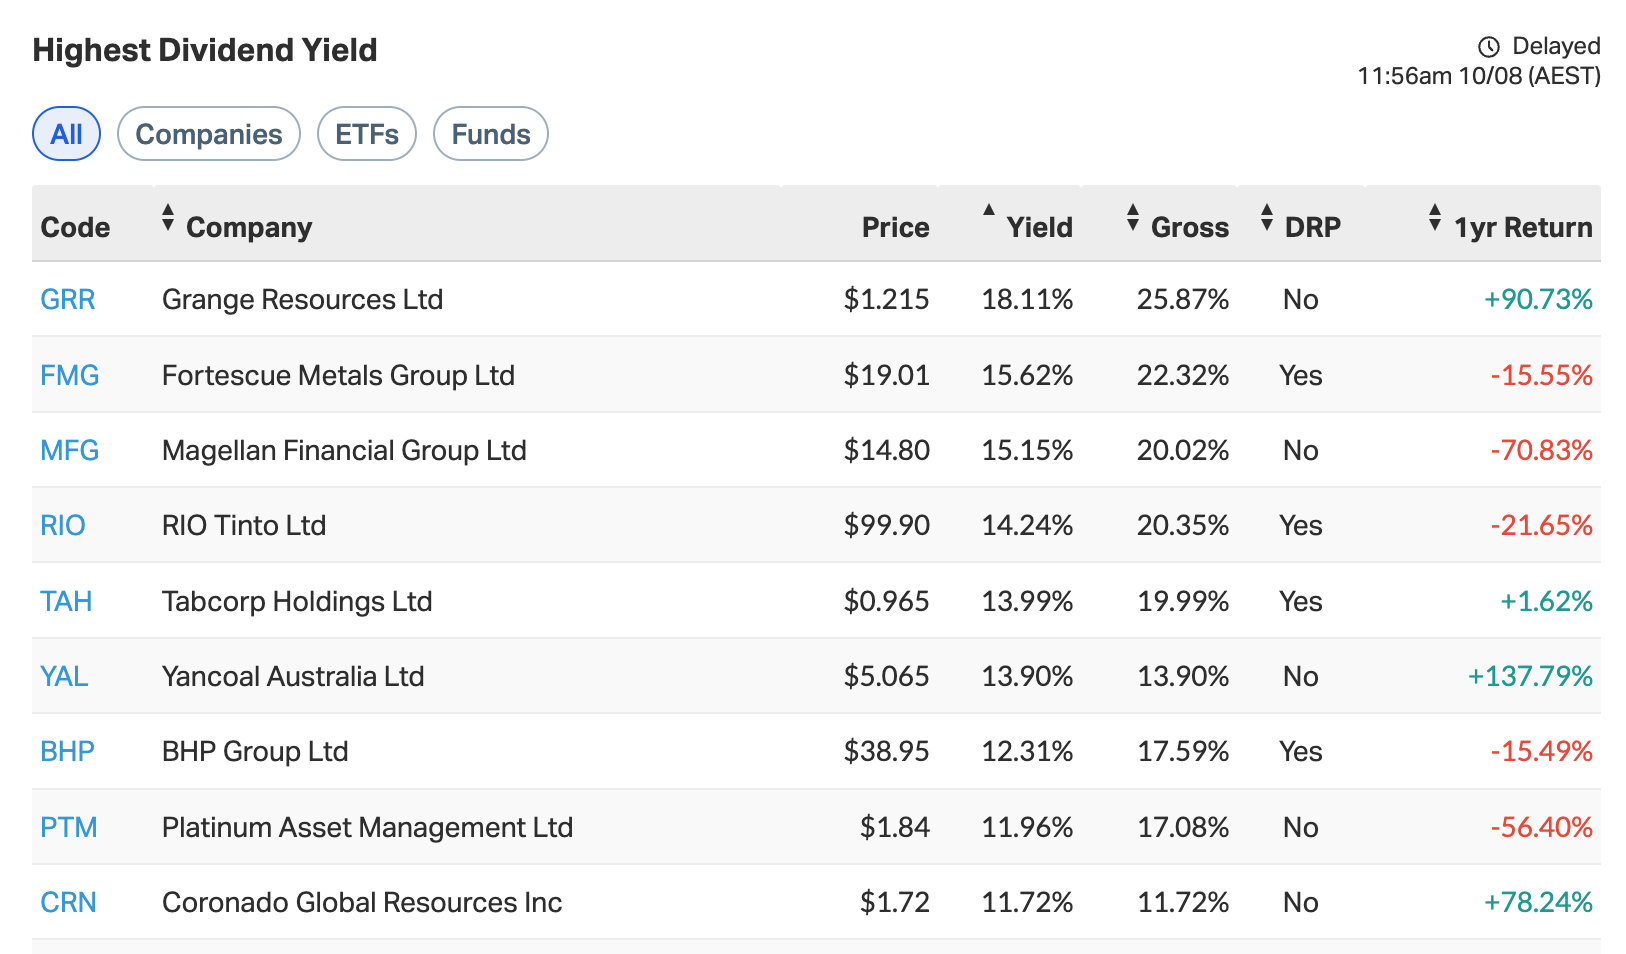
Market Index ASX Scan
Market Index maintains a list of all ASX companies with a dividend yield above 5.0%.
The results are ranked by yield along with gross yield, dividend reinvestment plan (DRP) status, and 1-year price return excluding dividends
Additional Reading
ASX Dividend Yield Scan - Updated every minute when the market is open.
"Dogs of the Dow" Study - The rise and falls of the dogs