
News | Market Wraps
Evening Wrap: ASX 200 slumps on Middle East escalation fears, PME -9% in tech tumble, PLS -7% on lithium slide
The S&P/ASX 200 closed 123.6 points lower, down 1.34%.

Mentioned
The S&P/ASX 200 closed 123.6 points lower, down 1.34%.
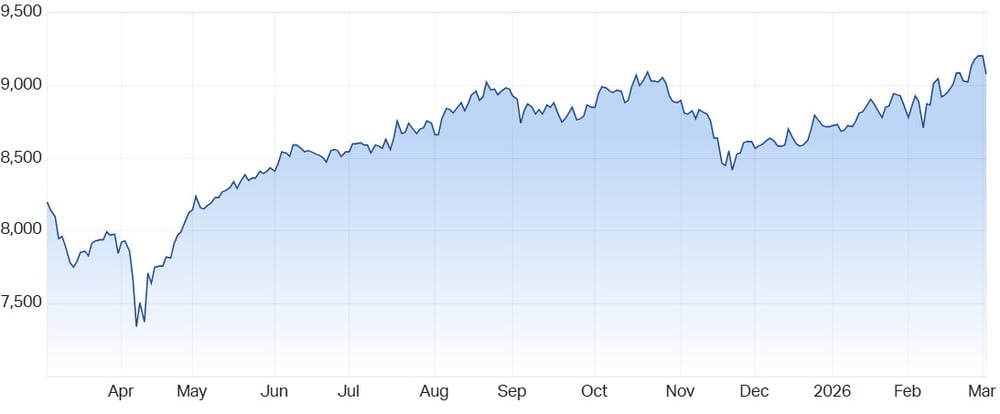
The ASX 200 fell to 9077.3 with nine out of the eleven major sectors in the red as the escalation of the war in the Middle East drove higher oil prices, reigniting inflation fears.
Energy (XEJ) (+1.4%) led as oil and gas supply risks lifted the complex, with New Hope (NHC) (+7.3%) and Yancoal Australia (YAL) (+4.8%) pacing coal driven gains.
Materials (XMJ) (-3.1%) was the biggest drag as the war drove a spike in the US dollar, with investors rotating into the traditional safe-haven currency. Most major commodities are priced in US dollars, so as it rises it reduces the buying power of importers, weighing on demand. BHP Group (BHP) (-2.6%), Rio Tinto (RIO) (-2.4%) and Fortescue (FMG) (-4.4%) all fell sharply.
In stock specific news:
Magellan Financial Group (MFG) (+21.8%) — surged after completing a $130m placement to fund the Barrenjoey merger
Life360 (360) (-17.6%) — slid after guiding first quarter margins below expectations
Neuren Pharmaceuticals (NEU) (-8.7%) — fell after partner Acadia sought a European re-examination
Capstone Copper (CSC) (-8%) — dropped as record revenue still missed analysts' forecasts
Stockland (SGP) (-2.2%) — eased after finalising its 50/50 data centre acquisition EdgeConneX
DroneShield (DRO) (-6.2%) — gave back Monday’s defence rally
In Asian trade, lithium carbonate slumped 13% to 150,860 CNY/mt, while Newcastle coal jumped nearly 8% to US$125.85/t after Qatar’s LNG disruption. PLS Group (PLS) slid 6.8% as New Hope Corporation Ltd (NHC) gained 7.4%.
Gold miners Newmont (NEM) (-2.0%) and Evolution Mining (EVN) (-4.5%) were lower despite spot gold trading largely flat.
Be sure to click/scroll through for the usual reporting of the major sector and stock-specific moves, the broker responses to them, as well as all the key economic data in tonight's Evening Wrap.
Also, I have detailed technical analysis on the Nasdaq Composite and the S&P/ASX 200 in today's ChartWatch.
Let's dive in!
Today in Review
Tue 03 Mar 26, 5:01pm (AEST)
Name | Value | % Chg |
|---|---|---|
Major Indices | ||
| ASX 200 | 9,077.3 | -1.34% |
| All Ords | 9,297.2 | -1.42% |
| Small Ords | 3,711.3 | -1.79% |
| All Tech | 2,714.5 | -2.30% |
| Emerging Companies | 3,290.9 | -1.56% |
Currency | ||
| AUD/USD | 0.7089 | -0.08% |
US Futures | ||
| S&P 500 | 6,830.25 | -0.84% |
| Dow Jones | 48,559.0 | -0.79% |
| Nasdaq | 24,771.25 | -1.01% |
Name | Value | % Chg |
|---|---|---|
Sector | ||
| Energy | 10,262.1 | +1.41% |
| Consumer Staples | 12,808.9 | +0.02% |
| Financials | 9,767.8 | -0.13% |
| Utilities | 10,065.8 | -0.16% |
| Communication Services | 1,695.6 | -0.94% |
| Industrials | 8,551.1 | -0.99% |
| Health Care | 29,257.0 | -1.41% |
| Real Estate | 3,602.1 | -2.01% |
| Information Technology | 1,689.1 | -2.17% |
| Consumer Discretionary | 3,560.7 | -2.80% |
| Materials | 25,036.7 | -3.09% |
Markets
ASX 200 Session Chart
The S&P/ASX 200 (XJO) finished 123.6 points higher at 9,077.3, 1.36% from its session high and just 0.16% from its low. In the broader-based S&P/ASX 300 (XKO) advancers lagged decliners by a decisive 65 to 223.
Fund flows: And there's your problem... 🔎
Live by the sword... you know how it goes. ⚔️
That's the problem with a benchmark index that’s making new highs — but is powered by only one or two major sectors.
When those sectors have a bad day, in this case Resources (XJR) (-2.5%), it’s very likely that the index also has a bad day.
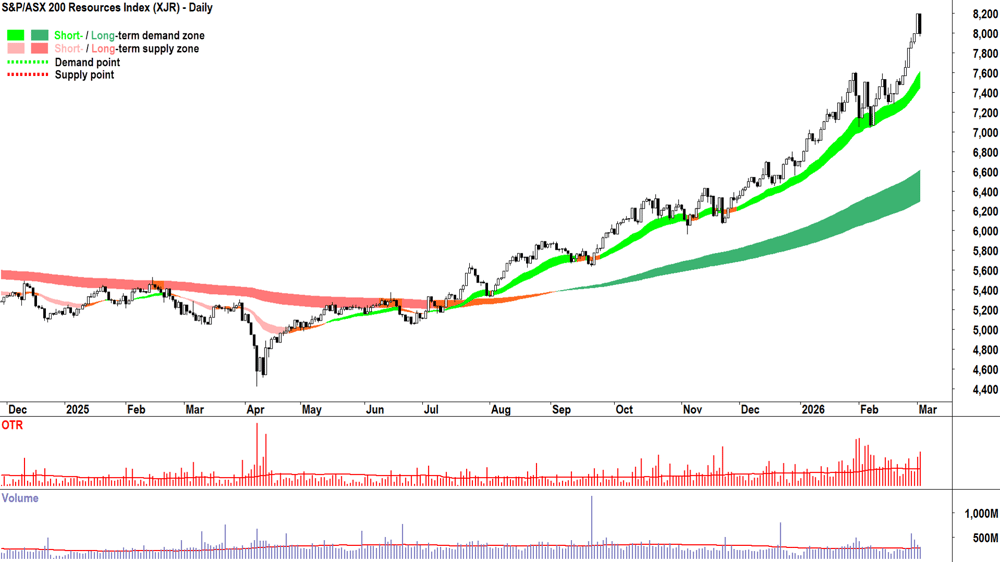
S&P-ASX 200 Resources Index chart = Equal and opposite candle today vs yesterday! ⬜⬛
But it wasn’t just the previously impervious and imperious Resources that dipped today — it was also the other stuff… the Usual Dud Suspects (UDS’s) like Consumer Discretionary (XDJ) (-2.8%), Information Technology (XIJ) (-2.2%), and Health Care (XHJ) (-1.4%).
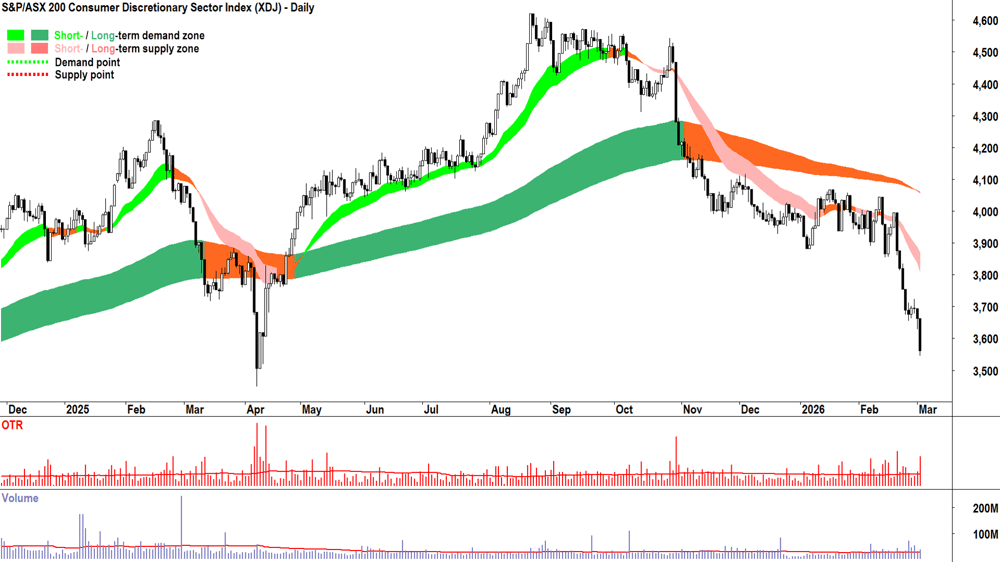
S&P-ASX 200 Consumer Discretionary Sector Index chart — shorts can smell blood in the water... 🦈
I put to you that Financials (XFJ) (-0.1%) were an important stabilising factor today — staving off a potentially slippery slide in the benchmark.
If you’re a trend follower like me, leveraged to the fantastic uptrends in Resources as much as short the hell out of the UDS’s — then hopefully today’s pullback in the former is cushioned by the ongoing demises of the latter.
Hey — It was always going to be a tough gig for the mighty Resources sector to bench press the ASX 200 through a war in the Middle East! It can only do so much!
But, as you’ll see in ChartWatch below, we must put things into perspective: it’s not all terrible.
Um… it could get that way… just… it’s not right now! 😉
Today's best blue chip gainers
Company | Last Price | Change $ | Change % | 1mo % | 1yr % |
|---|---|---|---|---|---|
Light & Wonder (LNW) | $129.30 | +$4.45 | +3.6% | -22.8% | -28.2% |
Ampol (ALD) | $29.98 | +$0.92 | +3.2% | +5.2% | +11.6% |
Whitehaven Coal (WHC) | $8.19 | +$0.25 | +3.1% | -10.2% | +41.5% |
Dyno Nobel (DNL) | $3.49 | +$0.04 | +1.2% | +0.6% | +24.6% |
Telix Pharmaceuticals (TLX) | $9.87 | +$0.11 | +1.1% | -5.8% | -65.9% |
Nextdc (NXT) | $13.50 | +$0.15 | +1.1% | +3.8% | -2.3% |
Bank of Queensland (BOQ) | $6.99 | +$0.07 | +1.0% | +2.6% | +4.0% |
Santos (STO) | $7.28 | +$0.07 | +1.0% | +7.4% | +9.3% |
Genesis Minerals (GMD) | $8.13 | +$0.07 | +0.9% | +16.6% | +154.9% |
Bendigo and Adelaide Bank (BEN) | $10.68 | +$0.09 | +0.9% | -2.9% | -0.5% |
Woodside Energy Group (WDS) | $30.48 | +$0.24 | +0.8% | +22.4% | +20.7% |
Aurizon Holdings (AZJ) | $4.12 | +$0.03 | +0.7% | +14.1% | +29.2% |
Resmed Inc (RMD) | $35.99 | +$0.25 | +0.7% | -2.9% | -3.8% |
Woolworths Group (WOW) | $36.90 | +$0.22 | +0.6% | +19.4% | +22.7% |
Block (XYZ) | $89.64 | +$0.48 | +0.5% | +5.3% | -15.5% |
Pinnacle Investment Management (PNI) | $15.35 | +$0.08 | +0.5% | -9.4% | -32.9% |
Cleanaway Waste Management (CWY) | $2.54 | +$0.01 | +0.4% | +3.3% | -1.6% |
Washington H. Soul Pattinson (SOL) | $38.07 | +$0.14 | +0.4% | +1.3% | +11.3% |
Origin Energy (ORG) | $11.99 | +$0.04 | +0.3% | +2.5% | +9.3% |
Commonwealth Bank of Australia (CBA) | $173.98 | +$0.49 | +0.3% | +14.9% | +10.7% |
Today's worst blue chip losers
Company | Last Price | Change $ | Change % | 1mo % | 1yr % |
|---|---|---|---|---|---|
Life360 (360) | $20.36 | -$4.36 | -17.6% | -26.0% | -13.3% |
Pro Medicus (PME) | $114.28 | -$11.34 | -9.0% | -35.9% | -56.3% |
PLS Group (PLS) | $4.80 | -$0.35 | -6.8% | +9.3% | +144.3% |
Mineral Resources (MIN) | $56.04 | -$3.66 | -6.1% | -0.5% | +134.2% |
IGO (IGO) | $7.80 | -$0.5 | -6.0% | -7.5% | +90.2% |
Ramelius Resources (RMS) | $4.51 | -$0.28 | -5.8% | +2.3% | +69.5% |
Eagers Automotive (APE) | $22.08 | -$1.32 | -5.6% | -15.9% | +51.2% |
Sandfire Resources (SFR) | $19.46 | -$1.07 | -5.2% | +2.0% | +81.9% |
Lynas Rare Earths (LYC) | $19.04 | -$0.96 | -4.8% | +28.9% | +180.4% |
Evolution Mining (EVN) | $16.87 | -$0.8 | -4.5% | +21.5% | +174.8% |
Fortescue (FMG) | $19.58 | -$0.92 | -4.5% | -7.6% | +17.2% |
AMP (AMP) | $1.220 | -$0.055 | -4.3% | -26.9% | -9.6% |
South32 (S32) | $4.57 | -$0.18 | -3.8% | +3.4% | +25.9% |
Orica (ORI) | $23.82 | -$0.88 | -3.6% | -7.1% | +43.1% |
Wesfarmers (WES) | $77.24 | -$2.84 | -3.5% | -7.5% | +4.8% |
Downer EDI (DOW) | $8.33 | -$0.3 | -3.5% | +4.0% | +51.5% |
Perseus Mining (PRU) | $6.07 | -$0.21 | -3.3% | +7.8% | +101.0% |
JB HI-FI (JBH) | $78.94 | -$2.64 | -3.2% | -3.7% | -15.6% |
Northern Star Resources (NST) | $30.71 | -$1.02 | -3.2% | +15.5% | +76.3% |
GPT Group (GPT) | $4.86 | -$0.16 | -3.2% | -6.9% | +4.7% |
ChartWatch
Nasdaq Composite Index
Analysis
“Support” and “resistance” are two of the most widely used terms in technical analysis — and, in my view, two of the least helpful. They sound definitive, as if price simply hits support and bounces… or hits resistance and turns lower.
But that language glosses over what’s actually happening beneath the surface — neither term pulls the analyst back to what’s happening in the demand-supply environment.
Support what exactly? Resistance against what? 🤔
More importantly — what if you’re going short? Support is now resistance and resistance is now support! 🙃
Calling a level “support” or “resistance” anchors your thinking to direction, when markets themselves are direction-agnostic.
That’s why I prefer the framing of points of excess demand (POD) and points of excess supply (POS). I generally drop the word “excess” for brevity / plus it’s implied.
I suggest that these terms describe who controlled a particular price point — the demand- or supply-side of the market:
A point of demand is where buyers have previously overwhelmed sellers, demonstrating a willingness to absorb supply and push prices higher.
A point of supply is where sellers have previously overwhelmed buyers, demonstrating a willingness to absorb cash and force prices lower.
Often, these aren’t precise points but zones — clusters of nearby prices where this imbalance has occurred. Think of them as footprints of institutional activity. The more times price reacts in a tight region, the more confidence we can have that something meaningful is occurring there.
Which brings us to the long term uptrend ribbon — a dynamic (i.e., it moves!) zone of excess demand.
To me it represents where longer term, institutional, positional buyers are absorbing supply from shorter term traders. Assuming the longer term investors have sufficient demand and the traders insufficient supply — which MOTN (More Often Than Not) is the case — when shorter term traders flip back to buying the dip, their demand aligns with long term demand and the price rallies. The long term trend perpetuates. 📈
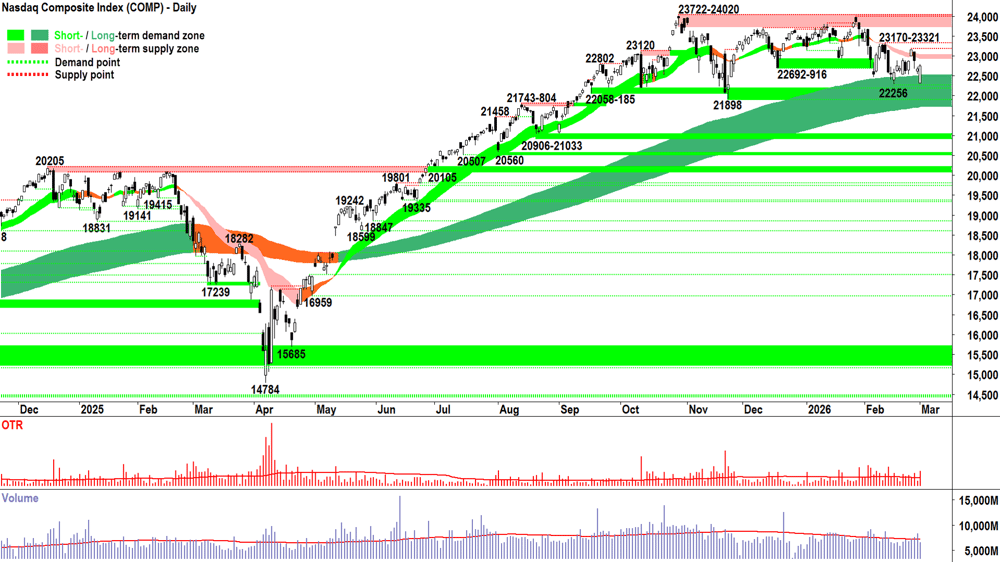
In the Comp chart above, we can see just how robust the long term uptrend ribbon is as a zone of dynamic demand. It has withstood yet another vigorous test, with a nervous open in the ribbon on Monday morning followed by a convincing demand-side push.
After the open, there was no panic, there was no wall of supply, just buying. In fact, looking at the below average volume — one could even argue that there was something of a supply-side vacuum.
Not even war in the Middle East could put a dent in the long term uptrend ribbon! 💪
Why? Why’s it so good? 🤷
Don’t know! 🤷
Don’t care! 🤷
But I sleep very well at night knowing that it is! (Hey — I can’t tell you how an automatic gearbox works — but I know how to drive my car!).
There is a bit of a fly in the ointment, though. The short term downtrend ribbon seems to be doing a pretty good job of impeding upward price action — you could even say it’s acting as a zone of dynamic resistance! 😉
We’re back in the pincer! Up or down? Your guess is as good as mine — and when I consider that my portfolio risk limit is 50% invested vs 50% cash — I don’t really care either way. ⚖️
But I'd prefer that whatever happens, happens soon, because who could be bothered waiting!
One final takeaway:
The more robust a technical zone of demand / supply is = the more significant is its break! ⚠️🚨
So, I propose, should the Comp’s price:
Close below the long term uptrend ribbon, presently 21716-22505 = MOTN 📉
Close above the short term downtrend ribbon, presently 22935-23034 = MOTN 📈
View
1/2RP still feels valid with respect to my US portfolio risk limit (RP = Risk Position — it reflects my personal allowable capital allocation limit for my investments in US stocks. So 1/2RP is 50%, 2/3RP is 67% and FRP is 100% 🪣).
Key levels
22256 is the critical point of demand — a close below it implies the supply-side is in control of the Comp's short term price, and that the long term uptrend is likely under significant pressure = ⚠️. The short term downtrend ribbon (presently 22935-23034) is the nearest critical zone of point supply, and 23170-23321 is not far beyond that.
S&P/ASX 200 (XJO)
%20chart_3%20Mar.png)
Analysis
Bullet successfully dodged yesterday… not today! Trinity HELP!
Hopefully the GLC can “move like them” and dodge any more bullets coming its way!
Yesterday was so darn strong, though, a monster display of demand-side nonchalance as much as it was a display of total supply-side sanguinity!
Today, though… There’s no other way to put it: not a great look. The supply-side found their form and the demand-side pretty much got out of their way.
But, it could have been worse… it wasn't a wholesale dissolution of demand-side control — neither in terms of price action / today’s candle nor with respect to volume. Today’s candle was modest compared to recent demand-side showings, and mild in terms of its impact on the short term uptrend — i.e., it didn’t even chip the short term uptrend ribbon.
Today’s average volume suggests that only moderate supply hit the market.
Today’s candle suggests that it was motivated, though (i.e., black candle + close very near session low).
Like Thomas Anderson, aka Neo, the ASX 200, aka the Golden Le Creuset, will live to fight another day… ironically… to battle once more against the machines! 🤖
8987 is important now, I don’t want to see a close below there. It’s roughly also the bottom of the short term trend ribbon = an important zone of dynamic excess demand. 🛡️
I won’t do the checklist, but save for one candle — today’s everything still checks out for demand-side Control (ST & LT Trends ✅✅ Price action ✅ Candles ✅)
View
I am FRP 🪣 (i.e., my personal allowable capital allocation limit for my investments in Australian stocks is 100%).
Key levels
The short term uptrend ribbon (presently 8964-9024) is the closest zone of demand, and the 8987 point of demand also sits in that zone. A close below 8964 would neutralise the present short term uptrend.
ChartWatch *LIVE* Webinar
ChartWatch *LIVE* Webinars – WEEKLY Wednesday's @ 12pm AEDT
Learn more about technical analysis and trend following through real case studies on ASX stocks. Australia's premier technical analyst, Carl Capolingua, shares his unique insights on stocks as requested by viewers. Ask about a company in your portfolio or anything related to trading and investing and get Carl's expert opinion.
Places are limited so >REGISTER NOW!<
Economy
Today
08:10 AUS RBA Gov Bullock Speaks
Prolonged war and higher oil prices will hurt economic activity
11:30 AUS Building Approvals
Result: -7.2% m/m actual vs +5.7% m/m forecast vs -14.9% m/m in February
Later this week
Tuesday
11:30 AUS Building Approvals (+5.7% m/m forecast vs -14.9% m/m previous)
Wednesday
11:30 AUS GDP q/q (+0.7% q/q forecast vs +0.4% q/q previous)
Thursday
11:30 AUS Goods Trade Balance (+3.89 billion m/m forecast vs +3.37 billion m/m previous)
11:30 AUS Household Spending (+0.4% m/m forecast vs -0.4% m/m previous)
Friday
00:30 USA Unemployment Claims (+215k w/w forecast vs +212k w/w previous)
00:30 USA Import Prices (+0.2% m/m forecast vs -0.1% m/m previous)
Saturday
00:30 USA Unemployment Rate (+4.3% m/m forecast vs +4.3% m/m previous)
Latest News
Interesting Movers
Trading higher
+22.6% Lindian Resources (LIN) – Lindian-RA Acquires Operating MREC Facility, rise is consistent with prevailing short and long term uptrends, a regular in ChartWatch ASX Scans Uptrends list 🔎📈
+21.9% Magellan Financial Group (MFG) – Investor presentation - Proposed merger with Barrenjoey.
+7.4% New Hope Corp. (NHC) – Extension of On-Market Share Buy Back, general strength across the broader Energy sector today, rise is consistent with prevailing short and long term uptrends, a regular in ChartWatch ASX Scans Uptrends list 🔎📈
+4.8% Yancoal Australia (YAL) – No news, general strength across the broader Energy sector today, rise is consistent with prevailing short and long term uptrends, a regular in ChartWatch ASX Scans Uptrends list 🔎📈
+4.7% Boss Energy (BOE) – No news, general strength across the broader Energy sector today.
+4.5% 4DMEDICAL (4DX) – No news, rise is consistent with prevailing short and long term uptrends, a recent regular in ChartWatch ASX Scans Uptrends list 🔎📈
+4.5% Brazilian Rare Earths (BRE) – No news, rise is consistent with prevailing short and long term uptrends 🔎📈
+3.6% Light & Wonder (LNW) – Form 4 (H. McLennan - Sale of CDIs (H. McLennon 6,000 shares).
+3.3% BetaShares Australian Equities Strong Bear Complex ETF (BBOZ) – No news, (Short selling ASX shares ETF).
+3.2% Ampol (ALD) – No news, general strength across the broader Energy sector today.
+3.1% Whitehaven Coal (WHC) – No news, general strength across the broader Energy sector today.
+3.0% Viva Energy Group (VEA) – No news, general strength across the broader Energy sector today.
+3.0% BetaShares Global Uranium ETF (URNM) – No news, general strength across the broader Energy sector today, (Uranium sector ETF).
+2.3% Deep Yellow (DYL) – No news, general strength across the broader Energy sector today, rise is consistent with prevailing short and long term uptrends, a regular in ChartWatch ASX Scans Uptrends list 🔎📈
+2.2% BetaShares Crude Oil Index Currncy HDG Complex ETF (OOO) – No news, general strength across the broader Energy sector today, (Crude oil ETF), rise is consistent with prevailing short and long term uptrends, a regular in ChartWatch ASX Scans Uptrends list 🔎📈
Trading lower
-17.6% (360) – Investor Presentation and Life360 Reports Record Q4 2025 Results, general weakness across the broader Information Technology sector today, fall is consistent with prevailing short and long term downtrends, a regular in ChartWatch ASX Scans Downtrends list 🔎📉
-15.6% St George Mining (SGQ) – Major Resource Upgrade for Araxa.
-11.1% Alpha HPA (A4N) – No news, fall is consistent with prevailing short and long term downtrends, a regular in ChartWatch ASX Scans Downtrends list 🔎📉
-9.9% Wildcat Resources (WC8) – No news, general weakness across the broader Lithium sector today.
-9.1% Adairs (ADH) – No news, general weakness across the broader Consumer Discretionary sector today.
-9.1% Core Lithium (CXO) – No news, general weakness across the broader Lithium sector today.
-9.0% Pro Medicus (PME) – No news, general weakness across the broader Information Technology sector today, fall is consistent with prevailing short and long term downtrends, a regular in ChartWatch ASX Scans Downtrends list 🔎📉
-9.0% Liontown (LTR) – No news, general weakness across the broader Lithium sector today.
-8.8% Neuren Pharmaceuticals (NEU) – No news, general weakness across the broader HealthCare sector today, fall is consistent with prevailing short and long term downtrends, a regular in ChartWatch ASX Scans Downtrends list 🔎📉
-8.4% Jumbo Interactive (JIN) – No news, general weakness across the broader Consumer Discretionary sector today, fall is consistent with prevailing short and long term downtrends, a regular in ChartWatch ASX Scans Downtrends list 🔎📉
-8.1% Capstone Copper Corp. (CSC) – No news, general weakness across the broader Resources sector today.
-7.9% Weebit Nano (WBT) – No news, general weakness across the broader Information Technology sector today.
-7.2% Accent Group (AX1) – No news, general weakness across the broader Consumer Discretionary sector today, fall is consistent with prevailing short and long term downtrends, one of the most Featured (highest conviction) stocks in ChartWatch ASX Scans Downtrends list 🔎📉
-7.1% Galan Lithium (GLN) – No news, general weakness across the broader Lithium sector today.
-7.0% Temple & Webster Group (TPW) – No news, general weakness across the broader Consumer Discretionary sector today, fall is consistent with prevailing short and long term downtrends, a regular in ChartWatch ASX Scans Downtrends list 🔎📉
-6.8% Catapult Sports (CAT) – No news, general weakness across the broader Information Technology sector today, fall is consistent with prevailing short and long term downtrends, a regular in ChartWatch ASX Scans Downtrends list 🔎📉
-6.8% PLS Group (PLS) – No news, general weakness across the broader Lithium sector today.
-6.5% Bapcor (BAP) – Change in substantial holding (Australian Super 9.5% from 15%), general weakness across the broader Consumer Discretionary sector today, fall is consistent with prevailing short and long term downtrends, a regular in ChartWatch ASX Scans Downtrends list 🔎📉
-6.5% Domino's Pizza Enterprises (DMP) – No news, general weakness across the broader Consumer Discretionary sector today, fall is consistent with prevailing short and long term downtrends, a recent regular in ChartWatch ASX Scans Downtrends list 🔎📉
-6.2% Droneshield (DRO) – No news, general weakness across the broader Defence sector today.
-6.2% Elevra Lithium (ELV) – No news, general weakness across the broader Lithium sector today.
-6.1% Mineral Resources (MIN) – No news, general weakness across the broader Lithium sector today.
-6.0% IGO (IGO) – No news, general weakness across the broader Lithium sector today.
Broker Moves
6K Additive, Inc (6KA)
Retained at speculative buy at Bell Potter; Price Target: $1.45
ARN Media (A1N)
Retained at accumulate at Ord Minnett; Price Target: $0.40 from $0.50
AGL Energy (AGL)
Retained at underweight at Morgan Stanley; Price Target: $11.43
Aristocrat Leisure (ALL)
Retained at overweight at Morgan Stanley; Price Target: $65.20
AMP (AMP)
Retained at overweight at Morgan Stanley; Price Target: $1.90
Austral Resources Australia (AR1)
Retained at buy at Shaw and Partners; Price Target: $0.20 from $0.50
BETR Entertainment (BBT)
Retained at buy at Morgans; Price Target: $0.41 from $0.42
Betmakers Technology Group (BET)
Upgraded to buy from speculative buy at Canaccord Genuity; Price Target: $0.24 from $0.22
BHP Group (BHP)
Retained at overweight at Morgan Stanley; Price Target: $56.00
Bannerman Energy (BMN)
Retained at speculative buy at Canaccord Genuity; Price Target: $5.80 from $5.99
Boss Energy (BOE)
Retained at overweight at Morgan Stanley; Price Target: $2.00
Beach Energy (BPT)
Upgraded to hold from trim at Morgans; Price Target: $1.25 from $1.09
Bathurst Resources (BRL)
Retained at speculative buy at Ord Minnett; Price Target: $0.92
Charter Hall Group (CHC)
Retained at overweight at Morgan Stanley; Price Target: $27.75
Camplify Holdings (CHL)
Retained at buy at Morgans; Price Target: $0.78 from $1.00
Centuria Capital Group (CNI)
Retained at overweight at Morgan Stanley; Price Target: $2.40
CSL (CSL)
Retained at overweight at Morgan Stanley; Price Target: $215.00
Dalrymple Bay Infrastructure (DBI)
Downgraded to sector perform from outperform at RBC Capital Markets; Price Target: $5.00 from $4.80
Deterra Royalties (DRR)
Retained at overweight at Morgan Stanley; Price Target: $4.75
Eureka Group Holdings (EGH)
Retained at buy at Morgans; Price Target: $0.85
Fortescue (FMG)
Retained at underweight at Morgan Stanley; Price Target: $18.35
Greatland Resources (GGP)
Downgraded to neutral from buy at Citi; Price Target: $15.30 from $16.00
HMC Capital (HMC)
Retained at equal-weight at Morgan Stanley; Price Target: $3.35
hipages Group Holdings (HPG)
Retained at equal-weight at Morgan Stanley; Price Target: $1.00 from $1.37
IGO (IGO)
Retained at underweight at Morgan Stanley; Price Target: $7.50
Iluka Resources (ILU)
Retained at overweight at Morgan Stanley; Price Target: $6.70
Ingenia Communities Group (INA)
Upgraded to buy from neutral at Bank of America; Price Target: $5.25 from $5.90
IODM (IOD)
Retained at buy at Shaw and Partners; Price Target: $0.23
Infotrust (ITS)
Retained at buy at Bell Potter; Price Target: $0.60 from $0.65
Karoon Energy (KAR)
Retained at buy at Citi; Price Target: $2.00
Retained at hold at Morgans; Price Target: $1.80 from $1.65
Lynas Rare Earths (LYC)
Retained at overweight at Morgan Stanley; Price Target: $18.50
Magellan Financial Group (MFG)
Upgraded to outperform from hold at CLSA; Price Target: $12.00 from $9.60
Upgraded to neutral from underweight at JPMorgan; Price Target: $9.00 from $8.80
Retained at underweight at Morgan Stanley; Price Target: $8.35
Retained at neutral at UBS; Price Target: $9.90
Michael Hill International (MHJ)
Retained at outperform at Macquarie; Price Target: $0.75
Megaport (MP1)
Retained at buy at Citi; Price Target: $14.65 from $15.75
Medibank Private (MPL)
Retained at neutral at Macquarie; Price Target: $4.80
NIB Holdings (NHF)
Retained at underperform at Macquarie; Price Target: $6.05
Objective Corporation (OCL)
Retained at neutral at UBS; Price Target: $14.10 from $20.50
Origin Energy (ORG)
Retained at underweight at Morgan Stanley; Price Target: $12.21
Paladin Energy (PDN)
Retained at overweight at Morgan Stanley; Price Target: $14.45
PLS Group (PLS)
Retained at overweight at Morgan Stanley; Price Target: $5.30
Pinnacle Investment Management Group (PNI)
Retained at outperform at Macquarie; Price Target: $25.25
Peoplein (PPE)
Retained at speculative buy at Morgans; Price Target: $0.95 from $1.10
PEXA Group (PXA)
Retained at overweight at Morgan Stanley; Price Target: $17.50 from $15.50
PYC Therapeutics (PYC)
Retained at speculative buy at Bell Potter; Price Target: $2.30
Ridley Corporation (RIC)
Retained at accumulate at Morgans; Price Target: $3.20 from $3.03
Rio Tinto (RIO)
Retained at equal-weight at Morgan Stanley; Price Target: $140.00
Resolute Mining (RSG)
Retained at outperform at Macquarie; Price Target: $1.85
South32 (S32)
Retained at neutral at Citi; Price Target: $5.00 from $4.80
Retained at overweight at Morgan Stanley; Price Target: $4.75
SiteMinder (SDR)
Retained at buy at Citi; Price Target: $6.60 from $6.75
Sandfire Resources (SFR)
Retained at underweight at Morgan Stanley; Price Target: $16.20
Smartgroup Corporation (SIQ)
Retained at equal-weight at Morgan Stanley; Price Target: $9.10 from $9.00
Solstice Minerals (SLS)
Retained at speculative buy at Canaccord Genuity; Price Target: $1.85
Santana Minerals (SMI)
Retained at speculative buy at Bell Potter; Price Target: $1.70 from $1.50
Santos (STO)
Retained at hold at Morgans; Price Target: $7.50 from $6.80
Southern Cross Media Group (SXL)
Upgraded to buy from accumulate at Ord Minnett; Price Target: $0.75 from $0.70
Titomic (TTT)
Retained at speculative buy at Bell Potter; Price Target: $0.50
Vista Group International (VGL)
Retained at buy at Shaw and Partners; Price Target: $3.70 from $4.10
Virgin Australia Holdings (VGN)
Retained at neutral at Citi; Price Target: $3.60 from $3.80
Westpac Banking Corporation (WBC)
Downgraded to underweight from neutral at JPMorgan; Price Target: $37.50 from $37.10
Woodside Energy Group (WDS)
Retained at neutral at Citi; Price Target: $28.00
Retained at equal-weight at Morgan Stanley; Price Target: $26.00
Downgraded to accumulate from buy at Morgans; Price Target: $33.55 from $30.50
Whitehaven Coal (WHC)
Retained at equal-weight at Morgan Stanley; Price Target: $9.80
Xero (XRO)
Retained at overweight at Morgan Stanley; Price Target: $225.00
Scans
Top Gainers
Code | Company | Last | % Chg |
|---|---|---|---|
| CMG | Critical Minerals Group Ltd | $0.15 | +42.86% |
| CMD | Cassius Mining Ltd | $0.027 | +28.57% |
| RVT | Richmond Vanadium Technology Ltd | $0.195 | +25.81% |
| LIN | Lindian Resources Ltd | $0.65 | +22.64% |
| MFG | Magellan Financial Group Ltd | $10.31 | +21.87% |
Top Fallers
Code | Company | Last | % Chg |
|---|---|---|---|
| IVR | Investigator Silver Ltd | $0.093 | -22.50% |
| CXL | CALIX Ltd | $0.82 | -21.91% |
| MGT | Magnetite Mines Ltd | $0.041 | -18.00% |
| RBR | RBR Group Ltd | $0.023 | -17.86% |
| 360 | LIFE360 Inc | $20.36 | -17.64% |
52 Week Highs
Code | Company | Last | % Chg |
|---|---|---|---|
| LIN | Lindian Resources Ltd | $0.65 | +22.64% |
| RAU | Resouro Strategic Metals Inc | $0.40 | +21.21% |
| COD | Coda Minerals Ltd | $0.205 | +13.89% |
| ATS | Australis Oil & Gas Ltd | $0.027 | +12.50% |
| EM3 | Emc Gold Corporation | $0.215 | +10.26% |
52 Week Lows
Code | Company | Last | % Chg |
|---|---|---|---|
| MGT | Magnetite Mines Ltd | $0.041 | -18.00% |
| CMA | Carma Ltd | $0.99 | -14.66% |
| GSS | Genetic Signatures Ltd | $0.097 | -11.82% |
| A4N | Alpha Hpa Ltd | $0.56 | -11.11% |
| HFR | Highfield Resources Ltd | $0.033 | -10.81% |
Near Highs
Code | Company | Last | % Chg |
|---|---|---|---|
| IHD | iShares S&P/ASX DIV Opportunities Esg Screened ETF | $17.53 | -0.79% |
| KOV | Korvest Ltd | $16.09 | +1.19% |
| BILL | iShares Core Cash ETF | $100.73 | -0.01% |
| MVB | Vaneck Australian Banks ETF | $45.18 | -0.26% |
| MI6 | Minerals 260 Ltd | $0.73 | +1.39% |
Relative Strength Index (RSI) Oversold
Code | Company | Last | % Chg |
|---|---|---|---|
| ETHI | Betashares Global Sustainability Leaders ETF | $15.00 | -0.40% |
| CGFPC | Challenger Ltd | $100.35 | 0.00% |
| WES | Wesfarmers Ltd | $77.24 | -3.55% |
| FLT | Flight Centre Travel Group Ltd | $11.95 | -1.81% |
| HVN | Harvey Norman Holdings Ltd | $5.55 | -2.29% |
