News | Market Wraps
Evening Wrap: ASX 200 firmer as WBC, MQG lead banks, PLS, MIN, IGO tumble as lithium price plunges 11%
The S&P/ASX 200 closed 42.2 points higher, up 0.48%.

Mentioned
The S&P/ASX 200 closed 42.2 points higher, up 0.48%.
Today’s rally looked a touch more balanced beneath the surface, with fund flows and sector moves vaguely pulling in the same direction and a rare tech-led rally (instead of the usual Resources charge) adding some spice.
The real swing factor, though, was the banks, with Westpac leading the way and Macquarie putting in a strong session. Meanwhile, the commodities complex kept plenty of sizzle even as gold, silver and the recently red-hot lithium theme took a breather.
Be sure to click/scroll through for the usual reporting of the major sector and stock-specific moves, the broker responses to them, as well as all the key economic data in tonight's Evening Wrap.
Also, I have detailed technical analysis on the Nasdaq Composite and the S&P/ASX 200 in today's ChartWatch.
Let's dive in!
Today in Review
Fri 16 Jan 26, 5:03pm (AEST)
Name | Value | % Chg |
|---|---|---|
Major Indices | ||
| ASX 200 | 8,903.9 | +0.48% |
| All Ords | 9,226.7 | +0.46% |
| Small Ords | 3,957.1 | +0.91% |
| All Tech | 3,369.0 | +0.78% |
| Emerging Companies | 3,354.2 | +0.53% |
Currency | ||
| AUD/USD | 0.6704 | +0.07% |
US Futures | ||
| S&P 500 | 7,001.5 | +0.28% |
| Dow Jones | 49,727.0 | +0.18% |
| Nasdaq | 25,808.25 | +0.40% |
Name | Value | % Chg |
|---|---|---|
Sector | ||
| Information Technology | 2,112.7 | +1.17% |
| Real Estate | 3,965.9 | +1.12% |
| Consumer Staples | 11,814.5 | +1.08% |
| Financials | 9,280.2 | +0.99% |
| Industrials | 8,600.2 | +0.57% |
| Communication Services | 1,734.1 | +0.35% |
| Consumer Discretionary | 4,066.9 | +0.35% |
| Health Care | 34,282.5 | +0.11% |
| Materials | 22,863.5 | -0.18% |
| Utilities | 9,221.7 | -0.26% |
| Energy | 8,636.4 | -0.65% |
Markets
%20intraday%20chart_16%20Jan.png)
ASX 200 Session Chart
The S&P/ASX 200 (XJO) finished 42.2 points higher at 8,903.9, 0.55% from its session low and just 0.13% from its high. Reflecting the strength in the benchmark, in the broader-based S&P/ASX 300 (XKO) advancers beat decliners by an impressive 187 to 83.
For the week, the XJO finished up 186.10 points or 2.1% higher, 2.1% from its intraweek low and just 0.1% from its intraweek high.
Fund flows: Vaguely aligned 🤏
That’s a healthier looking intraday chart, isn’t it!? ✅
And look at that market breadth — we’re seeing more ships lifting on the tide.
If we look at how the index found its gains today, it’s vaguely more aligned with a market consisting of sectors that are all pushing in the same direction.
Interestingly, the Tech-vs-Resources battle flipped — a rare flip — back to Tech today. Not that Resources (XJR) (-0.3%) was terrible… nor Information Technology (XIJ) (+1.2%) dazzlingly amazing, either…
The big banks were the critical swing factor, as they usually are, with Westpac Banking Corp. (WBC) (+1.8%) strongest, and with the rest of the Big 4 logging ~0.5% gains. Macquarie Group (MQG) (+2.6%) had a good day.
Energy (XEJ) (-0.6%) and Gold (XGD) +0.2%) were muted, and the rest, too, were varying degrees of ho-hum.
I note that laggard sectors Consumer Discretionary (XDJ) (+0.3%) and Healthcare (XHJ) (+0.1%) continued to lag…
As you’ll see when you read ChartWatch below, because of today’s ASX 200 price action — I’ve upgraded my portfolio risk limit to 2/3RP 🪣.
The next stop from a technical perspective is the all-time highs from October around 9110-20. We’ll need this “vague positive alignment” of sectors to continue… with preferably Resources and Banks dragging the rest along kicking and screaming!
Stock Specific: Lithium loses charge... 🪫
Nothing goes up in a straight line forever. Not gold, not silver, not copper, not tin, not coal, not uranium (I'm listing off stuff that is going up in a straight line at the moment!)... and not lithium.
The latter got a bit of a reality-check today as the blistering ~300% rally from its August lows came to an abrupt halt. Benchmark lithium carbonate futures on China’s GFEX are trading down around 9% on a settle-to-close basis, and 11% on a close-to-close basis.
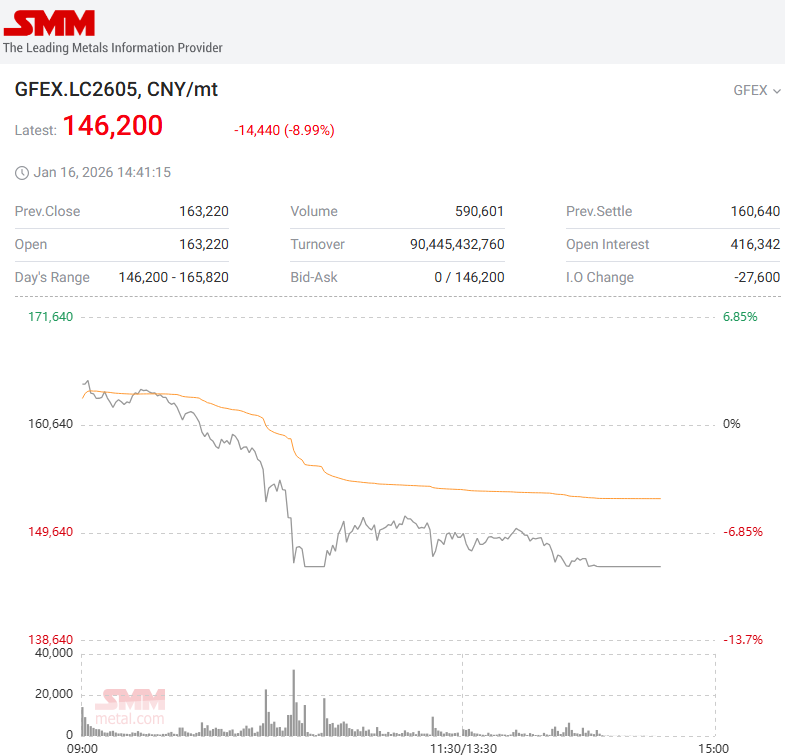
As if to demonstrate that stock investors are measured in their expectations, most major lithium stocks didn’t fall anywhere near either of those amounts. In most cases, they lagged the commodity during its last few days rally, and therefore have been more reserved during today’s pullback.
Stay or go? That’s the key question for investors in the sector. You know my opinion: what do the trends, price action, candlesticks, and volume say on a case by case basis: i.e., +R, =R, or -R? 🤔
Can I offer, based on my experience in such matters, I am reminded of the old saying: "We’ve probably seen the end of the beginning, rather than the beginning of the end."
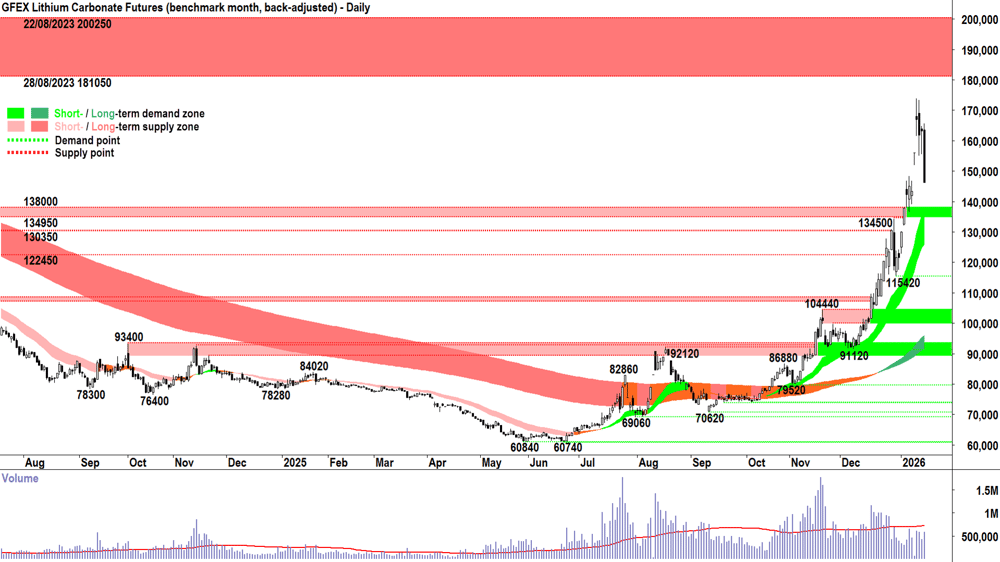
With today’s pullback, supply has been found in the market. It pegs the recent high around CNY174k as a key level which will likely define market participants' views of what’s possible in the near future. I see demand likely kicking back in around CNY138-148.5. Let’s see how the candles and volume fall there. 🧐
Today's best blue chip gainers
Company | Last Price | Change $ | Change % | 1mo % | 1yr % |
|---|---|---|---|---|---|
Treasury Wine Estates (TWE) | $5.49 | +$0.39 | +7.6% | -0.7% | -49.4% |
Hub24 (HUB) | $98.42 | +$4.98 | +5.3% | +0.4% | +47.4% |
Pinnacle Investment Management (PNI) | $18.13 | +$0.86 | +5.0% | +8.2% | -20.2% |
Netwealth Group (NWL) | $25.65 | +$1.02 | +4.1% | -4.1% | -5.6% |
Nextdc (NXT) | $13.00 | +$0.44 | +3.5% | -2.8% | -13.6% |
Endeavour Group (EDV) | $3.94 | +$0.12 | +3.1% | +5.1% | -6.0% |
Telix Pharmaceuticals (TLX) | $11.48 | +$0.33 | +3.0% | -12.8% | -54.0% |
Macquarie Group (MQG) | $211.86 | +$5.45 | +2.6% | +5.8% | -6.0% |
Eagers Automotive (APE) | $27.45 | +$0.58 | +2.2% | +10.9% | +128.3% |
James Hardie Industries (JHX) | $35.70 | +$0.71 | +2.0% | +15.8% | -30.0% |
Qantas Airways (QAN) | $10.38 | +$0.2 | +2.0% | +5.8% | +16.1% |
ALS (ALQ) | $23.86 | +$0.44 | +1.9% | +11.0% | +53.2% |
Westpac Banking Corp. (WBC) | $39.19 | +$0.7 | +1.8% | +0.8% | +23.2% |
Charter Hall Group (CHC) | $24.33 | +$0.43 | +1.8% | -2.8% | +66.3% |
AMP (AMP) | $1.820 | +$0.03 | +1.7% | +0.6% | +14.8% |
Life360 (360) | $29.23 | +$0.48 | +1.7% | -15.8% | +37.0% |
GPT Group (GPT) | $5.52 | +$0.09 | +1.7% | +1.5% | +24.3% |
Dexus (DXS) | $6.98 | +$0.11 | +1.6% | +0.1% | +5.3% |
Vicinity Centres (VCX) | $2.54 | +$0.04 | +1.6% | -0.4% | +19.2% |
Sigma Healthcare (SIG) | $2.90 | +$0.04 | +1.4% | -0.3% | -1.7% |
Today's worst blue chip losers
Company | Last Price | Change $ | Change % | 1mo % | 1yr % |
|---|---|---|---|---|---|
PLS Group (PLS) | $4.68 | -$0.15 | -3.1% | +18.8% | +112.7% |
IGO (IGO) | $8.88 | -$0.28 | -3.1% | +28.0% | +78.3% |
Mineral Resources (MIN) | $59.78 | -$1.47 | -2.4% | +15.3% | +67.1% |
Pro Medicus (PME) | $202.90 | -$3.49 | -1.7% | -13.2% | -20.1% |
Santos (STO) | $6.23 | -$0.1 | -1.6% | -0.2% | -12.7% |
Woodside Energy Group (WDS) | $23.68 | -$0.34 | -1.4% | -3.5% | -8.6% |
Perseus Mining (PRU) | $5.83 | -$0.08 | -1.4% | +8.0% | +117.5% |
SGH (SGH) | $46.87 | -$0.52 | -1.1% | +1.7% | +3.8% |
Bendigo and Adelaide Bank (BEN) | $10.83 | -$0.12 | -1.1% | +3.9% | -17.0% |
Northern Star Resources (NST) | $26.83 | -$0.28 | -1.0% | +0.2% | +56.9% |
Ampol (ALD) | $29.30 | -$0.29 | -1.0% | -10.7% | -1.0% |
The Lottery Corp. (TLC) | $5.13 | -$0.04 | -0.8% | -0.6% | +5.8% |
BHP Group (BHP) | $48.99 | -$0.38 | -0.8% | +10.7% | +22.0% |
Origin Energy (ORG) | $10.94 | -$0.08 | -0.7% | -6.0% | -2.7% |
Block (XYZ) | $97.02 | -$0.62 | -0.6% | -0.2% | -27.5% |
Ramsay Health Care (RHC) | $36.68 | -$0.16 | -0.4% | +3.8% | +6.8% |
Medibank Private (MPL) | $4.69 | -$0.02 | -0.4% | -1.7% | +23.7% |
Seek (SEK) | $22.85 | -$0.07 | -0.3% | +0.0% | +3.3% |
Genesis Minerals (GMD) | $7.30 | -$0.02 | -0.3% | +11.8% | +164.5% |
Light & Wonder (LNW) | $180.53 | -$0.48 | -0.3% | +20.9% | +30.8% |
Transurban Group (TCL) | $13.85 | -$0.03 | -0.2% | -4.0% | +1.8% |
Fisher & Paykel Healthcare Corp. (FPH) | $33.45 | -$0.07 | -0.2% | +2.0% | -3.2% |
REA Group (REA) | $188.50 | -$0.37 | -0.2% | -0.3% | -20.3% |
Worley (WOR) | $13.22 | -$0.02 | -0.2% | +6.4% | -6.6% |
Sonic Healthcare (SHL) | $23.25 | -$0.03 | -0.1% | +1.2% | -16.7% |
AGL Energy (AGL) | $8.66 | -$0.01 | -0.1% | -8.9% | -24.7% |
JB HI-FI (JBH) | $89.92 | -$0.08 | -0.1% | -4.3% | -4.5% |
Amcor PLC (AMC) | $66.23 | -$0.04 | -0.1% | +6.1% | -14.8% |
ChartWatch
Nasdaq Composite Index
Analysis
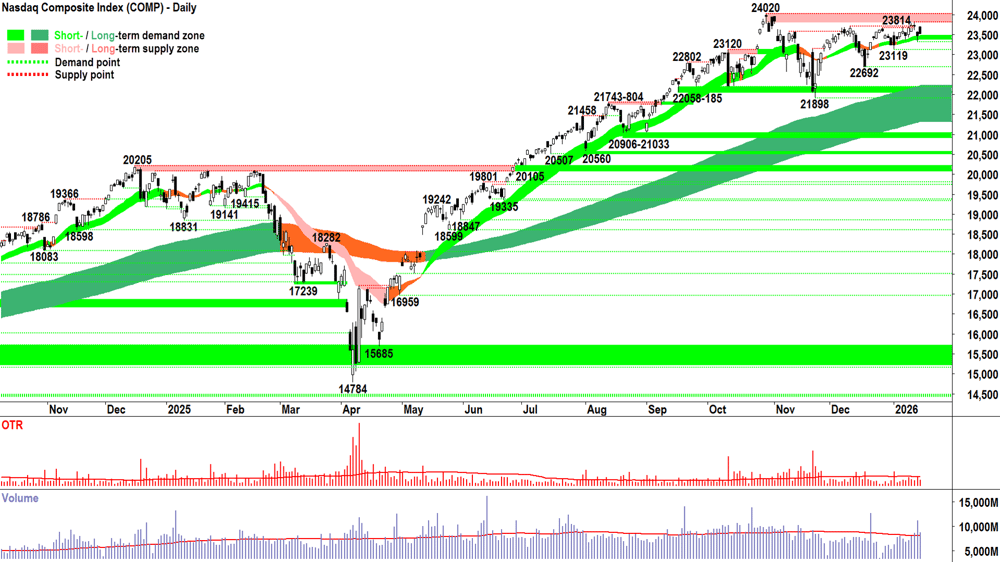
The Comp really is stuck between a rock and a hard place! 🤏
Yesterday, we noted how on Wednesday, an early drive lower into the dynamic demand zone of the short term trend ribbon was met with latent demand… Thursday’s candle was the reverse: an early drive higher was met with latent supply.
The net result was a small loss on the daily price change — but more importantly for us, we are left with a decent supply-side candle — both in terms of size and accompanying volume.
There’s demand around… we can see that; but supply consistently has its measure.
Perhaps a little disturbingly, though, Thursday’s supply kicked in well shy of the 23814-24020 supply zone. Is the supply side getting a little tetchy? 🤔
If you can make a definitive call on the health or lack thereof of the present bull market after last night’s candle, then you’re either a braver or smarter technical analyst than me!
Yep, no doubt, I’ve made a note of last night's supply-side dominated price action and elevated volume — putting it in the “must keep an eye on” column: 📝
Lots of supply hit lots of demand — but the supply-side was far more motivated.
Lots of demand are thinking: um, that’s not right… why is there all that supply around? How much more do they have…? perhaps I don’t need to demand precisely right now… perhaps I’ll get stuff cheaper…
Other latent supply are thinking: um, geez, there’s bit of supply around… and demand doesn’t look that motivated… perhaps I need to snap to it and get my supply into the market…
It’s kind of the opposite of FOMO and HOFU, right?
(Fear Of Missing Out vs Hold On For Upside)
View
No change: I remain comfortable at my 2/3RP portfolio risk limit 🪣 (RP = Risk Position — it reflects my personal allowable capital allocation limit for my investments in US stocks. So 1/2RP is 50%, 2/3RP is 67% and FRP is 100%).
Key levels
The trough at 23119 is the closest point of demand — a close below it would signal the demand-side is under pressure again — but I propose that it's not until a close below the next, lower point of demand at 22692 that we can assume they've lost control of the Comp's price. On a close below 21898 the short term trend is unequivocally down and the long term uptrend is likely under significant pressure = ⚠️. 23814-24020 is the nearest critical zone of supply — the Comp must close within this zone with a strong demand-side candle to confirm the demand-side is unequivocally back in control of the Comp's price.
S&P/ASX 200 (XJO)
%20chart_16%20Jan.png)
Analysis
It’s comical, isn’t it? 🤦
The key risk-on US stock index falters — and the Old Tin Pot punches out one of its best days in ages. A decent demand-side showing — particularly for a Friday — on roughly average volume (which again is good for a Friday!).
Add in today's close is above the 8876 point of supply, and that’s “Move from 1/2RP to 2/3RP” kind of stuff for me. ✅
What’s that, 5 white-bodied candles in a row now… and 7 of the last 8? Have I got the wrong chart!? 🤔
Nope, it’s real. It’s happening. The stars are aligning! Forget Old Tin Pot… Next week, I could be doing technical analysis on the Golden Le Creuset! 💪
Have a fantastic weekend everyone! 🏖️
View
I am increasing my portfolio risk limit from 1/2RP to 2/3RP 🪣 (i.e., my personal allowable capital allocation limit for my investments in Australian stocks is now 67%).
Key levels
The short term trend ribbon is the closest zone of (dynamic) demand (presently 8577-8730). 8675 is the closest static point of demand. A close below the short term uptrend ribbon would neutralise the present short term uptrend, while a close below 8675 almost certainly would end it. The October all-time highs around 9110-9116 is the next key zone of supply.
ChartWatch *LIVE* Webinar
ChartWatch *LIVE* Webinars – WEEKLY Wednesday's @ 12pm AEDT
Learn more about technical analysis and trend following through real case studies on ASX stocks. Australia's premier technical analyst, Carl Capolingua, shares his unique insights on stocks as requested by viewers. Ask about a company in your portfolio or anything related to trading and investing and get Carl's expert opinion.
Places are limited so >REGISTER NOW!<
Economy
Today
There weren't any major economic announcement in our time zone today.
Later this week
Saturday
01:15 USA December Industrial Production m/m (+0.2% m/m forecast vs +0.2% m/m previous)
02:00 USA NAHB Housing Market Index (40 forecast vs 39 in December)
Latest News
Interesting Movers
Trading higher
+19.0% Austral Resources Australia (AR1) – Lady Loretta Mine Acquired Increasing Copper Pipeline.
+14.7% Catalyst Metals (CYL) – Continued positive response to 15-Jan Quarterly Activities Report - December 2025, rise is consistent with prevailing short and long term uptrends, a recent regular in ChartWatch ASX Scans Uptrends list 🔎📈
+13.8% Manuka Resources (MKR) – No news, rise is consistent with prevailing short and long term uptrends, a regular in ChartWatch ASX Scans Uptrends list 🔎📈
+12.5% Amaero (3DA) – No news, rebounded after yesterday's sharp sell-off due to Updated FY26 Financial Guidance & December Quarter Activity.
+12.1% 4DMEDICAL (4DX) – Continued positive response to 15-Jan 4DMedical completes $150 million institutional placement, rise is consistent with prevailing short and long term uptrends, a regular in ChartWatch ASX Scans Uptrends list 🔎📈
+11.6% Calix (CXL) – No news, rise is consistent with prevailing short and long term uptrends, a recent regular in ChartWatch ASX Scans Uptrends list 🔎📈
+7.6% Treasury Wine Estates Ltd (TWE) – Becoming a substantial holder (Black Rock +6.7%).
Trading lower
-15.8% Novonix (NVX) – Operations Update Panasonic Energy Offtake, fall is consistent with prevailing short and long term downtrends 🔎📉
-10.9% Argosy Minerals (AGY) – No news, general weakness across the broader Lithium sector today.
-8.8% Pmet Resources (PMT) – No news, general weakness across the broader Lithium sector today.
-8.7% Lake Resources (LKE) – No news, general weakness across the broader Lithium sector today.
-8.0% WIA Gold (WIA) – No news since 15-Jan Wia appoints a Managing Director & Chief Executive Officer.
-7.4% Alcidion Group (ALC) – Continued negative response to 15-Jan Q2 FY26 Quarterly Activities Report and Appendix 4C.
-6.7% Core Lithium (CXO) – No news, general weakness across the broader Lithium sector today.
-6.4% Galan Lithium (GLN) – Secondary Trading Notice, general weakness across the broader Lithium sector today.
-5.7% Winsome Resources (WR1) – No news, general weakness across the broader Lithium sector today.
-5.3% European Lithium (EUR) – CRML Secures 100% Offtake Tanbreez Concentrate, general weakness across the broader Lithium sector today.
Broker Moves
Abacus Group (ABG)
Retained at hold at Ord Minnett; Price Target: $1.05 from $1.10
Alcidion Group (ALC)
Retained at buy at Bell Potter; Price Target: $0.17 from $0.15
Arena REIT (ARF)
Retained at buy at Ord Minnett; Price Target: $3.90 from $4.20
Abacus Storage King (ASK)
Retained at hold at Ord Minnett; Price Target: $1.45 from $1.40
ASX (ASX)
Retained at underweight at Morgan Stanley; Price Target: $45.15 from $54.05
BHP Group (BHP)
Retained at neutral at UBS; Price Target: $45.00
Beacon Lighting Group (BLX)
Retained at buy at Citi; Price Target: $3.95
Bannerman Energy (BMN)
Retained at outperform at Macquarie; Price Target: $5.85
Boss Energy (BOE)
Retained at speculative buy at Canaccord Genuity; Price Target: $2.20 from $2.25
Downgraded to underperform from neutral at Macquarie; Price Target: $1.25
Retained at sector perform at RBC Capital Markets; Price Target: $1.15
Beach Energy (BPT)
Retained at sell at Citi; Price Target: $0.95 from $1.00
Retained at underweight at Morgan Stanley; Price Target: $1.12 from $1.11
Retained at neutral at UBS; Price Target: $1.15 from $1.20
Bhagwan Marine (BWN)
Initiated at buy at Argonaut Securities; Price Target: $0.65
Charter Hall Group (CHC)
Retained at hold at Ord Minnett; Price Target: $23.40
Centuria Industrial REIT (CIP)
Retained at hold at Ord Minnett; Price Target: $3.25 from $3.45
Charter Hall Long Wale REIT (CLW)
Upgraded to accumulate from hold at Ord Minnett; Price Target: $4.05 from $4.25
Centuria Capital Group (CNI)
Retained at hold at Ord Minnett; Price Target: $2.00 from $2.10
Charter Hall Social Infrastructure REIT (CQE)
Retained at buy at Ord Minnett; Price Target: $3.30 from $3.55
Charter Hall Retail REIT (CQR)
Retained at buy at Citi; Price Target: $4.50
Retained at hold at Ord Minnett; Price Target: $4.00 from $4.20
Capstone Copper Corp. (CSC)
Retained at buy at UBS; Price Target: $16.00
Catalyst Metals (CYL)
Retained at buy at Bell Potter; Price Target: $13.50 from $9.30
Digico Infrastructure REIT (DGT)
Retained at buy at Ord Minnett; Price Target: $3.85 from $3.95
Domino's Pizza Enterprises (DMP)
Retained at buy at UBS; Price Target: $24.00
Dexus (DXS)
Retained at accumulate at Ord Minnett; Price Target: $7.15 from $7.55
Deep Yellow (DYL)
Retained at outperform at Macquarie; Price Target: $2.25
Goodman Group (GMG)
Retained at hold at Ord Minnett; Price Target: $31.25 from $31.75
Growthpoint Properties Australia (GOZ)
Retained at accumulate at Ord Minnett; Price Target: $2.50 from $2.55
GPT Group (GPT)
Retained at hold at Ord Minnett; Price Target: $5.35 from $5.50
Guzman Y Gomez (GYG)
Retained at neutral at UBS; Price Target: $24.00 from $27.00
HomeCo Daily Needs REIT (HDN)
Retained at accumulate at Ord Minnett; Price Target: $1.35 from $1.45
HMC Capital (HMC)
Downgraded to hold from buy at Ord Minnett; Price Target: $4.00
Insurance Australia Group (IAG)
Retained at buy at Citi; Price Target: $9.00
IGO (IGO)
Upgraded to buy from hold at Canaccord Genuity; Price Target: $10.10 from $7.30
Intelligent Monitoring Group (IMB)
Retained at speculative buy at Morgans; Price Target: $1.00
Ingenia Communities Group (INA)
Upgraded to accumulate from hold at Ord Minnett; Price Target: $5.30
James Hardie Industries Plc (JHX)
Retained at buy at Citi; Price Target: $37.20
Retained at outperform at Macquarie; Price Target: $41.70
Retained at sector perform at RBC Capital Markets; Price Target: $33.00
Karoon Energy (KAR)
Retained at buy at Citi; Price Target: $1.90 from $2.10
Retained at equal-weight at Morgan Stanley; Price Target: $1.81 from $1.86
L1 Group (L1G)
Retained at hold at Bell Potter; Price Target: $1.00 from $0.90
Lifestyle Communities (LIC)
Retained at hold at Ord Minnett; Price Target: $5.60
LendLease Group (LLC)
Retained at hold at Ord Minnett; Price Target: $5.25 from $5.85
Lotus Resources (LOT)
Retained at speculative buy at Canaccord Genuity; Price Target: $0.31
Retained at outperform at Macquarie; Price Target: $0.28
Lovisa Holdings (LOV)
Retained at neutral at UBS; Price Target: $33.00
Liontown (LTR)
Upgraded to buy from hold at Canaccord Genuity; Price Target: $2.40 from $1.55
Mirvac Group (MGR)
Upgraded to buy from hold at Ord Minnett; Price Target: $2.25 from $2.35
Medibank Private (MPL)
Retained at neutral at Citi; Price Target: $5.10
Nick Scali (NCK)
Retained at buy at Citi; Price Target: $27.95
Nine Entertainment Co. Holdings (NEC)
Retained at neutral at Macquarie; Price Target: $1.20 from $1.25
Newmont Corporation (NEM)
Retained at buy at UBS; Price Target: $190.00
NIB Holdings (NHF)
Retained at buy at Citi; Price Target: $8.15
National Storage REIT (NSR)
Downgraded to hold from accumulate at Ord Minnett; Price Target: $2.75
NRW Holdings (NWH)
Retained at buy at Citi; Price Target: $6.20 from $5.95
Retained at accumulate at Morgans; Price Target: $6.00 from $4.50
Origin Energy (ORG)
Retained at underweight at Morgan Stanley; Price Target: $11.11
Retained at buy at UBS; Price Target: $14.00 from $14.10
Paladin Energy (PDN)
Retained at buy at Canaccord Genuity; Price Target: $12.70 from $12.50
Downgraded to neutral from outperform at Macquarie; Price Target: $11.10
Retained at sector perform at RBC Capital Markets; Price Target: $9.50 from $8.50
Peninsula Energy (PEN)
Retained at speculative buy at Canaccord Genuity; Price Target: $1.03
QBE Insurance Group (QBE)
Retained at buy at Citi; Price Target: $23.70
Region Group (RGN)
Retained at hold at Ord Minnett; Price Target: $2.35
Reliance Worldwide Corporation (RWC)
Retained at outperform at Macquarie; Price Target: $5.30
Scentre Group (SCG)
Retained at hold at Ord Minnett; Price Target: $4.10 from $3.80
Steadfast Group (SDF)
Retained at buy at Citi; Price Target: $6.50
Sea Forest (SEA)
Retained at buy at Ord Minnett; Price Target: $3.05
Stockland (SGP)
Retained at accumulate at Ord Minnett; Price Target: $5.90 from $6.50
Santos (STO)
Retained at buy at Citi; Price Target: $7.25
Retained at equal-weight at Morgan Stanley; Price Target: $6.55 from $6.76
Retained at buy at UBS; Price Target: $7.80
Suncorp Group (SUN)
Retained at neutral at Citi; Price Target: $18.50
The Lottery Corporation (TLC)
Retained at buy at UBS; Price Target: $6.30 from $6.35
Telstra Group (TLS)
Retained at outperform at Macquarie; Price Target: $5.04
TPG Telecom (TPG)
Retained at outperform at Macquarie; Price Target: $5.60
Temple & Webster Group (TPW)
Retained at neutral at Citi; Price Target: $15.38
Universal Store Holdings (UNI)
Retained at buy at UBS; Price Target: $10.25
Vicinity Centres (VCX)
Downgraded to hold from accumulate at Ord Minnett; Price Target: $2.40 from $2.55
Woodside Energy Group (WDS)
Retained at neutral at Citi; Price Target: $25.50
Retained at equal-weight at Morgan Stanley; Price Target: $26.00 from $27.00
Retained at neutral at UBS; Price Target: $23.50 from $23.60
Waypoint REIT (WPR)
Retained at accumulate at Ord Minnett; Price Target: $2.50 from $2.70
Zip Co (ZIP)
Retained at buy at Citi; Price Target: $4.30 from $4.50
Scans
Top Gainers
Code | Company | Last | % Chg |
|---|---|---|---|
| ZLD | Zelira Therapeutics Ltd | $0.85 | +136.11% |
| OSX | Osteopore Ltd | $0.012 | +71.43% |
| DAL | Dalaroo Metals Ltd | $0.074 | +37.04% |
| AXP | AXP Energy Ltd | $0.019 | +35.71% |
| MEL | Metgasco Ltd | $0.028 | +21.74% |
Top Fallers
Code | Company | Last | % Chg |
|---|---|---|---|
| NVX | Novonix Ltd | $0.425 | -15.84% |
| RBX | Resource Base Ltd | $0.042 | -14.29% |
| ARC | ARC Funds Ltd | $0.10 | -13.04% |
| SHP | South HARZ Potash Ltd | $0.029 | -12.12% |
| PGC | Paragon Care Ltd | $0.22 | -12.00% |
52 Week Highs
Code | Company | Last | % Chg |
|---|---|---|---|
| ZLD | Zelira Therapeutics Ltd | $0.85 | +136.11% |
| DAL | Dalaroo Metals Ltd | $0.074 | +37.04% |
| WWG | Wiseway Group Ltd | $0.285 | +21.28% |
| AR1 | Austral Resources Australia Ltd | $0.125 | +19.05% |
| ABV | Advanced Braking Technology Ltd | $0.14 | +16.67% |
52 Week Lows
Code | Company | Last | % Chg |
|---|---|---|---|
| AHF | Australian Dairy Nutritionals Ltd | $0.025 | -10.71% |
| PRO | Prophecy International Holdings Ltd | $0.13 | -7.14% |
| ENL | Enlitic Inc | $0.016 | -5.88% |
| MYX | Mayne Pharma Group Ltd | $2.84 | -2.07% |
| AEF | Australian Ethical Investment Ltd | $4.90 | -1.80% |
Near Highs
Code | Company | Last | % Chg |
|---|---|---|---|
| SMLL | Betashares Australian Small Companies Select ETF | $4.88 | +0.83% |
| GLPR | iShares Ftse GBL Property Ex Aus (Aud Hedged) ETF | $27.29 | +0.59% |
| DFND | Vaneck Global Defence ETF | $44.25 | -1.14% |
| WVOL | iShares MSCI World Ex Aust Minimum Volatility ETF | $45.64 | -0.09% |
| PYC | PYC Therapeutics Ltd | $1.74 | +2.05% |
Relative Strength Index (RSI) Oversold
Code | Company | Last | % Chg |
|---|---|---|---|
| PME | Pro Medicus Ltd | $202.90 | -1.69% |
| XRO | Xero Ltd | $103.63 | +0.46% |
| EPY | Earlypay Ltd | $0.18 | 0.00% |
| AGL | AGL Energy Ltd | $8.66 | -0.12% |
| MKAX | Montaka Global Extension Fund - Complex ETF | $3.75 | -0.27% |
