News | Market Wraps
Evening Wrap: ASX 200 firms as base metals melt-up continues, South32 +4.5%, ANZ gains on Citi upgrade
The S&P/ASX 200 closed 41.1 points higher, up 0.47%.

Mentioned
The S&P/ASX 200 closed 41.1 points higher, up 0.47%.
Gold and silver stocks took a breather today as their respective commodity prices pulled back overnight, as too did the other recently "hot" thematic of lithium.
But, that doesn't mean there wasn't still plenty of sizzle in the commodities sectors of Resources and Energy, with base metals and coal stocks logging some very strong gains.
You guessed it: base metals like aluminium, copper, nickel, and particularly tin were very strong overnight on the London Metals Exchange, while coking coal prices jumped over 5% to their highest level in 15-months.
Be sure to click/scroll through for the usual reporting of the major sector and stock-specific moves, the broker responses to them, as well as all the key economic data in tonight's Evening Wrap.
Also, I have detailed technical analysis on the Nasdaq Composite and the S&P/ASX 200 in today's ChartWatch.
Let's dive in!
Today in Review
Thu 15 Jan 26, 5:11pm (AEST)
Name | Value | % Chg |
|---|---|---|
Major Indices | ||
| ASX 200 | 8,861.7 | +0.47% |
| All Ords | 9,184.2 | +0.35% |
| Small Ords | 3,921.4 | -0.44% |
| All Tech | 3,343.1 | -1.27% |
| Emerging Companies | 3,336.4 | -0.52% |
Currency | ||
| AUD/USD | 0.6679 | -0.06% |
US Futures | ||
| S&P 500 | 6,967.25 | +0.01% |
| Dow Jones | 49,360.0 | +0.01% |
| Nasdaq | 25,643.5 | +0.05% |
Name | Value | % Chg |
|---|---|---|
Sector | ||
| Materials | 22,904.1 | +1.09% |
| Health Care | 34,246.7 | +0.62% |
| Financials | 9,189.5 | +0.53% |
| Energy | 8,692.9 | +0.52% |
| Consumer Discretionary | 4,052.7 | +0.41% |
| Industrials | 8,551.3 | +0.20% |
| Real Estate | 3,922.1 | -0.09% |
| Communication Services | 1,728.0 | -0.19% |
| Consumer Staples | 11,687.9 | -0.23% |
| Utilities | 9,245.4 | -0.41% |
| Information Technology | 2,088.2 | -2.23% |
Markets
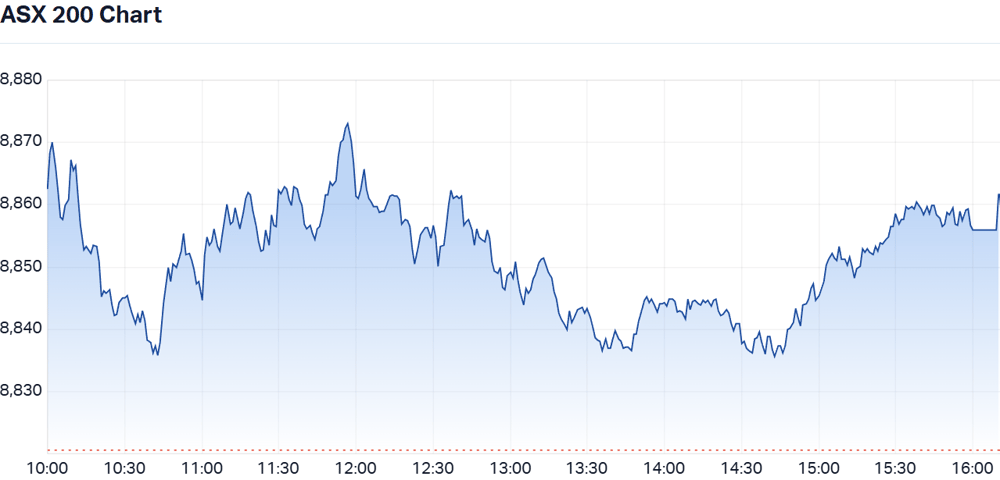
ASX 200 Session Chart
The S&P/ASX 200 (XJO) finished 41.1 points higher at 8,860, 0.46% from its session low and just 0.20% from its high. Despite the headline gain, in the broader based S&P/ASX 300 (XKO), decliners outnumbered advancers by 155 to 122.
Fund flows: Are we there yet? 🤔
Some encouraging signs today that the clear choice fund managers have been making between what we’ve called the “Winner” sector (short duration, global cyclical) of Resources (XJR) versus the “Loser” sectors (high P/E, long duration) of Health Care (XHJ), Consumer Discretionary (XDJ), Communication Services (XTJ), and Information Technology (XIJ) might be beginning to shift for the better.
Resources (XJR) (+1.1%) |
|---|
Health Care (XHJ) (+0.6%) |
Financials (XFJ) (+0.5%) |
Consumer Discretionary (XDJ) (+0.4%) |
Communication Services (XTJ) (-0.2%) |
Information Technology (XIJ) (-2.2%) |
Winner vs Losers vs Swing sector performances
Well, at least Health Care and Consumer Discretionary weren’t down today! To be fair, the latter is actually showing a decent little push off its recent swing low to now trade above its short term downtrend ribbon.
%20sector%20%20chart_15%20Sep.png)
Consumer Discretionary sector chart
As for our “Swinger”, the Financials sector, it was another choppy session where early losses were bought into — today resulting in a net gain, versus yesterday’s fall. Citi's sector report, in which it upgraded its ratings on ANZ Group (ANZ) (+2.6%) and Bank of Queensland (BOQ) (+1.4%) certainly helped.
But Commonwealth Bank of Australia (CBA) (+0.4%) was again the key swinger of swingers as it closed off its intraday lows. Checking its intraday chart, though, and we can see that there remains plenty of supply around for the biggest stock on the ASX.
%20intraday%20chart_15%20Sep.png)
Commonwealth Bank of Australia (CBA) intraday chart
The other “doin’ their own thing based on stuff going on overseas” sectors, Energy (XEJ) (+0.5%) and Gold Sub-Index (XGD) (-0.5%) showed mixed results as the former’s main commodities rose overnight and the latter’s fell.
As noted several times here: If we want to see the ASX 200, a.k.a. The Old Tin Pot finally push through the present malaise (think I’m too harsh on the OTP — read this!) we must see the bulk of the sectors growing in value — with compulsory participation by the big banks.
Are we there yet? You tell me! 🤷
Stock Specific: The trend is your friend... 📈 vs 📉
As you know, I prefer to know as little as possible about the stocks I invest in. This is because there was a time in my investing career where I was obsessed with knowing absolutely EVERYTHING about the stocks I was investing in.
Slowly, little by little, the technicals began to become the central thesis of my method. This is because I found that the more I knew about a stock, the worse I tended to trade it. This was usually for two main reasons:
I believed it was good... that's why I convinced myself to buy it in the first place
I put in a great deal of work to come to my original conclusion, it was too painful to "waste" all that time and energy by cutting and running
Similarly, I found that if I just stuck to my technical analysis-based rules, there was very little friction when I had no idea what or why the stock in question moved against me. As in literally:
I have no idea why that happened, geez... I better get the hell out!
I'm losing as much as I've allocated on that position, oh well... off I go to the next opportunity!
Importantly, I accepted that nothing I think about what a stock's worth matters one iota to the market. Best then, I just follow the market's opinion = the trend. If a picture tells a thousand words, I'll leave you today with three of the most beautiful pictures in charts you'll ever see:
South32 (S32) (obviously and uptrend: ChartWatch ASX Scans Uptrends 7 times from $3.22 since the trend turned in October)
Life360 (360) (remember when this was the hottest stock in the ASX 200!? ChartWatch ASX Scans Downtrends 7 times from $35.72 since the trend turned in December)
Xero (XRO) (another fallen Tech angel! ChartWatch ASX Scans Downtrends a whopping 44 times from $169 since the trend turned in August)
%20chart_15%20Sep.png)
%20chart_15%20Sep.png)
%20chart_15%20Sep.png)
Great charts, great trends! 😍
Today's best blue chip gainers
Company | Last Price | Change $ | Change % | 1mo % | 1yr % |
|---|---|---|---|---|---|
South32 (S32) | $4.14 | +$0.18 | +4.5% | +16.3% | +22.8% |
Bluescope Steel (BSL) | $31.00 | +$1.24 | +4.2% | +29.3% | +62.5% |
BHP Group (BHP) | $49.37 | +$1.25 | +2.6% | +8.3% | +24.7% |
ANZ Group Holdings (ANZ) | $37.32 | +$0.94 | +2.6% | +4.2% | +29.1% |
Resmed Inc (RMD) | $38.95 | +$0.92 | +2.4% | +2.7% | +3.2% |
Amcor PLC (AMC) | $66.27 | +$1.41 | +2.2% | +6.0% | -13.5% |
Whitehaven Coal (WHC) | $8.77 | +$0.18 | +2.1% | +13.5% | +45.0% |
ALS (ALQ) | $23.42 | +$0.45 | +2.0% | +7.5% | +49.6% |
Ampol (ALD) | $29.59 | +$0.55 | +1.9% | -9.4% | +2.1% |
Computershare (CPU) | $35.25 | +$0.63 | +1.8% | +4.2% | +3.4% |
Worley (WOR) | $13.24 | +$0.2 | +1.5% | +5.5% | -3.8% |
Goodman Group (GMG) | $31.23 | +$0.45 | +1.5% | +6.1% | -16.5% |
Northern Star Resources (NST) | $27.11 | +$0.38 | +1.4% | -0.8% | +61.6% |
James Hardie Industries (JHX) | $34.99 | +$0.49 | +1.4% | +15.0% | -29.2% |
Bank of Queensland (BOQ) | $6.55 | +$0.09 | +1.4% | +0.5% | -0.3% |
The Lottery Corp. (TLC) | $5.17 | +$0.06 | +1.2% | -1.7% | +6.4% |
National Australia Bank (NAB) | $42.36 | +$0.45 | +1.1% | +0.5% | +13.8% |
Endeavour Group (EDV) | $3.82 | +$0.04 | +1.1% | +2.1% | -7.3% |
CSL (CSL) | $175.28 | +$1.79 | +1.0% | -4.7% | -37.4% |
The A2 Milk Company (A2M) | $9.40 | +$0.09 | +1.0% | +6.7% | +70.0% |
Today's worst blue chip losers
Company | Last Price | Change $ | Change % | 1mo % | 1yr % |
|---|---|---|---|---|---|
Life360 (360) | $28.75 | -$1.55 | -5.1% | -17.5% | +29.4% |
Treasury Wine Estates (TWE) | $5.10 | -$0.26 | -4.9% | -8.1% | -53.4% |
Xero (XRO) | $103.16 | -$4.43 | -4.1% | -8.6% | -39.4% |
Vicinity Centres (VCX) | $2.50 | -$0.1 | -3.8% | -3.1% | +19.0% |
Pinnacle Investment Management (PNI) | $17.27 | -$0.55 | -3.1% | +2.3% | -25.4% |
Block (XYZ) | $97.64 | -$3.06 | -3.0% | +2.6% | -27.3% |
Genesis Minerals (GMD) | $7.32 | -$0.22 | -2.9% | +6.1% | +166.2% |
Pro Medicus (PME) | $206.39 | -$6.02 | -2.8% | -12.0% | -18.7% |
Netwealth Group (NWL) | $24.63 | -$0.56 | -2.2% | -8.3% | -10.0% |
Stockland (SGP) | $5.44 | -$0.12 | -2.2% | -6.8% | +14.8% |
Qube Holdings (QUB) | $4.75 | -$0.09 | -1.9% | +0.8% | +19.6% |
Orica (ORI) | $25.95 | -$0.45 | -1.7% | +9.7% | +53.5% |
Newmont Corp. (NEM) | $168.11 | -$2.82 | -1.7% | +12.0% | +163.6% |
Challenger (CGF) | $9.08 | -$0.15 | -1.6% | -0.4% | +51.3% |
Mirvac Group (MGR) | $2.02 | -$0.03 | -1.5% | -1.5% | +10.4% |
Evolution Mining (EVN) | $13.07 | -$0.19 | -1.4% | +2.4% | +149.4% |
AMP (AMP) | $1.790 | -$0.025 | -1.4% | -3.0% | +13.7% |
Car Group (CAR) | $30.04 | -$0.41 | -1.3% | -2.8% | -19.9% |
Capricorn Metals (CMM) | $14.62 | -$0.19 | -1.3% | +3.3% | +116.6% |
Technology One (TNE) | $27.20 | -$0.29 | -1.1% | 0% | -7.0% |
ChartWatch
Nasdaq Composite Index
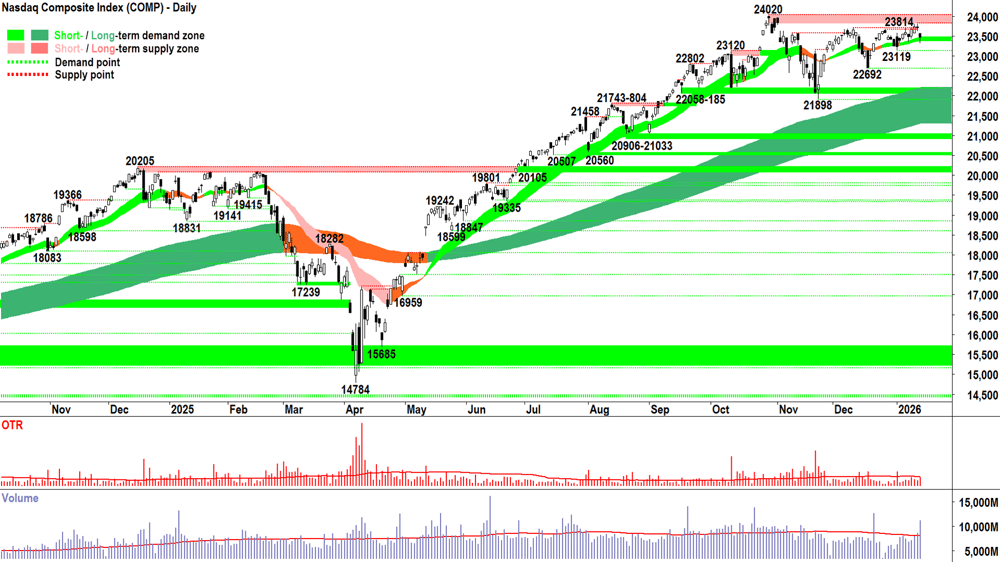
Analysis
Far from an ideal candle on Wednesday, but not inconsistent with our rolling analysis of this index: we have noted from the evidence that there remains credible supply in the 23666-24020 zone.
You should be reading candles and volume like a book now: 🧐
Gap down and run on the open = S > D, credible supply, sufficient news drivers in the system to warrant a sudden shift in valuation expectations.
Downward pointing shadow = Latent demand in the system kicked in — as we’re accustomed to — because duh… it’s a bull market!
Short term uptrend ribbon continues to act as a zone of dynamic demand — as we’d expect it to — even if we have no idea why it does what it does!!! 🤷*
Compare downward pointing shadow (i.e., the “demand component”) to gap + black body (i.e., the “supply component”) and we can see who had control of price on the day = demand > supply by a whisker (14 points)
Volume = massive compared to last 4-weeks = funds are back… plenty of supply hit plenty of demand, then plenty of demand hit plenty of supply (to create the downward pointing shadow!).
Net-net: Demand-side control by a whisker… but clearly… again… the supply-side remains very stubborn indeed anywhere around +23666! The new point of supply is 23814 (Wed’s lower high and lower low pegs Tue’s high as the new POS).
As Austin Powers once very wisely observed: "Woopty-do, what does it all mean Basil?"
"Woopty-do, what does it all mean Basil?"
Well Austin, it means that very little has changed as a result of Wednesday's candle! The broader short and long term trends remain up, we continue to see evidence that the demand-side stands ready to buy the dip — just as much as we can see that the supply-side remains far from completely on board with the concept of HOFU (Hold On For Upside).
Until we get that HOFU element, we're going to grind below 24020... probably with a gentle upwards bias. Demand seems willing, but what will finally convince the supply-side to HOFU? Beats me! 🤷
(*As you know, I have no idea how a clutch works on a car… 🤷 but I can still pick up the kids from school in my SUV!).
View
No change: I remain comfortable at my 2/3RP portfolio risk limit 🪣 (RP = Risk Position — it reflects my personal allowable capital allocation limit for my investments in US stocks. So 1/2RP is 50%, 2/3RP is 67% and FRP is 100%).
Key levels
The trough at 23119 is the closest point of demand — a close below it would signal the demand-side is under pressure again — but I propose that it's not until a close below the next, lower point of demand at 22692 that we can assume they've lost control of the Comp's price. On a close below 21898 the short term trend is unequivocally down and the long term uptrend is likely under significant pressure = ⚠️. 23666-24020 is the nearest critical zone of supply — the Comp must close within this zone with a strong demand-side candle to confirm the demand-side is unequivocally back in control of the Comp's price.
S&P/ASX 200 (XJO)
%20chart_15%20Sep.png)
Analysis
I think I can, I think I can, I think I can… 🚂
The little Old Tin Pot keeps plugging away... one candle at a time… trying to chew through the latent supply that sits between here and the 21-Oct 2025 all-time high of 9116.
The intraday chart in the Markets section above shows far less than a confident, emphatic demand-side showing today… but we were still blessed with a modest demand-side candle — if still sporting the now-customary “degree of an upward pointing shadow”.
Today’s session high was 8881 — which makes sense given we’re tracking the 8876 point of supply from 11-Nov 2025 (today's close: 8862).
Short and long term trends are up ✅
Price action is rising peaks and rising troughs 📈✅
And we have a modest but growing predominance of demand-side candles (i.e., those with white bodies and or downward pointing shadows) ✅
Ideally, the angle of attack is steeper: demonstrating a greater imbalance between demand and supply (stronger FOMO + HOFU). Also ideally, volume might actually be above average for once indicating… well… that the OTP has a pulse… 💓
Ditto on my call yesterday: “Let’s see one more strong demand-side showing: a long white body and or a long downward pointing shadow — with an emphatic close at or near the candle’s high. Ideally, we see the 8876 point of supply consumed in the process.”
It got very close today... Tomorrow will be the day the OTP delivers the resounding BUY ME! signal we've all been waiting for... Right? 🤔
View
I remain comfortable at 1/2RP 🪣 (i.e., my personal allowable capital allocation limit for my investments in Australian stocks is 50%).
Key levels
8547-8562 is the new closest zone of demand. A close below this zone would confirm the supply side is back in control of the ASX 200's price. In theory though, the short term and long term trend ribbons now begin to act as a zone of dynamic demand (presently 8577-8730). 8876 is the next key point of supply. A close above it would confirm the demand-side is in control of the price — but it would take a miracle in the "loser" sectors to make this happen!
ChartWatch *LIVE* Webinar
ChartWatch *LIVE* Webinars – WEEKLY Wednesday's @ 12pm AEDT
Learn more about technical analysis and trend following through real case studies on ASX stocks. Australia's premier technical analyst, Carl Capolingua, shares his unique insights on stocks as requested by viewers. Ask about a company in your portfolio or anything related to trading and investing and get Carl's expert opinion.
Places are limited so >REGISTER NOW!<
Economy
Today
11:00 AUS MI Inflation Expectations
Result: +4.6% p.a. in January (30% trimmed mean) vs +4.7% p.a. in December and still above year-ago levels; wage expectations are below 12-month-ago levels.
Later this week
Friday
00:30 January Empire State Manufacturing Index (+1.1 forecast vs -3.9 in December)
Saturday
01:15 USA December Industrial Production m/m (+0.2% m/m forecast vs +0.2% m/m previous)
Latest News
Interesting Movers
Trading higher
+23.9% European Lithium (EUR) – CRML Announces Outstanding New High-Grade Results Tanbreez, rise is consistent with prevailing short and long term uptrends, a regular in ChartWatch ASX Scans Uptrends list 🔎📈
+17.7% Resolution Minerals (RML) – No news since 14-Jan Further Ultra High Grade Antimony and Silver Results.
+14.7% Findi (FND) – No news, bounced in the wake of the recent sharp selloff.
+11.0% Sunrise Energy Metals (SRL) – No news, rise is consistent with prevailing short and long term uptrends, a regular in ChartWatch ASX Scans Uptrends list 🔎📈
+9.1% Rocketboots (ROC) – No news, rise is consistent with prevailing short and long term uptrends 🔎📈
+8.0% Forrestania Resources (FRS) – Change in Substantial Holding for KGD, rise is consistent with prevailing short and long term uptrends, a regular in ChartWatch ASX Scans Uptrends list 🔎📈
+7.3% Meteoric Resources (MEI) – Change of Director's Interest Notice (Marcelo de Carvalho -1 million shares on market transaction!), rise is consistent with prevailing short and long term uptrends, a recent regular in ChartWatch ASX Scans Uptrends list 🔎📈
+7.3% Coronado Global Resources (CRN) – No news, general strength across the broader Coal sector today, rise is consistent with prevailing short and long term uptrends, a recent regular in ChartWatch ASX Scans Uptrends list 🔎📈
+6.4% WIA Gold (WIA) – Wia appoints a Managing Director & Chief Executive Officer, rise is consistent with prevailing short and long term uptrends, a regular in ChartWatch ASX Scans Uptrends list 🔎📈
+6.0% Winsome Resources (WR1) – No news since 14-Jan Becoming a substantial holder (Acorn Capital +5.4%), rise is consistent with prevailing short and long term uptrends, a regular in ChartWatch ASX Scans Uptrends list 🔎📈
+5.6% 4DMEDICAL (4DX) – 4DMedical completes $150 million institutional placement, rise is consistent with prevailing short and long term uptrends, a regular in ChartWatch ASX Scans Uptrends list 🔎📈
+4.5% South32 (S32) – No news, general strength across the broader Base Metals sector today, rise is consistent with prevailing short and long term uptrends, a regular in ChartWatch ASX Scans Uptrends list 🔎📈
+4.5% Lake Resources (LKE) – No news, rise is consistent with prevailing short and long term uptrends, a regular in ChartWatch ASX Scans Uptrends list 🔎📈
+4.3% Clinuvel Pharmaceuticals (CUV) – Managing Director Letter to Shareholders.
Trading lower
-12.1% Manuka Resources (MKR) – No news, consistent with recent high volatility.
-7.7% Proteomics International Laboratories (PIQ) – No news since 14-Jan Appointment of CEO and Managing Director.
-7.4% West Coast Silver (WCE) – No news, general strength across the broader Precious Metals sector today.
-7.0% Qoria (QOR) – No news.
-6.4% Clarity Pharmaceuticals (CU6) – SECuRE trial to continue with no modifications to protocol.
Broker Moves
Alligator Energy (AGE)
Retained at speculative buy at Bell Potter; Price Target: $0.07
Alcidion Group (ALC)
Retained at sector perform at RBC Capital Markets; Price Target: $0.14
ALS (ALQ)
Initiated at positive at E&P; Price Target: $25.80
Ama Group (AMA)
Retained at accumulate at Morgans; Price Target: $0.91 from $0.11
Amcor Plc (AMC)
Retained at outperform at Macquarie; Price Target: $87.10 from $17.42
Amcor Plc (AMCDD)
Retained at sector perform at RBC Capital Markets; Price Target: $68.00
ANZ Group Holdings (ANZ)
Upgraded to buy from neutral at Citi; Price Target: $40.30 from $37.00
Arena REIT (ARF)
Upgraded to buy from hold at Jefferies; Price Target: $3.90 from $3.78
Bendigo and Adelaide Bank (BEN)
Downgraded to sell from neutral at Citi; Price Target: $10.25 from $10.10
BHP Group (BHP)
Retained at accumulate at Ord Minnett; Price Target: $49.00 from $48.00
Boss Energy (BOE)
Retained at buy at Bell Potter; Price Target: $1.95 from $2.00
Bank of Queensland (BOQ)
Upgraded to buy from neutral at Citi; Price Target: $7.15 from $7.00
BlueScope Steel (BSL)
Retained at outperform at Macquarie; Price Target: $34.05 from $25.50
Commonwealth Bank of Australia (CBA)
Retained at sell at Citi; Price Target: $137.00 from $130.00
Computershare (CPU)
Retained at neutral at UBS; Price Target: $37.80 from $39.00
Charter Hall Retail REIT (CQR)
Upgraded to buy from hold at Jefferies; Price Target: $4.43 from $4.32
Coronado Global Resources Inc (CRN)
Upgraded to buy from hold at Argonaut Securities; Price Target: $0.80 from $0.30
Deep Yellow (DYL)
Retained at hold at Bell Potter; Price Target: $2.00 from $1.85
Generation Development Group (GDG)
Initiated at buy at Citi; Price Target: $7.50
GPT Group (GPT)
Retained at buy at Citi; Price Target: $6.00
HighCom (HCL)
Downgraded to hold from buy at Bell Potter; Price Target: $0.32 from $0.40
Insurance Australia Group (IAG)
Retained at equal-weight at Morgan Stanley; Price Target: $8.45
Iluka Resources (ILU)
Retained at neutral at Macquarie; Price Target: $7.10
IPH (IPH)
Retained at outperform at Macquarie; Price Target: $4.04
Judo Capital Holdings (JDO)
Retained at buy at Citi; Price Target: $2.15
Kinatico (KYP)
Retained at buy at Shaw and Partners; Price Target: $0.46
Lotus Resources (LOT)
Retained at speculative buy at Bell Potter; Price Target: $0.30 from $0.35
Lynas Rare Earths (LYC)
Retained at outperform at Macquarie; Price Target: $17.00
Monadelphous Group (MND)
Upgraded to buy from hold at Bell Potter; Price Target: $33.00 from $24.00
Macquarie Group (MQG)
Retained at neutral at Citi; Price Target: $210.00 from $200.00
National Australia Bank (NAB)
Retained at sell at Citi; Price Target: $38.00 from $37.00
Neuren Pharmaceuticals (NEU)
Retained at buy at Ord Minnett; Price Target: $30.50
NexGen Energy (Canada) (NXG)
Retained at hold at Bell Potter; Price Target: $19.30
Paladin Energy (PDN)
Retained at buy at Bell Potter; Price Target: $12.50 from $11.35
REA Group (REA)
Retained at outperform at RBC Capital Markets; Price Target: $270.00
Regal Partners (RPL)
Retained at buy at Morgans; Price Target: $4.25 from $4.00
South32 (S32)
Retained at neutral at UBS; Price Target: $4.00 from $3.50
Steadfast Group (SDF)
Retained at neutral at Macquarie; Price Target: $5.00 from $4.90
Super Retail Group (SUL)
Upgraded to accumulate from hold at Morgans; Price Target: $17.00 from $19.35
The Lottery Corporation (TLC)
Upgraded to overweight from underweight at Jarden; Price Target: $5.30 from $5.20
Treasury Wine Estates (TWE)
Downgraded to sell from neutral at Citi; Price Target: $4.80
Vicinity Centres (VCX)
Downgraded to underperform from hold at Jefferies; Price Target: $2.20 from $2.47
Westpac Banking Corporation (WBC)
Retained at neutral at Citi; Price Target: $39.00 from $38.50
Scans
Top Gainers
Code | Company | Last | % Chg |
|---|---|---|---|
| RVT | Richmond Vanadium Technology Ltd | $0.125 | +40.45% |
| MCO | Myeco Group Ltd | $0.018 | +38.46% |
| VAR | Variscan Mines Ltd | $0.011 | +37.50% |
| ZMI | ZINC of Ireland NL | $0.013 | +30.00% |
| PKY | Pathkey.Ai Ltd | $0.022 | +29.41% |
Top Fallers
Code | Company | Last | % Chg |
|---|---|---|---|
| CHRCB | Charger Metals NL | $0.05 | -28.57% |
| PL3 | Patagonia Lithium Ltd | $0.105 | -19.23% |
| ENL | Enlitic Inc | $0.017 | -15.00% |
| MEL | Metgasco Ltd | $0.023 | -14.82% |
| 3DA | Amaero Ltd | $0.28 | -13.85% |
52 Week Highs
Code | Company | Last | % Chg |
|---|---|---|---|
| MCO | Myeco Group Ltd | $0.018 | +38.46% |
| VAR | Variscan Mines Ltd | $0.011 | +37.50% |
| LNQ | LINQ Minerals Ltd | $0.53 | +27.71% |
| TXR | Talonx Resources Ltd | $0.019 | +26.67% |
| APL | Associate Global Partners Ltd | $0.20 | +17.65% |
52 Week Lows
Code | Company | Last | % Chg |
|---|---|---|---|
| CHRCB | Charger Metals NL | $0.05 | -28.57% |
| ENL | Enlitic Inc | $0.017 | -15.00% |
| MEL | Metgasco Ltd | $0.023 | -14.82% |
| FSI | Flagship Investments Ltd | $1.675 | -9.46% |
| CMO | Cosmo Metals Ltd | $0.012 | -7.69% |
Near Highs
Code | Company | Last | % Chg |
|---|---|---|---|
| SMLL | Betashares Australian Small Companies Select ETF | $4.84 | -0.82% |
| GLPR | iShares Ftse GBL Property Ex Aus (Aud Hedged) ETF | $27.13 | +0.74% |
| DFND | Vaneck Global Defence ETF | $44.76 | +1.73% |
| WVOL | iShares MSCI World Ex Aust Minimum Volatility ETF | $45.68 | +1.13% |
| PYC | PYC Therapeutics Ltd | $1.705 | +3.02% |
Relative Strength Index (RSI) Oversold
Code | Company | Last | % Chg |
|---|---|---|---|
| SGP | Stockland | $5.44 | -2.16% |
| EPI | Epiminder Ltd | $0.90 | 0.00% |
| 360 | LIFE360 Inc | $28.75 | -5.12% |
| XRO | Xero Ltd | $103.16 | -4.12% |
| EPY | Earlypay Ltd | $0.18 | 0.00% |
