News | Market Wraps
Evening Wrap: ASX 200 steadies ahead of softer Wall St open, energy stocks tumble despite a 5% jump in crude
The S&P/ASX 200 closed 6.4 points higher, up 0.07%.

Mentioned
The S&P/ASX 200 closed 6.4 points higher, up 0.07%.
The ASX 200 closed near flat after a chaotic weekend in the Strait of Hormuz. With the two-week ceasefire due to expire Tuesday US time and Iran rejecting a second round of talks, the risk-off mood kept a lid on early gains even as bargain hunters rotated into consumer stocks.
In stock specific news:
National Australia Bank (NAB) (-3.6%) — flagged $706 million in impairments and a sharp increase in provisions for bad debts ahead of its first-half results, citing borrowers impacted by the Iran war
Viva Energy (VEA) (-9.1%) — exited a trading halt after a fire at its Geelong refinery temporarily reduced diesel and jet fuel output by around 20% and petrol capacity by 40%, with full restoration expected within weeks
Karoon Energy (KAR) (-6.5%) — Fitch Ratings revised its outlook from stable to negative, citing production sustainability concerns and project timing issues amid operational disruptions
Worley (WOR) (-5.8%) — warned that the Middle East conflict is expected to reduce FY26 underlying EBITA by $30–40 million, driven by project delays and slower new contract awards
Monash IVF (MVF) (-5.9%) — rejected the revised $351 million takeover offer from the Genesis Capital and Soul Pattinson consortium, with the board citing a substantial discount to comparable IVF transactions and expressing confidence in incoming CEO Dr Victoria Atkinson
Be sure to click/scroll through for the usual reporting of the major sector and stock-specific moves, the broker responses to them, as well as all the key economic data in tonight's Evening Wrap.
Also, I have detailed technical analysis on the Nasdaq Composite and the S&P/ASX 200 in today's ChartWatch.
Let's dive in!
Today in Review
Mon 20 Apr 26, 4:59pm (AEST)
Name | Value | % Chg |
|---|---|---|
Major Indices | ||
| ASX 200 | 8,953.3 | +0.07% |
| All Ords | 9,174.0 | +0.06% |
| Small Ords | 3,539.1 | +0.13% |
| All Tech | 2,892.6 | -0.22% |
| Emerging Companies | 3,195.6 | +0.19% |
Currency | ||
| AUD/USD | 0.7146 | -0.33% |
US Futures | ||
| S&P 500 | 7,115.75 | -0.64% |
| Dow Jones | 49,282.0 | -0.72% |
| Nasdaq | 26,646.25 | -0.67% |
Name | Value | % Chg |
|---|---|---|
Sector | ||
| Consumer Discretionary | 3,509.6 | +1.52% |
| Consumer Staples | 12,698.2 | +1.38% |
| Real Estate | 3,564.6 | +1.06% |
| Industrials | 8,034.8 | +0.66% |
| Information Technology | 1,793.7 | +0.15% |
| Health Care | 27,977.2 | +0.05% |
| Materials | 23,965.4 | -0.00% |
| Communication Services | 1,749.4 | -0.06% |
| Financials | 9,839.9 | -0.10% |
| Utilities | 10,370.0 | -0.84% |
| Energy | 10,548.3 | -3.00% |
Markets
%20intraday%20chart_20%20Apr.png)
ASX 200 Session Chart
The S&P/ASX 200 (XJO) finished 6.4 points higher at 8,953.3, 0.62% from its session low and just 0.02% from its high. Despite the sluggish performance at benchmark level, in the broader-based S&P/ASX 300 (XKO) advancers beat decliners by a modest 162 to 116.
Consumer Discretionary (XDJ) (+1.5%) was the session's best performer — one of the last heavily beaten-down sectors yet to experience a sentiment-driven bounce. There was no obvious fundamental trigger given surging oil prices, but the flow was decisive as UBS lifted earnings forecasts for the supermarket giants on food inflation tailwinds. Tabcorp (TAH) (+6.0%), Lovisa (LOV) (+4.4%), Guzman Y Gomez (GYG) (+3.5%), and Wesfarmers (WES) (+2.4%) all gained.
Consumer Staples (XSJ) (+1.4%) rose alongside its discretionary counterpart, with the sector's defensive characteristics offering a plausible secondary rationale in a risk-off session. Woolworths (WOW) (+1.9%), Endeavour Group (EDV) (+1.8%), Treasury Wine Estates (TWE) (+2.2%), and Coles (COL) (+1.2%) were all firmer.
The Gold Sub-Index (XGD) (+1.3%) advanced despite COMEX gold futures easing 1.5% to US$4,808.40/oz in the Asian session. The likely explanation: local fund managers were following through on the stronger Friday close in US gold majors, where the commodity price cues had been positive at their respective close. Lower benchmark bond yields may also have helped. Ora Banda Mining (OBM) (+4.7%), Black Cat Syndicate (BC8) (+3.7%), Catalyst Metals (CYL) (+3.1%), and Kingsgate Consolidated (KCN) (+2.7%) were the standout movers.
Real Estate (XPJ) (+1.0%) was likely assisted by the same lower bond yield environment, with property trust income streams becoming more attractive as yields pulled back. Abacus Property (ABG) (+4.0%), Lendlease (LLC) (+3.4%), and Charter Hall (CHC) (+1.8%) all gained.
Information Technology (XIJ) (+0.2%) was mixed — unusually subdued given the Nasdaq hit another record high on Friday, extending its winning streak to 13 sessions. Life360 (360) (+5.3%) was a notable exception, benefiting from its dual-listed Nasdaq exposure. Macquarie Technology (MAQ) (+4.5%) also advanced.
Energy (XEJ) (-3.0%) was the session's clear loser despite Brent crude surging 5.6% to US$95.45/bbl as Hormuz tensions reignited. The apparent disconnect likely reflects fund flows lagging intraday commodity moves — as fund managers appeared to be playing catch-up to heavy losses in US energy majors on Friday, rather than reacting to Monday's oil price signal.
Viva Energy (VEA) (-9.1%) exited its trading halt and fell sharply following the Geelong refinery fire, with diesel and jet fuel output cut by around 20%. Karoon Energy (KAR) (-6.5%), Woodside Energy (WDS) (-2.9%), and Santos (STO) (-1.3%) were all lower.
Coal stocks were hit hard as Newcastle coal futures fell 2.7% to $122.90/t — Stanmore Resources (SMR) (-5.6%), New Hope Corp. (NHC) (-5.1%), and Whitehaven Coal (WHC) (-4.4%) each declined sharply.
Uranium names also faltered, with Paladin Energy (PDN) (-5.4%), Deep Yellow (DYL) (-3.0%), and Boss Energy (BOE) (-2.0%) all weaker.
Utilities (XUJ) (-0.8%) were likely tagged with the same energy-sector brush given the heavy weighting of energy-related companies in the index. AGL Energy (AGL) (-2.0%) and Origin Energy (ORG) (-1.0%) were lower.
Resources (XJR) (-0.6%) drifted lower as base metals stocks sold off on fears that surging oil prices would crimp global economic growth. COMEX copper futures fell 1.0% to US$6.051/lb and silver futures dropped 2.7% to US$79.66/oz. South32 (S32) (-3.1%), Alcoa (AAI) (-3.2%), IGO (IGO) (-3.4%), and Mineral Resources (MIN) (-2.0%) were all weaker.
In the majors, BHP (BHP) (-0.4%) and Rio Tinto (RIO) (-0.7%) also slipped, despite SGX iron ore futures rising 0.8% to US$106.65/t.
Rare earths stocks notably bucked a positive commodity price lead — as NdPr in China rose 0.9% to 802,500 CNY/t — with Arafura Rare Earths (ARU) (-3.1%), Iluka Resources (ILU) (-1.8%), and Lynas Rare Earths (LYC) (-1.5%) all lower.
Lithium stocks were flat to mixed despite Australian spodumene concentrate in China gaining 2.7% to US$2,490/t, with Elevra Lithium (ELV) (+1.6%) and Liontown Resources (LTR) (+1.4%) the modest exceptions.
Financials (XFJ) (-0.1%) were marginally negative, masking a sharp split within the sector. National Australia Bank (NAB) (-3.6%) dominated the headlines after flagging $706 million in impairments and a sharp increase in bad debt provisions ahead of its first-half results. Commonwealth Bank (CBA) (+1.1%) and Westpac (WBC) (+0.7%) both gained, partly aided by a rotation of flows away from NAB.
Today's best blue chip gainers
Company | Last Price | Change $ | Change % | 1mo % | 1yr % |
|---|---|---|---|---|---|
James Hardie Industries (JHX) | $30.02 | +$1.98 | +7.1% | +3.4% | -12.2% |
Life360 (360) | $22.48 | +$1.13 | +5.3% | +15.4% | +17.2% |
Amcor (AMC) | $57.90 | +$1.86 | +3.3% | +0.8% | -21.0% |
Wesfarmers (WES) | $74.63 | +$1.78 | +2.4% | -0.8% | +2.3% |
Genesis Minerals (GMD) | $6.74 | +$0.16 | +2.4% | +9.2% | +53.5% |
Block, (XYZ) | $98.86 | +$2.19 | +2.3% | +16.6% | +17.0% |
Treasury Wine Estates (TWE) | $4.10 | +$0.09 | +2.2% | +6.2% | -52.3% |
Newmont (NEM) | $159.68 | +$3.34 | +2.1% | +2.9% | +81.6% |
Greatland Resources (GGP) | $14.57 | +$0.3 | +2.1% | +20.3% | 0% |
SGH (SGH) | $41.60 | +$0.79 | +1.9% | +0.8% | -12.8% |
Woolworths (WOW) | $37.49 | +$0.7 | +1.9% | +4.1% | +20.0% |
Endeavour (EDV) | $3.32 | +$0.06 | +1.8% | -11.0% | -16.2% |
Charter Hall (CHC) | $21.14 | +$0.37 | +1.8% | +7.7% | +31.1% |
Evolution Mining (EVN) | $13.82 | +$0.24 | +1.8% | +2.4% | +66.1% |
Regis Resources (RRL) | $7.68 | +$0.13 | +1.7% | +8.9% | +60.7% |
Light & Wonder (LNW) | $123.57 | +$2.07 | +1.7% | +8.0% | -0.2% |
Capricorn Metals (CMM) | $11.80 | +$0.19 | +1.6% | +2.1% | +18.4% |
Goodman (GMG) | $29.82 | +$0.44 | +1.5% | +13.5% | +7.9% |
Ansell (ANN) | $27.53 | +$0.4 | +1.5% | -7.5% | -5.1% |
Cochlear (COH) | $170.70 | +$2.24 | +1.3% | -1.0% | -34.2% |
Today's worst blue chip losers
Company | Last Price | Change $ | Change % | 1mo % | 1yr % |
|---|---|---|---|---|---|
Worley (WOR) | $11.13 | -$0.69 | -5.8% | +9.4% | -3.6% |
Whitehaven Coal (WHC) | $7.65 | -$0.35 | -4.4% | -12.6% | +64.5% |
National Australia Bank (NAB) | $41.02 | -$1.53 | -3.6% | -13.1% | +20.2% |
IGO (IGO) | $8.94 | -$0.31 | -3.4% | +21.5% | +162.9% |
Ampol (ALD) | $31.88 | -$1.05 | -3.2% | +1.1% | +54.4% |
South32 (S32) | $4.39 | -$0.14 | -3.1% | +5.0% | +64.4% |
Woodside Energy (WDS) | $31.77 | -$0.96 | -2.9% | +1.1% | +64.4% |
Pro Medicus (PME) | $144.80 | -$3.94 | -2.6% | +15.6% | -29.0% |
W.H. Soul Pattinson (SOL) | $42.17 | -$1.1 | -2.5% | +7.8% | +16.2% |
Mineral Resources (MIN) | $62.25 | -$1.29 | -2.0% | +14.6% | +274.8% |
AGL Energy (AGL) | $9.31 | -$0.19 | -2.0% | +0.2% | -9.3% |
Lynas Rare Earths (LYC) | $20.39 | -$0.31 | -1.5% | 0% | +154.2% |
Wisetech Global (WTC) | $45.49 | -$0.69 | -1.5% | +2.0% | -45.7% |
Car (CAR) | $25.87 | -$0.36 | -1.4% | +9.4% | -20.7% |
Santos (STO) | $7.55 | -$0.1 | -1.3% | -2.8% | +37.5% |
Sonic Healthcare (SHL) | $20.33 | -$0.23 | -1.1% | -2.2% | -19.6% |
Technology One (TNE) | $30.49 | -$0.34 | -1.1% | +17.5% | +10.2% |
Origin Energy (ORG) | $12.34 | -$0.13 | -1.0% | +5.0% | +21.6% |
Dyno Nobel (DNL) | $3.20 | -$0.03 | -0.9% | +2.2% | +44.1% |
ChartWatch
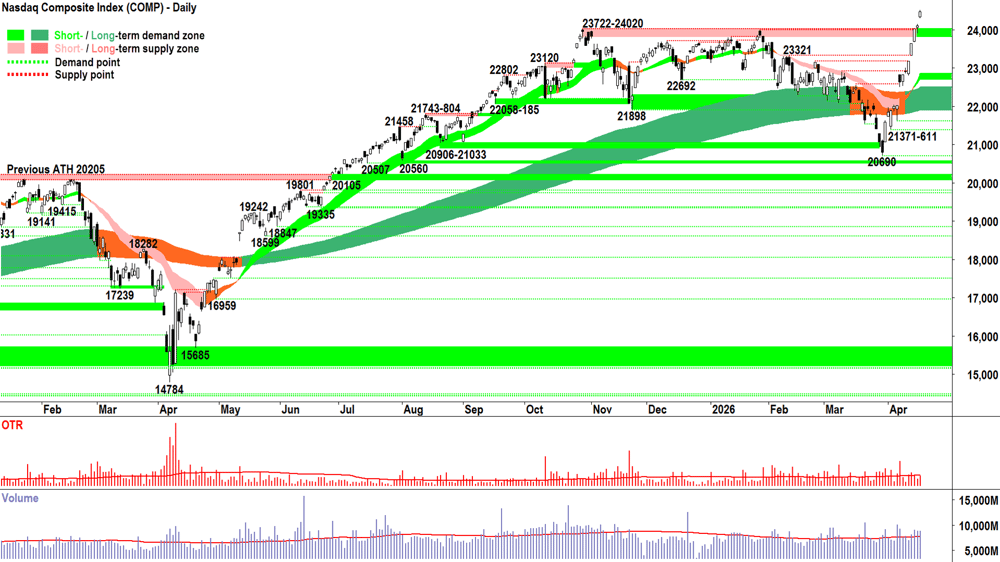
Nasdaq Composite Index
Analysis
11 out of 13 white candles — one down session among them — for a 18.5% near-vertical gain = 🚀🚀🚀!
Just breathtaking! An absolute lesson in never underestimating the Comp’s (and the broader US stock market’s) ability to put the BULL back in the bull market! 🐂
Comp futures are approx. 0.6% lower as I write this, so we’ll likely get at least some degree of supply side challenge at the open. As I’ve written here many times: the open is irrelevant — only the close matters.
And, in a healthy bull market, we expect high closes. As for how this manifests in candles, we expect full white bodies and or downward pointing shadows. Each is a flag that market participants are:
BTD = Dips in prices are seen as value, excess cash in the system is desperate to find value when and where it can… Cash will soak up any supply side influxes, which prove to only be temporary!!!
FOMO = Too much cash, or too far behind the curve with respect to getting one’s portfolio back to market weight — either way… as prices climb, so too does the anxiety among both groups of investors!!! 😱
HOFU = For those lucky enough to already have risk in (exactly why my model NEVER does something dumb like going ALL CASH 🚫) — they know the risk isn’t if stocks fall… It’s if stocks continue to rise… And so, they must hold on for further upside!!! 🙏
Until we see the opposite of these price action characteristics — one must assume the path of least resistance in the Comp’s price is up.
Investors are singing: Comp... don't let me down... 📉🚫
There’s nothing in the above chart that suggests anything but total demand side control, and therefore this can only be construed as a “risk-on” proposition. However, I still haven’t seen the customary supply side challenge followed by a strong demand side response — a dink back down, then back up again — so I can measure the supply side’s size and intent, as much as the demand side’s ability to counter it.
View
2/3RP (RP = Risk Position — it reflects my personal allowable capital allocation limit for my investments in US stocks. So 1/2RP is 50%, 2/3RP is 67% and FRP is 100% 🪣). I'm waiting to assess the next dink before committing to FRP — although I acknowledge the FOMO gripping most professional fund managers right now. Nope, they didn't see the severity of this face-ripping rally coming either!!! 🙈
Key levels
There are no key supply zones to contend with. The old all-time high supply zone of 23722-24020 will likely act as a short term zone of demand, however the short-term trend ribbon (presently 22697-22839) is now the key zone of demand. If the price closes back below this range, the supply-side is very likely back in control of the Comp's price.
S&P/ASX 200 (XJO)
%20chart_20%20Apr.png)
Analysis
Old people like me would call that a “Claytons down day”, i.e., the down day you have when you're not having a down day.
For those of you fortunate souls young enough to not know what that means, this video will prove suitably confusing:
Yes, I went there! The Beetles and Jack Thomson in the same ChartWatch! 👴
Claytons down days might as well be up days. They demonstrate there’s just no appetite among investors to facilitate an environment of excess supply (S > D = P ⬇️).
Investors are having absolutely none of:
Selling their stocks — for fear of being even more underweight the benchmark, just as much as they fear missing out on any future gains.
Growing their already growing cash piles — because bloody hell, who wants cash when stock prices are rising vertically (well, not here on the Old Tin Pot... but you know!)
It means pullbacks like this morning's are steadily bought into, ensuring that daily candles close white-bodied, and or with downward pointing shadows, and at their highs. ✅✅✅
I call those 3 traits the "fingerprints of excess demand". And whether you agree with it or believe it's sustainable — last I checked, D > S = P ⬆️.
I better average one checklist per ChartWatch to ensure the technical analysis content here at least matches the old YouTube video content, so here goes:
ST trend ribbon = ⬆️ + price is above the ST trend ribbon + short term trend ribbon is acting as a zone of dynamic supply. ✅
LT trend ribbon = ⬆️ + price is above the ST trend ribbon + short term trend ribbon is acting as a zone of dynamic supply. ✅
Price action = rising peaks and rising troughs = demand reinforcement and supply removal = FOMO + HOFU + BTD. ✅
Candles are predominantly demand-side in nature (i.e., white-bodied and or downward pointing shadows) = pervasive programmed buy orders dominant + FOMO + HOFU + BTD. ✅
View
✅✅✅✅
It's very difficult to justify the prevailing 1/2RP. As noted last few updates, it would only take one strong demand side candle for me to commit to a move to 2/3RP 🪣 (i.e., my personal allowable capital allocation limit for my investments in Australian stocks will increase from the present 50% to 67%).
Happy to entertain RP between 1/2RP and 2/3RP where good quality long setups are available. I expect the official move trigger is but a candle away. (Famous last words! 🤦)
Key levels
9201, the all time high, is the key point of supply. Below it there likely remains a degree of trepidation among market participants. A close above the last peak at 9022 would be constructive.
8889 is shaping as an important short term point of demand, but the short-term trend ribbon (presently 8795-8816) remains the key zone of demand. If the price closes back below this range, the supply-side is very likely back in control of the OTP's price.
(Glossary of acronyms! MOTN: More Often Than Not | FOMO: Fear Of Missing Out | HOFU: Holding On For Upside | BTD: Buy The Dip | STR: Sell The Rally | RP: Risk Position)
ChartWatch *LIVE* Webinar
ChartWatch *LIVE* Webinars – WEEKLY Wednesday's @ 12pm AEDT
Learn more about technical analysis and trend following through real case studies on ASX stocks. Australia's premier technical analyst, Carl Capolingua, shares his unique insights on stocks as requested by viewers. Ask about a company in your portfolio or anything related to trading and investing and get Carl's expert opinion.
Places are limited so >REGISTER NOW!<
Economy
Today
CHN Peoples Bank of China (PBOC) Loan Prime Rate (LRP) announcement
1-year LPR: +3.0% p.a. actual (unchanged) vs +3.0% p.a. forecast
5-year LPR: +3.5% p.a. actual (unchanged) vs +3.5% p.a. forecast
Later this week
Tuesday
22:30 USA March Core Retail Sales (+1.3% m/m forecast vs +0.5% m/m in February)
Wednesday
00:00 USA Fed Chair-Designate Warsh Speaks (Due to testify on his nomination as the Federal Reserve Chairperson before the Senate Committee on Banking, Housing, and Urban Affairs)
00:00 USA March Pending Home Sales (+0.0% m/m forecast vs +1.8% m/m in February)
Thursday
09:00 AUS April Flash Purchasing Managers Index (PMI)
Manufacturing: was 49.8 in March
Services: was 46.3 in March
09:00 USA April Flash PMIs
Manufacturing: 52.5 forecast vs 49.8 in March
Services: was 50.1 forecast vs 46.3 in March
Friday
No major economic data scheduled for release on this day
Latest News
Interesting Movers
Trading higher
+17.6% SKS Technologies (SKS) – SKS expands Data Centre contract to $210M, rise is consistent with prevailing short and long term uptrends, a regular in ChartWatch ASX Scans Uptrends list 🔎📈
+8.1% Resolution Minerals (RML) – No news since 17-Apr Brett Lynch to join Resolution Board for US Expansion, rise is consistent with prevailing short and long term uptrends 🔎📈
+8.0% Genusplus (GNP) – No news, rise is consistent with prevailing short and long term uptrends, a regular in ChartWatch ASX Scans Uptrends list 🔎📈
+7.7% Zip (ZIP) – Continued positive response to 17-Apr 3Q FY26 Results Update.
+7.1% James Hardie Industries (JHX) – No news, strength in stocks dual-listed on US exchanges.
+6.0% Tabcorp (TAH) – No news, general strength across the broader Consumer Discretionary sector today, rise is consistent with prevailing short and long term uptrends 🔎📈
+5.3% Life360 (360) – No news, strength in stocks dual-listed on US exchanges.
+4.7% Ora Banda Mining (OBM) – No news, general strength across the broader Gold sector today.
+4.5% Macquarie Technology (MAQ) – No news, general strength across the broader Information Technology sector today.
+4.4% Appen (APX) – No news, general strength across the broader Information Technology sector today.
+4.4% Lovisa (LOV) – No news, general strength across the broader Consumer Discretionary sector today.
+3.7% Black Cat Syndicate (BC8) – No news, general strength across the broader Gold sector today.
+3.7% St Barbara (SBM) – No news, general strength across the broader Gold sector today.
+3.5% Guzman Y Gomez (GYG) – Becoming a substantial holder, general strength across the broader Consumer Discretionary sector today, (Citigroup Global Markets +5.0%).
Trading lower
-10.6% Dateline Resources (DTR) – Continued negative response to 17-Apr Dateline Comment on Media Article.
-9.1% Viva Energy (VEA) – 1Q2026 Operating Update and Geelong Refinery Update.
-8.1% Sunrise Energy Metals (SRL) – No news, general weakness across the broader Critical Minerals sector today.
-7.2% Amplitude Energy (AEL) – No news, general weakness across the broader Energy sector today.
-6.5% Karoon Energy (KAR) – Fitch affirms rating. Outlook revised to negative, general weakness across the broader Energy sector today.
-5.8% Worley (WOR) – Conflict in the Middle East and impact on Group Outlook, general weakness across the broader Energy sector today.
-5.6% Stanmore Resources (SMR) – 2025 Annual Report, general weakness across the broader Energy sector today.
-5.4% Paladin Energy (PDN) – No news, downgraded to neutral from outperform at Macquarie, general weakness across the broader Energy sector today.
-5.1% New Hope Corp. (NHC) – No news, general weakness across the broader Energy sector today.
-4.4% Whitehaven Coal (WHC) – No news, general weakness across the broader Energy sector today.
-3.6% National Australia Bank (NAB) – NAB balance sheet strengthened and 1H26 earnings impacts.
Broker Moves
Alcoa Corporation (AAI)
Upgraded to accumulate from hold at Ord Minnett; Price Target: $107.00
Retained at neutral at UBS; Price Target: $105.00 from $95.00
ALS (ALQ)
Retained at outperform at Macquarie; Price Target: $23.50
ASX (ASX)
Retained at neutral at UBS; Price Target: $58.85
AUB Group (AUB)
Retained at buy at UBS; Price Target: $34.00
BHP Group (BHP)
Retained at overweight at Morgan Stanley; Price Target: $57.50
Boss Energy (BOE)
Retained at overweight at Morgan Stanley; Price Target: $1.90
Beach Energy (BPT)
Retained at underperform at Macquarie; Price Target: $0.77
Challenger (CGF)
Retained at buy at UBS; Price Target: $10.05
Collins Foods (CKF)
Retained at buy at Morgans; Price Target: $12.50 from $12.70
Coles Group (COL)
Retained at buy at UBS; Price Target: $25.00 from $24.00
Deterra Royalties (DRR)
Retained at overweight at Morgan Stanley; Price Target: $4.45
Endeavour Group (EDV)
Retained at neutral at UBS; Price Target: $3.60 from $4.00
Fortescue (FMG)
Retained at underweight at Morgan Stanley; Price Target: $19.40
Graincorp (GNC)
Retained at neutral at Macquarie; Price Target: $6.60
GPT Group (GPT)
Retained at buy at Citi; Price Target: $6.00
HUB24 (HUB)
Retained at neutral at UBS; Price Target: $86.00
Insurance Australia Group (IAG)
Retained at buy at UBS; Price Target: $8.70
IGO (IGO)
Retained at underweight at Morgan Stanley; Price Target: $7.50
Iluka Resources (ILU)
Retained at overweight at Morgan Stanley; Price Target: $7.90
Inghams Group (ING)
Retained at underperform at Macquarie; Price Target: $1.80
L1 Group (L1G)
Retained at neutral at UBS; Price Target: $1.17
LGI (LGI)
Retained at speculative buy at Ord Minnett; Price Target: $4.40 from $4.45
Light & Wonder Inc. (LNW)
Retained at outperform at Macquarie; Price Target: $205.00
Lynas Rare Earths (LYC)
Retained at equal-weight at Morgan Stanley; Price Target: $20.45
Macquarie Technology Group (MAQ)
Retained at overweight at Morgan Stanley; Price Target: $82.00 from $83.00
Magellan Financial Group (MFG)
Retained at neutral at UBS; Price Target: $9.90
Mirvac Group (MGR)
Retained at outperform at Macquarie; Price Target: $2.22
Many Peaks Minerals (MPK)
Retained at speculative buy at Canaccord Genuity; Price Target: $1.85
Medibank Private (MPL)
Retained at neutral at UBS; Price Target: $4.85
Metcash (MTS)
Retained at buy at UBS; Price Target: $3.50 from $4.00
Navigator Global Investments (NGI)
Retained at buy at UBS; Price Target: $3.50
NIB Holdings (NHF)
Retained at neutral at UBS; Price Target: $7.05
NRW Holdings (NWH)
Retained at outperform at Macquarie; Price Target: $6.90 from $6.60
NEXTDC (NXT)
Retained at overweight at Morgan Stanley; Price Target: $19.00 from $21.00
Orica (ORI)
Retained at overweight at Morgan Stanley; Price Target: $27.00 from $30.00
Paladin Energy (PDN)
Retained at buy at Canaccord Genuity; Price Target: $16.00
Downgraded to hold from buy at Jefferies; Price Target: $14.00
Retained at underweight at JPMorgan; Price Target: $9.30 from $9.40
Downgraded to neutral from outperform at Macquarie; Price Target: $13.55 from $13.50
Retained at overweight at Morgan Stanley; Price Target: $13.70
PLS Group (PLS)
Retained at equal-weight at Morgan Stanley; Price Target: $5.25
Pro Medicus (PME)
Retained at buy at Morgans; Price Target: $210.00 from $275.00
Pinnacle Investment Management Group (PNI)
Retained at outperform at Macquarie; Price Target: $25.25
Retained at neutral at UBS; Price Target: $15.15
PEXA Group (PXA)
Retained at outperform at Macquarie; Price Target: $18.35
Retained at neutral at UBS; Price Target: $15.70
QBE Insurance Group (QBE)
Retained at buy at UBS; Price Target: $23.95
QPM Energy (QPM)
Retained at speculative buy at Ord Minnett; Price Target: $0.10
Ramsay Health Care (RHC)
Retained at outperform at Macquarie; Price Target: $43.40
Rio Tinto (RIO)
Retained at equal-weight at Morgan Stanley; Price Target: $163.00
South32 (S32)
Retained at outperform at Macquarie; Price Target: $5.80 from $5.60
Retained at overweight at Morgan Stanley; Price Target: $5.00
Scentre Group (SCG)
Retained at buy at Citi; Price Target: $4.40
Steadfast Group (SDF)
Retained at buy at UBS; Price Target: $6.00
SEEK (SEK)
Retained at neutral at Macquarie; Price Target: $18.50
Sandfire Resources (SFR)
Retained at underweight at Morgan Stanley; Price Target: $16.05
Stockland (SGP)
Retained at outperform at Macquarie; Price Target: $4.42
Superloop (SLC)
Retained at outperform at Macquarie; Price Target: $3.50
Suncorp Group (SUN)
Retained at buy at UBS; Price Target: $19.25
Technology One (TNE)
Downgraded to hold from buy at Bell Potter; Price Target: $31.00 from $29.00
TPG Telecom (TPG)
Retained at outperform at Macquarie; Price Target: $4.40
Temple & Webster Group (TPW)
Downgraded to neutral from buy at Citi; Price Target: $8.00 from $9.50
Ventia Services Group (VNT)
Retained at outperform at Macquarie; Price Target: $6.45
Whitehaven Coal (WHC)
Upgraded to outperform from neutral at Macquarie; Price Target: $9.50 from $9.25
Retained at overweight at Morgan Stanley; Price Target: $9.75
Woolworths Group (WOW)
Retained at neutral at UBS; Price Target: $37.25 from $35.35
Zip Co (ZIP)
Retained at buy at Citi; Price Target: $2.60
Retained at buy at Jefferies; Price Target: $3.80 from $4.20
Retained at outperform at Macquarie; Price Target: $3.40 from $3.35
Retained at buy at Ord Minnett; Price Target: $4.00 from $3.90
Retained at buy at UBS; Price Target: $3.10 from $2.85
Retained at buy at Unified Capital Partners; Price Target: $4.86 from $4.64
Scans
Top Gainers
Code | Company | Last | % Chg |
|---|---|---|---|
| TAT | Tartana Minerals Ltd | $0.028 | +33.33% |
| COB | Cobalt Blue Holdings Ltd | $0.11 | +32.53% |
| NYM | Narryer Metals Ltd | $0.065 | +22.64% |
| RTG | RTG Mining Inc | $0.041 | +20.59% |
| TAL | Talius Group Ltd | $0.065 | +18.18% |
Top Fallers
Code | Company | Last | % Chg |
|---|---|---|---|
| SDV | Scidev Ltd | $0.125 | -32.43% |
| HFR | Highfield Resources Ltd | $0.043 | -23.21% |
| UM1 | Unity Metals Ltd | $0.17 | -20.93% |
| AAJ | Aruma Resources Ltd | $0.014 | -17.65% |
| PLY | Playside Studios Ltd | $0.29 | -17.14% |
52 Week Highs
Code | Company | Last | % Chg |
|---|---|---|---|
| NYM | Narryer Metals Ltd | $0.065 | +22.64% |
| SKS | SKS Technologies Group Ltd | $6.67 | +17.64% |
| BXN | Bioxyne Ltd | $0.077 | +11.59% |
| SHE | Stonehorse Energy Ltd | $0.012 | +9.09% |
| MPK | Many Peaks Minerals Ltd | $1.28 | +8.94% |
52 Week Lows
Code | Company | Last | % Chg |
|---|---|---|---|
| SDV | Scidev Ltd | $0.125 | -32.43% |
| UM1 | Unity Metals Ltd | $0.17 | -20.93% |
| GG1 | Green & Gold Minerals Ltd | $0.12 | -14.29% |
| NMT | Neometals Ltd | $0.044 | -12.00% |
| DTZ | DOTZ Nano Ltd | $0.027 | -11.48% |
Near Highs
Code | Company | Last | % Chg |
|---|---|---|---|
| IHD | iShares S&P/ASX DIV Opportunities Esg Screened ETF | $17.13 | 0.00% |
| AYLD | Global X S&P/ASX 200 Covered Call Complex ETF | $10.27 | +0.10% |
| MVB | Vaneck Australian Banks ETF | $44.97 | -0.62% |
| HGBL | Betashares Global Shares Currency Hedged ETF | $80.03 | -0.04% |
| AHL | Adrad Holdings Ltd | $1.255 | +2.45% |
Relative Strength Index (RSI) Oversold
Code | Company | Last | % Chg |
|---|---|---|---|
| DGL | DGL Group Ltd | $0.38 | -3.80% |
| HVN | Harvey Norman Holdings Ltd | $4.57 | -2.97% |
| EVO | Embark Early Education Ltd | $0.40 | -1.24% |
| EML | EML Payments Ltd | $0.395 | +5.33% |
| ORA | Orora Ltd | $1.465 | -0.34% |
