News | Market Wraps
Evening Wrap: ASX 200 dips on big banks and resources sell-off as tech-pocalypse ends, WTC, XRO and PME surge
The S&P/ASX 200 closed 23.7 points lower, down 0.26%.

Mentioned
The S&P/ASX 200 closed 23.7 points lower, down 0.26%.
The ASX 200 slid as a stronger-than-expected jobs report kept a third RBA rate hike of the year firmly in play, cooling the optimism from Wall Street's record overnight session.
The resilient labour market data hit rate-sensitive financials, but arguably a sharp rotation out of the major banks and resources and into beaten-down technology stocks — which posted their best single-session gain in over a year — was already under way...
In stock specific news:
Ora Banda Mining (OBM) (+10.3%) — record March quarter gold production of 38,766 ounces, up 21%, generating $76.3 million in free cash flow
Netwealth (NWL) (+5.9%) — reported $4 billion in net inflows for the March quarter, 5% above analyst expectations, with total funds under administration reaching $125.8 billion
AMP (AMP) (+3.6%) — cash flows into its platform business hit $1.1 billion in the year to March 31, up 45%
ASX Ltd. (ASX) (+1.2%) — advanced despite S&P downgrading its long-term issuer credit rating from AA- to A+ over governance concerns flagged in ASIC's final report
Newmont (NEM) (-5.1%) — sold off as the gold sector unwound despite a firmer bullion price, with large gold stocks caught in the broad rotation out of resources
Evolution Mining (EVN) (-4.2%) — fell in the same sector-wide gold selldown
Ansell (ANN) (-3.7%) — As the company announced the unexpected resignation of Chief Financial Officer Brian Montgomery, who is leaving to join Hologic, a US-based MedTech company.
Be sure to click/scroll through for the usual reporting of the major sector and stock-specific moves, the broker responses to them, as well as all the key economic data in tonight's Evening Wrap.
Also, I have detailed technical analysis on the Nasdaq Composite and the S&P/ASX 200 in today's ChartWatch.
Let's dive in!
Today in Review
Thu 16 Apr 26, 5:02pm (AEST)
Name | Value | % Chg |
|---|---|---|
Major Indices | ||
| ASX 200 | 8,955.0 | -0.26% |
| All Ords | 9,173.6 | -0.08% |
| Small Ords | 3,530.3 | +1.16% |
| All Tech | 2,866.2 | +5.70% |
| Emerging Companies | 3,185.9 | +1.02% |
Currency | ||
| AUD/USD | 0.7185 | +0.21% |
US Futures | ||
| S&P 500 | 7,077.5 | +0.24% |
| Dow Jones | 48,733.0 | +0.13% |
| Nasdaq | 26,481.75 | +0.44% |
Name | Value | % Chg |
|---|---|---|
Sector | ||
| Information Technology | 1,769.8 | +7.40% |
| Real Estate | 3,530.7 | +1.87% |
| Communication Services | 1,743.7 | +1.14% |
| Consumer Discretionary | 3,484.6 | +0.75% |
| Utilities | 10,349.1 | +0.61% |
| Consumer Staples | 12,570.3 | +0.02% |
| Health Care | 28,087.4 | -0.15% |
| Industrials | 7,935.2 | -0.26% |
| Materials | 23,948.5 | -0.41% |
| Energy | 10,924.2 | -0.56% |
| Financials | 9,874.7 | -1.28% |
Markets
%20intraday%20chart_16%20Apr.png)
ASX 200 Session Chart
The S&P/ASX 200 (XJO) finished 23.7 points lower at 8,955.0, 0.7% from its session high and just 0.2% from its low. Despite the misstep at benchmark level, in the broader-based S&P/ASX 300 (XKO) advancers beat decliners by a respectable 179 to 106.
Information Technology (XIJ) (+7.4%) delivered its best single session in over a year, staging a massive snapback that was likely a combination of short covering and speculative bottom-picking after weeks of heavy selling. The catalyst was the Nasdaq's record close overnight — local names simply couldn't ignore a lead that large.
The sector is still around 40% below its peak from July last year, but traded at a five-week high today. Life360 (360) (+12.5%) and WiseTech Global (WTC) (+12.4%) led the charge, with Xero (XRO) (+9.0%) also surging. The sector's five-day gain has now reached 10%.
Real Estate (XPJ) (+1.8%) was pulled higher in the slipstream — with the shorts forced to de-risk the possibility of similar sentiment-led recoveries in other beaten-down corners of the market. Goodman Group (GMG) (+4.0%), Cromwell Property (CMW) (+3.8%), and Lendlease (LLC) (+2.8%) were all firmer.
Communication Services (XTJ) (+1.1%) followed the same short-squeeze logic, with online classifieds a particular beneficiary of the rotation back into growth. Seek (SEK) (+7.1%), CAR Group (CAR) (+6.8%), and REA Group (REA) (+6.0%) all posted strong gains.
Consumer Discretionary (XDJ) (+0.8%) edged higher in sympathy, with Temple & Webster (TPW) (+9.2%), Myer (MYR) (+5.4%), and IDP Education (IEL) (+5.0%) the standout movers.
The Gold Sub-Index (XGD) (-1.8%) was the session's worst performer — a striking disconnect given COMEX gold futures actually rose 0.5% to US$4,845/oz. The sell-down wasn't driven by fundamentals but by the rotation dynamic: fund managers who had been running profitable long positions in resources stocks were trimming winners to fund their tech and growth re-entries. Newmont (NEM) (-5.1%) and Evolution Mining (EVN) (-4.2%) bore the steepest losses.
Financials (XFJ) (-1.3%) came under heavy selling as the stronger-than-expected jobs data raised the prospect of a third RBA rate hike this year, keeping pressure on net interest margins and asset quality. Higher rates may sound like a bank-friendly environment, but they also increase credit stress — and with valuations already stretched after a strong run, investors used the data as a reason to rotate out. Commonwealth Bank (CBA) (-2.8%), National Australia Bank (NAB) (-2.5%), Westpac (WBC) (-1.7%), and ANZ (ANZ) (-1.3%) all fell sharply.
Energy (XEJ) (-0.6%) slipped even as Brent crude futures steadied to US$94.67/bbl. Woodside Energy (WDS) (-1.1%) and Santos (STO) (-1.0%) were both lower, while Yancoal Australia (YAL) (-2.0%) also declined.
The session's notable energy story was a fire at Viva Energy's (VEA) (trading halt) Geelong refinery — a facility that processes around 120,000 barrels per day and supplies more than 50% of Victoria's fuel — which forced a trading halt in Viva's shares. Ampol (ALD) (+0.2%) edged up modestly, likely reflecting some market pricing of a potential supply shift toward its competing refining capacity.
Resources (XJR) (-0.4%) drifted lower in the rotation — despite the fact that base and industrial metals were broadly firmer in underlying commodity markets. COMEX copper futures rose 0.6% to US$6.123/lb, their highest since late January, and SGX iron ore futures gained 1.1% to US$105.40/t. BHP (BHP) (-0.3%) slipped despite the supportive commodity backdrop.
Healthcare stocks were notably absent from the high-PE, long-duration resurgence, with CSL (CSL) (-1.4%) and Cochlear (COH) (-1.3%) both continuing their drift lower.
In other commodities moves, lithium carbonate futures on the GFEX surged 3.1% to 174,180 CNY/t and COMEX uranium futures gained 0.9% to US$86.20/lb — and stocks in these sectors responded.
Core Lithium (CXO) (+9.7%), Liontown Resources (LTR) (+8.9%), Pmet Resources (PMT) (+7.2%), Pilbara Minerals (PLS) (+5.9%), and IGO (IGO) (+4.2%) all surged in lithium, while Boss Energy (BOE) (+4.5%), Bannerman Energy (BMN) (+3.8%), Paladin Energy (PDN) (+2.6%), and Deep Yellow (DYL) (+2.3%) were best in uranium.
Elsewhere in commodities moves, silver futures rose 1.2% to US$80.59/oz, while NdPr rare earth prices in China edged down 0.3% to 775,500 CNY/t.
Today's best blue chip gainers
Company | Last Price | Change $ | Change % | 1mo % | 1yr % |
|---|---|---|---|---|---|
Life360 (360) | $21.31 | +$2.36 | +12.5% | +9.9% | +11.5% |
Wisetech Global (WTC) | $44.90 | +$4.94 | +12.4% | -3.7% | -47.3% |
Xero (XRO) | $81.86 | +$6.76 | +9.0% | +3.6% | -44.3% |
Pro Medicus (PME) | $148.88 | +$11.46 | +8.3% | +13.1% | -27.0% |
Seek (SEK) | $15.37 | +$1.02 | +7.1% | +3.1% | -26.9% |
Car (CAR) | $25.66 | +$1.63 | +6.8% | +6.0% | -22.2% |
Technology One (TNE) | $30.58 | +$1.77 | +6.1% | +18.8% | +9.7% |
REA (REA) | $171.56 | +$9.73 | +6.0% | +2.0% | -28.6% |
PLS Group (PLS) | $5.71 | +$0.32 | +5.9% | +20.0% | +302.1% |
Ramsay Health Care (RHC) | $42.30 | +$1.77 | +4.4% | +2.2% | +26.8% |
IGO (IGO) | $8.73 | +$0.35 | +4.2% | +18.6% | +148.0% |
Hub24 (HUB) | $93.13 | +$3.58 | +4.0% | +15.0% | +45.0% |
Goodman (GMG) | $29.53 | +$1.13 | +4.0% | +16.2% | +6.2% |
Nextdc (NXT) | $13.90 | +$0.51 | +3.8% | +4.7% | +26.0% |
AMP (AMP) | $1.445 | +$0.05 | +3.6% | +18.4% | +26.8% |
Aristocrat Leisure (ALL) | $49.13 | +$1.45 | +3.0% | +7.1% | -22.2% |
JB HI-FI (JBH) | $76.45 | +$2.11 | +2.8% | +0.5% | -20.0% |
Block, (XYZ) | $95.16 | +$2.16 | +2.3% | +10.5% | +6.3% |
Macquarie (MQG) | $240.00 | +$4.87 | +2.1% | +23.7% | +33.1% |
Eagers Automotive (APE) | $23.69 | +$0.47 | +2.0% | +13.1% | +58.8% |
Today's worst blue chip losers
Company | Last Price | Change $ | Change % | 1mo % | 1yr % |
|---|---|---|---|---|---|
Newmont (NEM) | $157.05 | -$8.37 | -5.1% | +1.4% | +98.6% |
James Hardie (JHX) | $28.00 | -$1.25 | -4.3% | -0.5% | -22.4% |
Evolution Mining (EVN) | $13.85 | -$0.6 | -4.2% | +5.7% | +94.0% |
Greatland Resources (GGP) | $14.49 | -$0.61 | -4.0% | +25.9% | 0% |
Ansell (ANN) | $27.72 | -$1.05 | -3.7% | -7.1% | -8.1% |
Commonwealth Bank (CBA) | $178.11 | -$5.08 | -2.8% | +1.5% | +15.3% |
National Australia Bank (NAB) | $43.41 | -$1.11 | -2.5% | -7.8% | +28.4% |
Downer EDI (DOW) | $7.45 | -$0.19 | -2.5% | -0.4% | +37.5% |
Amcor (AMC) | $55.84 | -$1.38 | -2.4% | -3.7% | -24.1% |
Capricorn Metals (CMM) | $11.83 | -$0.29 | -2.4% | +3.7% | +33.1% |
Resmed (RMD) | $32.02 | -$0.68 | -2.1% | -2.5% | -8.1% |
The A2 Milk Company (A2M) | $7.55 | -$0.16 | -2.1% | -20.4% | -8.0% |
Westpac Banking Corp (WBC) | $40.02 | -$0.67 | -1.6% | -2.2% | +30.7% |
Northern Star Resources (NST) | $24.30 | -$0.39 | -1.6% | +18.1% | +19.8% |
Orica (ORI) | $20.32 | -$0.32 | -1.6% | +5.0% | +27.7% |
Westgold Resources (WGX) | $6.47 | -$0.09 | -1.4% | +8.7% | +129.4% |
CSL (CSL) | $137.55 | -$1.89 | -1.4% | -2.2% | -43.1% |
Bendigo Adelaide Bank (BEN) | $11.05 | -$0.15 | -1.3% | +10.1% | +7.3% |
Cochlear (COH) | $169.79 | -$2.21 | -1.3% | -1.9% | -33.9% |
ChartWatch
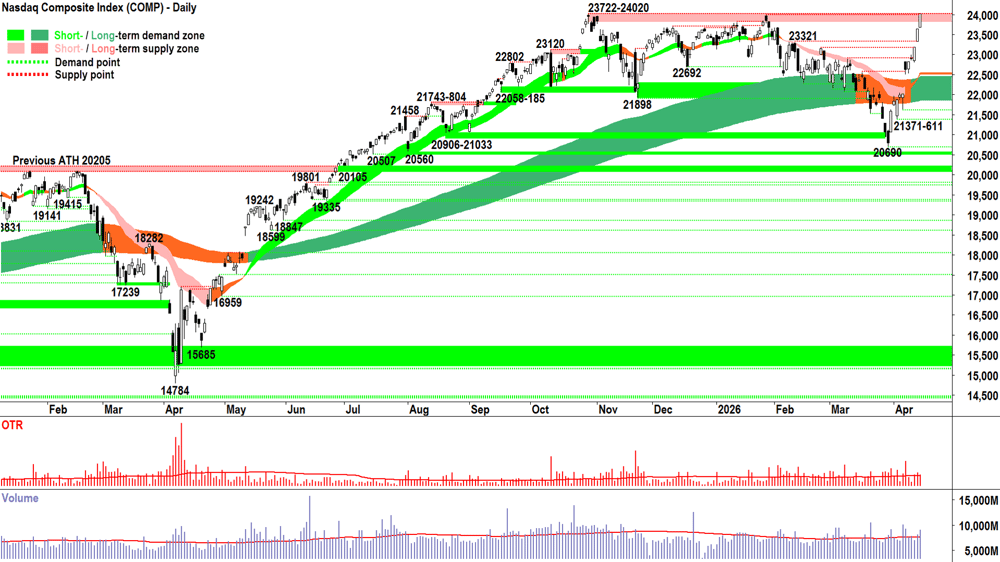
Nasdaq Composite Index
Analysis
Ladies and gentlemen. Long suffering readers of Chartwatch. The Nasdaq Composite just made a new all-time high last night. 🎺
Middle East conflict aside. SaaSpocalypse aside. At last night's high of 24026 — it had never been better (it was also an all-time high close at 24016).
I could waffle on about how many points in how many days… what a sharp reversal in both price and sentiment it is… but I’d be wasting the electrons firing off the pixels on your screen… because nothing I think, say, or do, matters with regards to those candles — or any other candle — that appears anywhere!
Whether I believed this scenario was possible a few weeks ago / whether I believe it’s rational or justified right now / or whether I believe in the Tooth Fairy, Santa Claus or the Easter Bunny!
It won’t make a lick of difference to the outcome.
"Nasdaq about faces from near-oblivion and stacks on 3,000-odd points / +16% in just 11 sessions to print an all-time high"? 🤯
It just is.
The only thing we know for sure, is that for those 11 candles: D > S = P ⬆️
What's our job today as we sit down to look at the charts today? That's easy: Analyse. Accept. Act. 🫡
Now, should D subsequently ⬇️
Or should S subsequently ⬆️
Then P will ⬇️
Guess what our job will be at that point? That's easy: Analyse. Accept. Act. 🫡
So, to show that all this guff ain't lip service… Step 1: Analyse:
ST trend ribbon ⬆️ + price is above the ST trend ribbon but no confirmation yet that the short term trend ribbon is acting as a zone of dynamic supply ✅*
LT trend ribbon ⬆️ price is below the ST trend ribbon but no confirmation yet that the short term trend ribbon is acting as a zone of dynamic supply ✅*
Price action = rising peaks and rising troughs, motive phases (up, moving) substantially larger than the stagnation / pullback phases = demand reinforcement and supply removal = FOMO + HOFU + BTD ✅
Candles are predominantly demand-side in nature (i.e., white-bodied and or downward pointing shadows = pervasive programmed buy orders dominant) = FOMO + HOFU + BTD ✅
Step 2: Determine the MOTN outcome from A1 — then ACCEPT IT!
✅*✅*✅✅
Why those two * next to the trend ribbon ticks? 🤔
It's because the price action ripped higher so quickly — it just hasn't had a chance to create a trough above the trend ribbons yet. As I've said in the webinars many times: it's so important after a fledgling rally to get a "supply-side challenge vs demand-side response" test. You might have heard me refer to this as a "dink".
A dink in a new uptrend tells us:
How much ammunition the supply side still has...
How strong the demand side has grown, and their ability to soak up any latent supply in the system, then their motivation to demand more...
The shallower the dink, the less effectual the supply side has grown, and the more influential the demand side has become.
This move on the Comp has gone from "threat of bear market" to "notching an all-time high" so quickly, that perhaps it's left some of my preferred technical signals behind! 🚀
Still, one must agree from the analysis that the MOTN here is 📈
Step 3: How do the first two A’s dictate my risk management / capital allocation? Well, that's the "View" part below!
View
2/3RP (RP = Risk Position — it reflects my personal allowable capital allocation limit for my investments in US stocks. So 1/2RP is 50%, 2/3RP is 67% and FRP is 100% 🪣).
Gimme a dink before I decide upon moving to FRP. There must be some supply out there... surely? 🤷 Let me see how much is banging about... and how the demand side responds to it. If the dink goes well, then I'd be remiss not to return to FRP. OMG — what a ride! 🎢
Key levels
Due to last night's candle demonstrating the consumption of the 23722-24020 supply zone, there are no other key supply zones to contend with.
The short-term trend ribbon (presently 22498-22534) is now the key zone of demand. If the price closes back below this range, the supply-side is very likely back in control of the Comp's price.
S&P/ASX 200 (XJO)
%20chart_16%20Apr.png)
Analysis
We may have led the recovery in the early stages, but we’ve lagged big-time over the last three trading sessions. Why? 🤔
Old Tin Pot, remember? 🤦
Remind me of one time where ALL of our sectors rose strongly at once? I.e., when the big funds didn’t play games and rotate from high P/E / long duration into value & resources… Or back the other way?
They borrow from Peter to pay Paul. Today, Paul was forced to cough up, and Peter got some back. Basically, what tech, real estate, and consumer discretionary gained, financials and resources gave up.
Net result: a bit down (because despite the huge percentage gains in the first group, the second group is far bigger in terms of index representation).
Bottom line… The Comp notched a new all-time and closing high… And we’re left waiting in line at the corner deli with Nollsie.
The Comp made a new high... it just isn't fair! 😭
I have a nagging suspicion the question will be: We didn’t go up with them… So when they inevitably pullback… Does that mean we won’t go down with them either?
You know I don’t do predictions, but: Old Tin Pot, remember? 🤦
Anyways, let’s just do the analysis and get to the bit at the end where there won’t be any change to RP! 😉
ST trend ribbon ⬆️ + price is above the ST trend ribbon + the short term trend ribbon is acting as a zone of dynamic supply ✅
LT trend ribbon ⬆️ price is below the ST trend ribbon + the short term trend ribbon is acting as a zone of dynamic supply ✅
Price action = rising peaks and rising troughs, motive phases substantially larger than the stagnation / pullback phases = demand reinforcement and supply removal = FOMO + HOFU + BTD ✅
Candles are predominantly demand-side in nature (apart from the last three — a bit disappointing with their upward pointing shadows = STR) = FOMO + HOFU + BTD ✅/⚖️
View
Still not enough here for me to budge from my current 1/2RP. But, given the broader techincals are very constructive, it would only take one strong demand side candle for me to commit to a move to 2/3RP 🪣 (i.e., my personal allowable capital allocation limit for my investments in Australian stocks will increase from the present 50% to 67%).
Key levels
9201, the all time high, is the key point of supply. Below it there likely remains a degree of trepidation among market participants.
The short-term trend ribbon (presently 8775-8788) is now the key zone of demand. If the price closes back below this range, the supply-side is very likely back in control of the OTP's price.
(Glossary of acronyms! MOTN: More Often Than Not | FOMO: Fear Of Missing Out | HOFU: Holding On For Upside | BTD: Buy The Dip | STR: Sell The Rally | RP: Risk Position)
ChartWatch *LIVE* Webinar
ChartWatch *LIVE* Webinars – WEEKLY Wednesday's @ 12pm AEDT
Learn more about technical analysis and trend following through real case studies on ASX stocks. Australia's premier technical analyst, Carl Capolingua, shares his unique insights on stocks as requested by viewers. Ask about a company in your portfolio or anything related to trading and investing and get Carl's expert opinion.
Places are limited so >REGISTER NOW!<
Economy
Today
AUS March employment data
Employment change: +17,900 vs +19,100 forecast and +49,700 in February (revised up from 48,900)
Unemployment rate: 4.3% vs 4.3% forecast and 4.3% in February
CHN March "Data Dump"
New Home Prices: -0.21% vs -0.28% in February
Fixed Asset Investment: +1.7% ytd/y vs +2.0% ytd/y forecast and +1.8% ytd/y in February
GDP: +5.0% p.a. in March quarter vs +4.8% p.a. forecast and +4.5% p.a. in the December quarter
Industrial Production: +5.7% p.a. vs +5.3% p.a. forecast and +6.3% p.a. in February
Retail Sales: +1.7% p.a. vs +2.5% p.a. forecast and +2.8% p.a. in February
Unemployment Rate: 5.4% vs 5.2% forecast and 5.3% in February
Later this week
Friday
No major economic data scheduled for release on this day
Latest News
Interesting Movers
Trading higher
+12.5% Life360 (360) – No news, general strength across the broader Information Technology sector today.
+12.4% Wisetech Global (WTC) – No news, general strength across the broader Information Technology sector today.
+12.2% Echoiq (EIQ) – No news, general strength across the broader Information Technology sector today, rise is consistent with prevailing short and long term uptrends, a regular in ChartWatch ASX Scans Uptrends list 🔎📈
+11.4% Zip (ZIP) – No news, general strength across the broader Information Technology sector today.
+10.3% Resolution Minerals (RML) – No news, general strength across the broader Critical Minerals sector today.
+10.3% Ora Banda Mining (OBM) – March 2026 Quarterly Activities Report.
+9.7% Core Lithium (CXO) – No news, general strength across the broader Lithium sector today, rise is consistent with prevailing short and long term uptrends, a regular in ChartWatch ASX Scans Uptrends list 🔎📈
+9.6% Nuix (NXL) – No news, general strength across the broader Information Technology sector today.
+9.2% Temple & Webster (TPW) – No news, general strength across the broader Consumer Discretionary sector today.
+9.0% Xero (XRO) – Change in substantial holding (Australian Super 8.1% from 7.1%), general strength across the broader Information Technology sector today.
+8.9% Liontown (LTR) – No news, general strength across the broader Lithium sector today, rise is consistent with prevailing short and long term uptrends, a regular in ChartWatch ASX Scans Uptrends list 🔎📈
+8.3% Pro Medicus (PME) – No news, general strength across the broader Information Technology sector today.
+8.2% Appen (APX) – No news, general strength across the broader Information Technology sector today.
+7.8% Megaport (MP1) – No news, general strength across the broader Information Technology sector today.
+7.1% Siteminder (SDR) – No news, general strength across the broader Information Technology sector today.
+7.1% Seek (SEK) – Becoming a substantial holder (Perpetual +5.1%), general strength across the broader Information Technology sector today.
+7.0% HMC Capital (HMC) – No news, general strength across the broader Real Estate sector today.
+6.8% Car (CAR) – No news, general strength across the broader Information Technology sector today.
+6.5% Wildcat Resources (WC8) – Continued positive response to 15-Apr Quarterly Activities/Appendix 5B Cash Flow Report, general strength across the broader Lithium sector today.
+6.1% Technology One (TNE) – No news, general strength across the broader Information Technology sector today.
+6.0% REA (REA) – No news, general strength across the broader Information Technology sector today.
+5.9% PLS Group (PLS) – PLS prices US$600M Senior Unsecured Notes Offering, general strength across the broader Lithium sector today, rise is consistent with prevailing short and long term uptrends, a regular in ChartWatch ASX Scans Uptrends list 🔎📈
+4.5% Boss Energy (BOE) – No news, general strength across the broader Uranium sector today, rebounded after yesterday's sharp sell-off due to Honeymoon Update FY26 Production.
Trading lower
-35.1% 29Metals (29M) – Xantho Extended Update, fall is consistent with prevailing short term downtrend and long term trend is transitioning from up to down 🔎📉
-5.3% Reece (REH) – No news, general weakness across the broader Materials sector today, fall is consistent with prevailing short term downtrend and long term trend is transitioning from up to down 🔎📉
-5.1% Newmont (NEM) – No news, general weakness across the broader Precious Metals sector today.
-4.4% DPM Metals (DPM) – No news, general weakness across the broader Precious Metals sector today.
-4.3% James Hardie Industries (JHX) – No news, general weakness across the broader Materials sector today, fall is consistent with prevailing short and long term downtrends 🔎📉
-4.2% African Gold (A1G) – No news, general weakness across the broader Precious Metals sector today.
-4.2% Evolution Mining (EVN) – No news, general weakness across the broader Precious Metals sector today.
-4.0% Greatland Resources (GGP) – No news, general weakness across the broader Precious Metals sector today.
-3.7% Ansell (ANN) – Chief Financial Officer Resignation, fall is consistent with prevailing short and long term downtrends, a regular in ChartWatch ASX Scans Downtrends list 🔎📉
-2.8% Commonwealth Bank of Australia (CBA) – No news, general weakness across the broader Financials sector today.
Broker Moves
29Metals (29M)
Retained at sell at Canaccord Genuity; Price Target: $0.25 from $0.35
Auckland International Airport (AIA)
Retained at neutral at Citi; Price Target: $7.26
Ama Group (AMA)
Retained at buy at Bell Potter; Price Target: $1.10 from $1.20
Amcor Plc (AMC)
Retained at outperform at Macquarie; Price Target: $86.50
ANZ Group Holdings (ANZ)
Retained at overweight at Morgan Stanley; Price Target: $37.00 from $37.80
ARB Corporation (ARB)
Initiated at neutral at Jarden; Price Target: $20.70
Bega Cheese (BGA)
Upgraded to outperform from hold at CLSA; Price Target: $6.60 from $5.95
Boss Energy (BOE)
Retained at buy at Argonaut Securities; Price Target: $2.30 from $2.50
Retained at underweight at Barrenjoey; Price Target: $1.50 from $1.70
Retained at buy at Bell Potter; Price Target: $1.80 from $1.95
Retained at hold at Jefferies; Price Target: $1.60
Retained at underweight at JPMorgan; Price Target: $1.20
Upgraded to hold from sell at Ord Minnett; Price Target: $1.50
Retained at buy at Shaw and Partners; Price Target: $2.96 from $3.15
Commonwealth Bank of Australia (CBA)
Retained at underweight at Morgan Stanley; Price Target: $131.00 from $131.20
Cuscal (CCL)
Retained at buy at Bell Potter; Price Target: $5.80 from $5.10
Cochlear (COH)
Initiated at neutral at JPMorgan; Price Target: $187.90
Computershare (CPU)
Retained at neutral at UBS; Price Target: $32.75 from $35.30
CSL (CSL)
Retained at buy at UBS; Price Target: $205.00 from $235.00
Cygnus Metals (CY5)
Retained at speculative buy at Canaccord Genuity; Price Target: $0.35
Duratec (DUR)
Retained at buy at Argonaut Securities; Price Target: $3.10 from $2.90
Retained at buy at Euroz Hartleys; Price Target: $3.09 from $2.57
Retained at buy at Moelis Australia; Price Target: $3.08 from $2.52
Retained at accumulate at Ord Minnett; Price Target: $2.95
Retained at buy at Shaw and Partners; Price Target: $3.10 from $3.00
Evolution Mining (EVN)
Upgraded to buy from hold at Argonaut Securities; Price Target: $15.50 from $14.50
Retained at overweight at Barrenjoey; Price Target: $17.00
Retained at buy at Bell Potter; Price Target: $16.45 from $16.60
Retained at buy at Canaccord Genuity; Price Target: $15.75 from $15.55
Retained at underperform at Jefferies; Price Target: $11.00
Retained at neutral at Macquarie; Price Target: $14.00
Upgraded to accumulate from hold at Morgans; Price Target: $16.10 from $17.70
Retained at accumulate at Ord Minnett; Price Target: $13.70
Retained at sector perform at RBC Capital Markets; Price Target: $14.60 from $14.50
Retained at neutral at UBS; Price Target: $13.20
Fortescue (FMG)
Retained at outperform at Macquarie; Price Target: $23.00 from $22.00
Fisher & Paykel Healthcare Corporation (FPH)
Initiated at overweight at JPMorgan; Price Target: $37.50
Helloworld Travel (HLO)
Retained at buy at Shaw and Partners; Price Target: $2.80
Lifestyle Communities (LIC)
Retained at neutral at UBS; Price Target: $5.80
Lovisa Holdings (LOV)
Retained at buy at UBS; Price Target: $26.00
Macquarie Group (MQG)
Retained at overweight at Morgan Stanley; Price Target: $270.00
National Australia Bank (NAB)
Retained at underweight at Morgan Stanley; Price Target: $39.30 from $39.80
Nufarm (NUF)
Retained at buy at Bell Potter; Price Target: $3.60
Retained at neutral at Macquarie; Price Target: $2.70 from $2.77
Retained at buy at Morgans; Price Target: $4.05 from $3.20
Retained at sector perform at RBC Capital Markets; Price Target: $3.40 from $3.10
Retained at neutral at UBS; Price Target: $2.80 from $4.50
Ora Banda Mining (OBM)
Retained at buy at Canaccord Genuity; Price Target: $1.75
Pro Medicus (PME)
Initiated at overweight at JPMorgan; Price Target: $205.50
Qantas Airways (QAN)
Retained at buy at Citi; Price Target: $10.40 from $12.10
Retained at buy at UBS; Price Target: $11.25 from $11.60
Ramsay Health Care (RHC)
Initiated at overweight at JPMorgan; Price Target: $45.90
Rio Tinto (RIO)
Retained at outperform at Macquarie; Price Target: $183.00 from $168.00
ResMed Inc. (RMD)
Initiated at overweight at JPMorgan; Price Target: $37.60
SiteMinder (SDR)
Retained at buy at Citi; Price Target: $6.60
Sonic Healthcare (SHL)
Initiated at underweight at JPMorgan; Price Target: $18.00
Viva Energy Group (VEA)
Retained at outperform at Macquarie; Price Target: $3.50
Virgin Australia Holdings (VGN)
Retained at outperform at CLSA; Price Target: $2.90 from $3.54
Retained at buy at Goldman Sachs; Price Target: $3.80 from $3.90
Retained at buy at Jarden; Price Target: $3.80 from $4.00
Retained at buy at Ord Minnett; Price Target: $3.80 from $4.00
Retained at buy at UBS; Price Target: $4.10 from $4.25
Westpac Banking Corporation (WBC)
Retained at neutral at UBS; Price Target: $40.00
Wildcat Resources (WC8)
Retained at buy at Shaw and Partners; Price Target: $1.20
Xero (XRO)
Retained at buy at UBS; Price Target: $127.00 from $174.00
Scans
Top Gainers
Code | Company | Last | % Chg |
|---|---|---|---|
| BSR | Bison Resources Ltd | $0.65 | +225.00% |
| HFR | Highfield Resources Ltd | $0.043 | +65.39% |
| DXN | DXN Ltd | $0.021 | +31.25% |
| EPX | EPX Ltd | $0.28 | +27.27% |
| IVZ | Invictus Energy Ltd | $0.082 | +26.15% |
Top Fallers
Code | Company | Last | % Chg |
|---|---|---|---|
| 29M | 29METALS Ltd | $0.24 | -35.14% |
| DGL | DGL Group Ltd | $0.395 | -26.17% |
| TAT | Tartana Minerals Ltd | $0.02 | -20.00% |
| JAL | Jameson Resources Ltd | $0.068 | -15.00% |
| RRE | Right Resources Ltd | $0.12 | -14.29% |
52 Week Highs
Code | Company | Last | % Chg |
|---|---|---|---|
| BSR | Bison Resources Ltd | $0.65 | +225.00% |
| EIQ | Echoiq Ltd | $1.15 | +12.20% |
| YUG | Yugo Metals Ltd | $0.083 | +12.16% |
| SPL | Starpharma Holdings Ltd | $0.675 | +9.76% |
| BRK | Brookside Energy Ltd | $0.60 | +9.09% |
52 Week Lows
Code | Company | Last | % Chg |
|---|---|---|---|
| TAT | Tartana Minerals Ltd | $0.02 | -20.00% |
| KYP | Kinatico Ltd | $0.135 | -10.00% |
| INV | Investsmart Group Ltd | $0.083 | -8.79% |
| ATP | Atlas Pearls Ltd | $0.096 | -8.57% |
| CCX | City Chic Collective Ltd | $0.063 | -7.35% |
Near Highs
Code | Company | Last | % Chg |
|---|---|---|---|
| IHD | iShares S&P/ASX DIV Opportunities Esg Screened ETF | $17.28 | +0.06% |
| OBL | Omni Bridgeway Ltd | $1.815 | +1.95% |
| MVB | Vaneck Australian Banks ETF | $46.11 | -0.37% |
| MI6 | Minerals 260 Ltd | $0.763 | -2.55% |
| HGBL | Betashares Global Shares Currency Hedged ETF | $77.56 | -0.56% |
Relative Strength Index (RSI) Oversold
Code | Company | Last | % Chg |
|---|---|---|---|
| LDX | Lumos Diagnostics Holdings Ltd | $0.165 | -2.86% |
| HVN | Harvey Norman Holdings Ltd | $4.68 | -0.85% |
| EVO | Embark Early Education Ltd | $0.405 | -2.44% |
| EML | EML Payments Ltd | $0.415 | -35.65% |
| PXA | Pexa Group Ltd | $11.70 | -0.85% |
