Aussie consumer confidence crashed but history says it's time to shop for retail stocks
Consumer confidence just posted its worst monthly drop since COVID. History suggests it's a good time to buy retail stocks.

Source: Shutterstock
Mentioned
KEY POINTS
- The Westpac-Melbourne Institute Consumer Sentiment Index fell 12.5% to 80.1 in April, its largest monthly decline since the onset of COVID
- When sentiment hits the lowest quintile, the S&P/ASX 200 Discretionary Index has historically returned an average of 15% over the following 12 months
- The short-term remains volatile and unpredictable, but with valuations resetting and pessimism at extremes, the sector is worth watching closely
Australian consumer confidence was absolutely crushed in April, suffering from a double whammy of surging fuel prices and a 25 bp rate hike.
The Westpac-Melbourne Institute Consumer Sentiment Index fell 12.5% to 80.1 in April from 91.6 in March, resulting in the largest monthly decline since the onset of the pandemic.
But the stock market is not the real economy, and equities often act as a forward-looking pricing mechanism that bottoms well before economic conditions (just look at the S&P 500 and Nasdaq closing at all-time highs on Wednesday). With that in mind, could now be an opportune time to buy some retail stocks that have sold off aggressively in recent months?
April's consumer sentiment highlights
The April consumer confidence was extremely downbeat, with 90 of its 100 sub-components recording declines. Some of the key highlights include:
Average pump prices hit $2.40/litre in the first week of April, up 37 cents from the March survey and 77 cents from early February, the biggest rise in the survey's history
The 'family finances vs a year ago' sub-index plunged 16.7% to 66.8, an extremely weak read approaching the lows seen during the 2022-24 inflation fight
The 'time to buy a major item' sub-index dropped 15% to 83.3, but still slightly above the very weak 75-80 range seen in 2022-24
Unemployment expectations have deteriorated sharply, with the Unemployment Expectations Index jumping 9.7% to 147.8, the worst reading since August 2020, with construction (+22% to 152) and hospitality (+19% to 149) the most affected sectors
Mortgage rate expectations have returned to cycle highs, with over 80% of consumers expecting variable rates to rise over the next 12 months
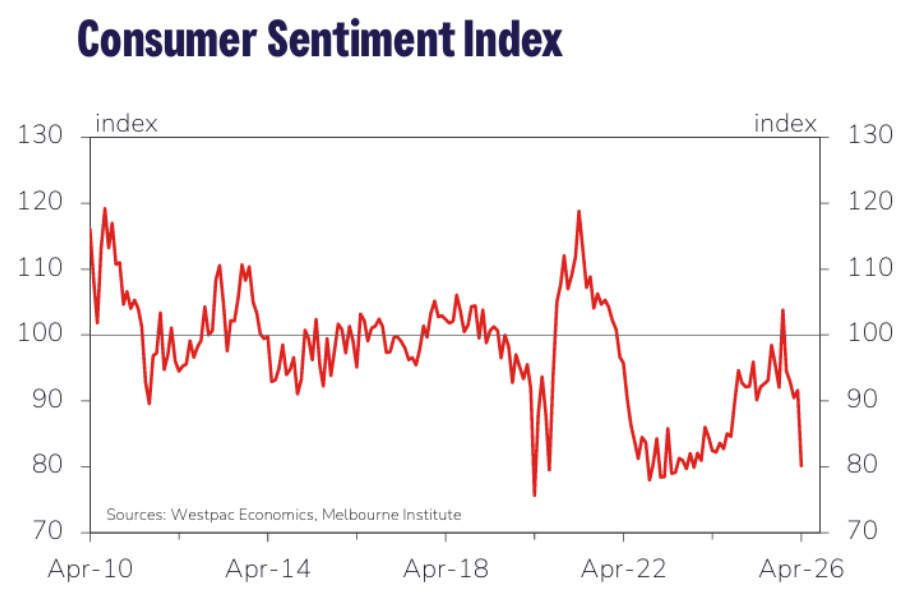
Source: Westpac, Melbourne Institute
Be greedy when consumers are fearful?
Extreme sentiment and positioning readings, such as periods of extreme investor pessimism and low institutional equity exposure, often present compelling buying opportunities – but can we come to the same conclusion with retail stocks (S&P/ASX 200 Discretionary Index) and consumer sentiment?
At a glance, weakness in the Discretionary sector coincides with a sharp decline in consumer sentiment, and such low readings historically set up strong forward returns, though obviously not a guarantee.
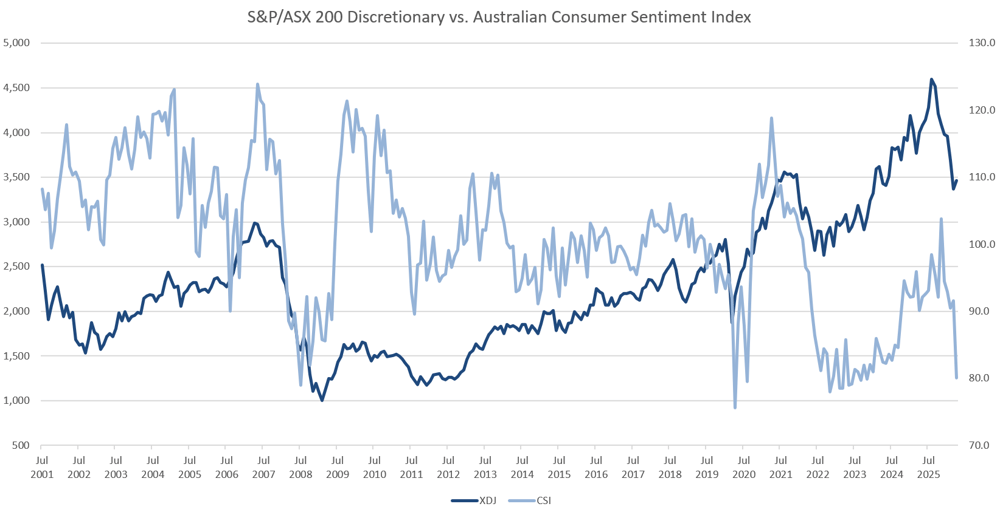
S&P/ASX 200 Discretionary Index vs. Westpac-Melbourne Institute Consumer Confidence Index (Source: Melbourne Institute, Market Index)
Statistically speaking, consumer sentiment has almost no predictive power over discretionary stock returns. The R², which measures how much of the movement in one variable is explained by another, on a scale of 0% to 100%, comes in at just 0.5%. That means 99.5% of the movement in discretionary stocks is driven by other factors entirely.
This holds across the entire timeline, including pre-GFC, the expansion years and post-pandemic – sentiment never cracks even 1% of explanatory power.
Where sentiment does earn its keep is as a contrarian indicator at extreme levels. When sentiment hits the lowest quintile (76-92) has historically been followed by an average 12-month forward return of 15%. Meanwhile, when sentiment hits the highest quintile (111-124), 12-month forward returns sit at negative 6%.
CSI Quintile | CSI Range | Avg 1m Fwd | Avg 3m Fwd | Avg 6m Fwd | Avg 12m Fwd |
|---|---|---|---|---|---|
Lowest 20% | 76 — 92 | 0.3% | 2.4% | 5.5% | 15.0% |
Q2 | 92 — 99 | -0.1% | 0.0% | 2.9% | 9.8% |
Q3 | 99 — 104 | 1.2% | 2.0% | 3.0% | 5.9% |
Q4 | 104 — 111 | -0.8% | 0.5% | 0.5% | 1.6% |
Highest 20% | 111 — 124 | 0.7% | -0.2% | -1.2% | -6.0% |
Source: Melbourne Institute, Market Index
Taking a closer look
While consumer confidence is not statistically significant – we can establish that extreme levels of pessimism typically result in strong forward returns for discretionary stocks.
The tables below observe notable troughs for the Consumer Sentiment Index and forward returns for the S&P/ASX 200 Discretionary Index.
Trough Date | CSI | XDJ | 1-Month | 3-Months | 6-Months | 12-Months | Catalyst |
|---|---|---|---|---|---|---|---|
1/10/2001 | 99.5 | 2062 | 6.5% | 2.0% | -6.5% | -18.3% | Post-9/11 and tech wreck |
1/03/2003 | 99.9 | 1632 | 5.3% | 5.4% | 15.9% | 20.9% | Iraq war / tech bust trough |
1/10/2005 | 98.2 | 2220 | 0.9% | -0.4% | 7.1% | 16.5% | Rate hike cycle fears |
1/08/2006 | 90.0 | 2359 | 3.1% | 15.0% | 17.9% | 15.8% | Mid-cycle slowdown |
1/07/2008 | 79.0 | 1571 | 8.9% | -17.5% | -30.6% | -8.8% | GFC - early crisis |
1/08/2011 | 89.6 | 1225 | -3.5% | -0.4% | 5.2% | 3.0% | European debt crisis |
1/04/2012 | 94.5 | 1300 | -4.0% | -2.8% | -2.2% | 25.9% | Post-GFC fiscal fears |
1/05/2013 | 97.6 | 1591 | -1.1% | 9.4% | 13.2% | 14.3% | Taper tantrum |
1/05/2014 | 92.9 | 1818 | -2.0% | 1.8% | -1.1% | 10.5% | Budget austerity |
1/12/2014 | 91.1 | 1753 | 6.2% | 12.7% | 1.7% | 13.8% | Commodity crash / AUD |
1/07/2015 | 92.2 | 1897 | -4.8% | -1.7% | 3.0% | 18.7% | China slowdown fears |
1/04/2016 | 95.1 | 1955 | 5.8% | 15.1% | 5.9% | 12.5% | Brexit / growth fears |
1/12/2016 | 97.3 | 2151 | -4.3% | 1.0% | 2.8% | 9.6% | Trump election uncertainty |
1/08/2017 | 95.5 | 2146 | -0.9% | 6.0% | 7.1% | 20.3% | Wage stagnation / housing |
1/10/2019 | 92.8 | 2625 | 4.7% | 6.8% | -17.3% | 1.3% | Pre-COVID slowdown |
1/04/2020 | 75.6 | 2170 | 6.5% | 15.2% | 22.5% | 48.1% | COVID pandemic |
1/11/2022 | 78.0 | 2937 | -7.0% | 0.8% | -1.6% | 3.8% | Rate hiking / cost of living |
1/04/2025 | 90.1 | 3997 | 2.1% | 7.0% | 5.3% | -13.4% | Trade war / tariff shock |
Source: Author's own calculations
And here are some aggregate numbers for the above.
1-Month | 3-Months | 6-Months | 12-Months | |
|---|---|---|---|---|
Average | 3.8% | 7.8% | 5.1% | 15.7% |
Median | 1.2% | 4.2% | 3.0% | 12.5% |
% Positive | 50% | 72% | 67% | 83% |
Source: Author's own calculations
While deep troughs produce strong forward 12-month returns, the short term is rather volatile and positive only 50% of the time. There are also plenty of traps, such as July 2008, when stocks fell for another seven months.
The bottom line
With the S&P/ASX 200 Discretionary Index down 25% from its August 2025 peak, valuations have experienced a hard reset. A name like JB Hi-Fi has seen its multiple compress from a peak ~27x to a more reasonable ~17x, which is nearing its historical average around the mid teens.
April's consumer sentiment print of 80.1 places us firmly in the lowest quintile historically, which is the same territory that has preceded average 12-month forward returns of 15% for discretionary stocks.
That said, the downside also has plenty of ammunition, including an ongoing fuel crisis and higher consumer prices, the risk of a prolonged Middle East conflict and further RBA hikes on the horizon.
But markets rarely wait for the all-clear. JB Hi-Fi serves as a clear example, where the stock began rallying in late 2023, well before the fundamentals improved. The company reported a 20% fall in net profit at its 1H24 result on 12 February 2024, but the stock rallied 7.1% as the numbers were far less than feared. So it's much less about face value outcomes and more about what's already priced in.
With sentiment crushed and valuations normalising, the discretionary sector is certainly one to watch.
