News | Market Wraps
Evening Wrap: ASX 200 sags as Middle East, inflation fears simmer, BHP and RIO tumble on China iron ore spat
The S&P/ASX 200 closed 89.3 points lower, down 1.00%.

Mentioned
The S&P/ASX 200 closed 89.3 points lower, down 1.00%.
The ASX 200 fell sharply as escalating tensions in the Middle East and surging oil prices rattled global markets, fuelling concerns about higher inflation and tighter monetary policy. The risk-off tone capped a volatile week in which investors rotated aggressively between sectors.
Be sure to click/scroll through for the usual reporting of the major sector and stock-specific moves, the broker responses to them, as well as all the key economic data in tonight's Evening Wrap.
Also, I have detailed technical analysis on the Nasdaq Composite and the S&P/ASX 200 in today's ChartWatch.
Let's dive in!
Today in Review
Fri 06 Mar 26, 4:55pm (AEST)
Name | Value | % Chg |
|---|---|---|
Major Indices | ||
| ASX 200 | 8,851.0 | -1.00% |
| All Ords | 9,085.1 | -0.87% |
| Small Ords | 3,594.8 | -1.26% |
| All Tech | 2,898.9 | +3.87% |
| Emerging Companies | 3,212.0 | -0.85% |
Currency | ||
| AUD/USD | 0.7033 | +0.37% |
US Futures | ||
| S&P 500 | 6,850.25 | +0.22% |
| Dow Jones | 48,100.0 | +0.24% |
| Nasdaq | 25,126.75 | +0.31% |
Name | Value | % Chg |
|---|---|---|
Sector | ||
| Information Technology | 1,840.6 | +4.57% |
| Communication Services | 1,731.9 | +1.73% |
| Consumer Discretionary | 3,538.5 | +0.65% |
| Health Care | 29,537.0 | +0.14% |
| Utilities | 10,001.2 | +0.14% |
| Energy | 10,303.8 | +0.03% |
| Financials | 9,632.5 | -0.23% |
| Consumer Staples | 12,582.1 | -0.27% |
| Industrials | 8,358.1 | -0.37% |
| Real Estate | 3,524.3 | -0.68% |
| Materials | 23,182.9 | -4.10% |
Markets
%20intraday%20chart_6%20Mar.png)
ASX 200 Session Chart
The S&P/ASX 200 (XJO) finished 89.3 points lower at 8,851.0, 1.0% from its session high and a not-a-complete-disaster 0.45% from its low. Can I call the market breadth a “not-a-complete-disaster” as well? In the broader-based S&P/ASX 300 (XKO) advancers lagged decliners by 115 to 164.
For the week, the XJO finished down 348 points or 3.8% lower — that’s 4% from its intraweek record high of 9201 and just 0.45% from its intraweek low. 😭
Information Technology (XIJ) (+4.6%) led the market as beaten-down growth stocks rebounded despite the broader sell-off. Wisetech Global (WTC) (+10.8%) and Xero (XRO) (+4.5%) were standout performers.
Health Care (XHJ) (+0.1%) also edged higher as defensive growth names found support. Telix Pharmaceuticals (TLX) (+6.5%) and Pro Medicus (PME) (+9.2%) were among the notable gainers.
Gold Sub-Index (XGD) (-5.9%) was the worst-performing segment as precious metals stocks were hit by profit taking after their recent rally. Northern Star Resources (NST) (-8.1%), Genesis Minerals (GMD) (-7.2%) and Evolution Mining (EVN) (-6.0%) led the declines.
Resources (XJR) (-3.6%) also slumped as iron ore majors were dumped amid renewed tensions with Chinese buyers. BHP Group (BHP) (-4.2%) and Rio Tinto (RIO) (-3.6%) weighed heavily on the sector. China’s state-backed buyer reportedly urged traders to halt purchases of new BHP cargoes after shipments were found to breach existing procurement restrictions, escalating a standoff over supply contracts.
In stock specific news:
Magellan Financial Group (MFG) (+9.3%) — surged after the Lowy family disclosed a strategic stake following the firm’s merger announcement with Barrenjoey.
Deep Yellow (DYL) (-11.8%) — fell after reporting a wider half-year loss.
SkyCity Entertainment (SKC) (-4.2%) — slipped as the company faces potential class action proceedings over its online casino operations.
In commodities, gold and silver were higher in Asian trade, with gold up 1.3% to around US$5,143/oz and silver rising 3.1% to US$84.69/oz.
Lithium prices were modestly higher in China trade, with spodumene concentrate up 2.1% to 158,800 CNY/mt while Australian spodumene held steady near US$2,000/t. IGO (IGO) (-1.8%) and PLS Group (PLS) (-1.0%) paced modest sector losses.
Continued volatility hit uranium stocks, they were mostly sharply lower today, with Deep Yellow (DYL) (-11.8%) and Boss Energy (BOE) (-6.9%) bearing the brunt of the selling.
Fund flows: The first 10% is the harshest! 🤕
Sector rotations often behave like a stretched elastic band. The further money flows push markets in one direction — piling into the same “winning” themes — the greater the tension that builds beneath the surface. When that positioning becomes too crowded, it only takes a small shift in sentiment or a bout of profit-taking to trigger a violent snap back the other way.
This feels like the defining theme of the week — one in which the local share market had plenty of external shocks to deal with. For much of the past eight months, traders gravitated toward Resources and precious metals stocks, often at the expense of Technology, Consumer Discretionary, Healthcare and Communication Services.
Both trades became crowded — long the former and short the latter — and capital has now sharply reversed course. That’s notable because base and precious metals prices remain close to recent cyclical highs, while nothing material has fundamentally changed for the previously beaten-down growth sectors either.
Funds that were early to the “Big Rotation” of the second half of 2025 — i.e., the shift away from high-P/E growth stocks and into resources and value names — view today’s prices very differently from us. Their average entry points are far more favourable on both the long and short sides of the trade.
A few percent pullback in resources stocks still leaves them sitting on substantial gains, making it logical to trim positions and redeploy some capital back into sectors that now look comparatively cheaper.
For investors who joined the trade much later, however, the experience can feel very different. When rotations unwind, the first ten percent often feels the harshest — particularly when yesterday’s leaders suddenly become today’s laggards. It’s a reminder that sector leadership is rarely permanent, and that crowded trades can reverse just as quickly as they formed!
Today's best blue chip gainers
Company | Last Price | Change $ | Change % | 1mo % | 1yr % |
|---|---|---|---|---|---|
Wisetech Global (WTC) | $52.72 | +$5.15 | +10.8% | +5.6% | -42.5% |
Pro Medicus (PME) | $132.70 | +$11.21 | +9.2% | -19.5% | -49.9% |
Telix Pharmaceuticals (TLX) | $10.75 | +$0.66 | +6.5% | +6.1% | -61.7% |
REA Group (REA) | $174.01 | +$8.11 | +4.9% | -4.6% | -32.2% |
Xero (XRO) | $87.63 | +$3.74 | +4.5% | +6.7% | -49.3% |
Block (XYZ) | $95.81 | +$4. | +4.4% | +17.6% | -0.2% |
Technology One (TNE) | $27.33 | +$1.03 | +3.9% | +18.7% | -6.6% |
Pinnacle Investment (PNI) | $16.07 | +$0.55 | +3.5% | -12.2% | -21.6% |
Car Group (CAR) | $26.62 | +$0.87 | +3.4% | +4.1% | -27.4% |
Seek (SEK) | $16.93 | +$0.55 | +3.4% | -13.8% | -30.2% |
Santos (STO) | $7.46 | +$0.14 | +1.9% | +6.7% | +21.7% |
Nextdc (NXT) | $13.69 | +$0.25 | +1.9% | +3.6% | -2.6% |
Sigma Healthcare (SIG) | $2.85 | +$0.05 | +1.8% | -9.8% | -2.4% |
Aristocrat Leisure (ALL) | $47.12 | +$0.77 | +1.7% | -9.8% | -34.8% |
Life360 (360) | $21.87 | +$0.33 | +1.5% | -15.5% | -1.6% |
The Lottery Corp. (TLC) | $5.43 | +$0.07 | +1.3% | +2.6% | +12.2% |
Ramsay Health Care (RHC) | $44.52 | +$0.52 | +1.2% | +23.6% | +29.8% |
Steadfast Group (SDF) | $4.35 | +$0.05 | +1.2% | -13.5% | -20.5% |
Telstra Group (TLS) | $5.24 | +$0.06 | +1.2% | +6.3% | +25.7% |
Woodside Energy Group (WDS) | $30.75 | +$0.3 | +1.0% | +18.7% | +33.8% |
Today's worst blue chip losers
Company | Last Price | Change $ | Change % | 1mo % | 1yr % |
|---|---|---|---|---|---|
Sandfire Resources (SFR) | $17.09 | -$1.81 | -9.6% | -9.6% | +51.8% |
Northern Star Resources (NST) | $26.98 | -$2.38 | -8.1% | -1.0% | +53.2% |
Genesis Minerals (GMD) | $6.73 | -$0.52 | -7.2% | -2.0% | +106.4% |
Evolution Mining (EVN) | $14.79 | -$0.94 | -6.0% | +1.7% | +127.5% |
Capricorn Metals (CMM) | $13.39 | -$0.85 | -6.0% | +0.2% | +67.2% |
Ramelius Resources (RMS) | $4.23 | -$0.22 | -4.9% | -4.7% | +53.3% |
BHP Group (BHP) | $52.81 | -$2.34 | -4.2% | +4.9% | +34.6% |
Amcor PLC (AMC) | $61.83 | -$2.39 | -3.7% | -11.2% | -21.7% |
Rio Tinto (RIO) | $158.67 | -$5.91 | -3.6% | +1.0% | +38.1% |
Lynas Rare Earths (LYC) | $18.33 | -$0.67 | -3.5% | +24.4% | +156.0% |
Perseus Mining (PRU) | $5.58 | -$0.2 | -3.5% | +1.3% | +78.8% |
Ampol (ALD) | $30.96 | -$1.1 | -3.4% | +6.0% | +25.5% |
Metcash (MTS) | $3.11 | -$0.1 | -3.1% | -6.3% | +0.6% |
Newmont Corp. (NEM) | $165.14 | -$4.54 | -2.7% | +1.4% | +138.5% |
Cochlear (COH) | $180.06 | -$4.94 | -2.7% | -30.4% | -34.6% |
Orica (ORI) | $23.09 | -$0.63 | -2.7% | -10.2% | +36.3% |
Downer EDI (DOW) | $7.88 | -$0.21 | -2.6% | -0.9% | +42.5% |
Mirvac Group (MGR) | $1.900 | -$0.05 | -2.6% | -5.0% | -10.4% |
Whitehaven Coal (WHC) | $8.48 | -$0.22 | -2.5% | -8.3% | +47.0% |
GPT Group (GPT) | $4.78 | -$0.12 | -2.4% | -8.4% | +4.1% |
ChartWatch
Nasdaq Composite Index
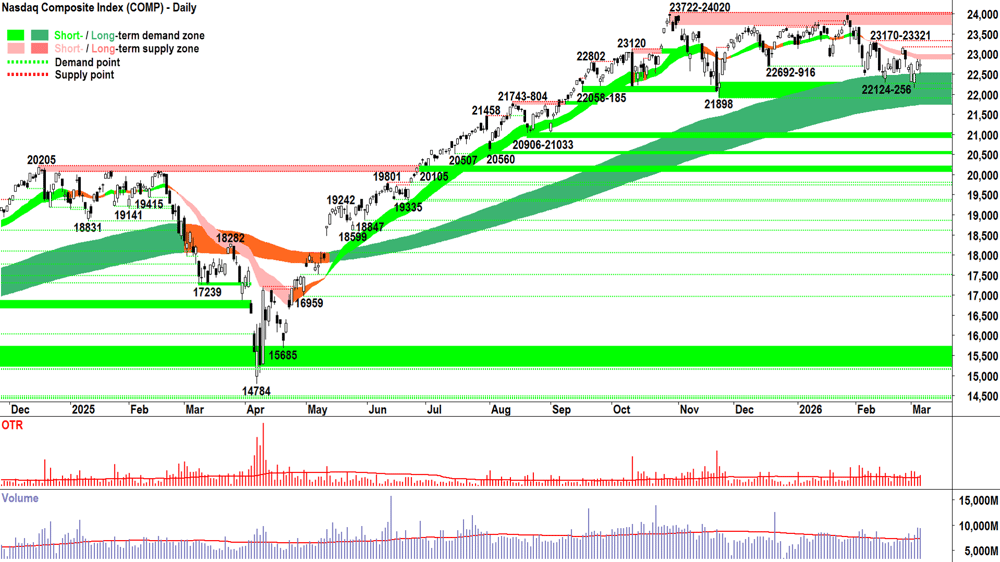
Analysis
11 out of the last 13 candles are white: ⬜⬜⬜⬜⬛⬜⬜⬛⬜⬜⬜⬜⬜
Consider that the close of the first white candle in the series was 22578.
Last night’s close was 22749.
That’s +0.75% in 13 candles.
The Compa traded a bit higher and a bit lower along the way...
= Painful stuff! 🤦
Whilst still delivering a white-bodied candle, the Comp’s performance on Thursday was hardly an emphatic demand-side controlled showing. A decent downward pointing shadow, granted, terminating where? Yep! Smack-bang on our imaginary best friend — the long term uptrend ribbon!
But also, a bit of an upward pointing shadow too… (Terminating where? At our other imaginary buddy — the short term downtrend ribbon!).
Up and downward pointing shadows is usually a good sign that the demand-and supply sides cannot agree… that each has a credible viewpoint — but neither can really hammer that viewpoint home in price.
Look at the volume on that last candle, too. A decent whack above average. The big funds are not only in disagreement, but they’re substantially active.
Q: What does Uncertainty + Size equal? 🧐
A: A tinderbox that could explode either way! 💥
And so, the pincer tightens its grip on the Comp’s price — with the short term downtrend ribbon impeding upward progress, and the long term uptrend ribbon preventing it falling off the cliff…
A resolution to this interminable indecision must come sooner or later… but probably sooner, I think you’ll agree!
Which way will it break? No idea. Can’t tell the future… and in my experience, these types of scenarios really are lineball. Flip a coin stuff 🪙!
But if you pushed me to make a call… hmmm… 11 out of 13 candles are white… 🤔
Either way, where it goes isn’t really that important if you’re positioned appropriately on the risk front — and on this point, I trust you are! 😉
View
1/2RP still feels valid with respect to my US portfolio risk limit (RP = Risk Position — it reflects my personal allowable capital allocation limit for my investments in US stocks. So 1/2RP is 50%, 2/3RP is 67% and FRP is 100% 🪣).
Key levels
22124-22256 is the critical zone of demand — a close below it implies the supply-side is in control of the Comp's short term price, and that the long term uptrend is likely under significant pressure = ⚠️. The short term downtrend ribbon (presently 22888-22993) is the nearest critical zone of point supply, and 23170-23321 is not far beyond that.
S&P/ASX 200 (XJO)
%20chart_6%20Mar.png)
Analysis
Monday = Record High 🏆
Friday = 4% correction 🤕
What a week!
It could have been worse today. That’s one small consolation for the week.
But even if at index level there’s a whiff of “not as bad as one might have thought”, when the trend follower drills into which sectors got belted this week — and equally damaging, which rallied — one finds that in both cases: two very reliable and lucrative trends reversed course.
This must happen! You can’t enjoy two of the most wonderfully consistent and massive trends in probably a generation — long to the teeth precious metals and resources versus short to the hilt tech & friends — and not expect them to unwind at some point.
Is that the end of resources strength / tech & friends weakness? Possibly… go look at the charts… I’ve taught you what both “-R after a big uptrend” and “+R after a big downtrend look like”. Rest assured, we’ll do plenty of that in Wednesday's webinar.
(If you’re not attending the webinars or watching the recordings afterwards, can I say without bias: they’re very, very good! 😉)
Anyways, it’s been that kind of a week… let’s do some analysis and take a well-earned break!
Dips and rips. That’s been the theme for the ASX 200 since 9116 back in October last year. The long term uptrend has held for most of that time, though, and it remains intact today — last dip notwithstanding.
I am prepared to give the ASX 200 the benefit of the doubt until:
A lower peak to 9201 forms
Short term trend ribbon (presently 8953-8992) demonstrates it’s behaving as a stubborn zone of dynamic supply (i.e., like with the Comp).
Close below 8675-8683 — which now coincides with the low of the long term uptrend ribbon (presently 8674-8787)
Monday really should manifest some decent excess demand to keep any hope alive that the short term uptrend remains intact = Long white-bodied candle and or long downward pointing shadow (i.e., confirming the long term uptrend as a strong zone of dynamic demand).
Anything less than that… and I suggest the doubts are going to creeeepppp in! Across the demand- and supply-sides alike! 🫣
View
I am FRP... Just! 🪣 (i.e., my personal allowable capital allocation limit for my investments in Australian stocks is 100%). As I said on Wednesday: "I will stop adding new portfolio risk. I will let existing portfolio risk roll off (i.e., as the price action and candles on individual holdings warrant specific -R’s)". I am this close 🤏 to cutting to 2/3RP.
Key levels
8675-8683 is the closest zone of demand (static), and beyond this, sits the long term uptrend ribbon (presently 8674-8787) (dynamic). A close below 8673 neutralises the long term uptrend. 9201 is the key point of supply, but so too now is the short term trend ribbon (presently 8953-8992). The ASX 200 must at least close back above 9006 to reclaim the previous short term uptrend.
ChartWatch *LIVE* Webinar
ChartWatch *LIVE* Webinars – WEEKLY Wednesday's @ 12pm AEDT
Learn more about technical analysis and trend following through real case studies on ASX stocks. Australia's premier technical analyst, Carl Capolingua, shares his unique insights on stocks as requested by viewers. Ask about a company in your portfolio or anything related to trading and investing and get Carl's expert opinion.
Places are limited so >REGISTER NOW!<
Economy
Today
There weren't any major economic data releases in our time zone today
Later this week
Saturday
00:30 USA February Non-Farm Payrolls
Non-Farm Employment Change: +58,000 forecast vs 130,000 in January
Unemployment Rate: +4.3% m/m forecast vs +4.3% m/m in January
Average Hourly Earnings: +0.3% m/m forecast vs +0.4% m/m in January
00:30 USA February Retail Sales (+0.1% m/m forecast vs +0.0% m/m in January)
Latest News
Interesting Movers
Trading higher
+14.1% Bapcor (BAP) – Change in substantial holding (Tanarra Capital 19.2% vs 15.7%), general strength across the broader Consumer Discretionary sector today.
+13.1% Siteminder (SDR) – No news, general strength across the broader Information Technology sector today.
+10.8% Wisetech Global (WTC) – No news, general strength across the broader Information Technology sector today.
+10.0% Droneshield (DRO) – No news, general strength across the broader Defence sector today.
+9.7% Dateline Resources (DTR) – S&P DJI Announces March 2026 Quarterly Rebalance, rise is consistent with prevailing short and long term uptrends, a recent regular in ChartWatch ASX Scans Uptrends list 🔎📈
+9.6% Catapult Sports (CAT) – No news, general strength across the broader Information Technology sector today.
+9.3% Magellan Financial Group (MFG) – Becoming a substantial holder (Lowy family 5.1%).
+9.2% Pro Medicus (PME) – No news, general strength across the broader Information Technology sector today.
+8.4% IDP Education (IEL) – No news, general strength across the broader Consumer Discretionary sector today.
+7.5% Elsight (ELS) – S&P DJI Announces March 2026 Quarterly Rebalance, general strength across the broader Defence sector today, rise is consistent with prevailing short and long term uptrends, a regular in ChartWatch ASX Scans Uptrends list 🔎📈
+7.2% Domino's Pizza Enterprises (DMP) – No news, general strength across the broader Consumer Discretionary sector today.
+6.5% Telix Pharmaceuticals (TLX) – No news, general strength across the broader HealthCare sector today.
+6.2% EQ Resources (EQR) – S&P DJI Announces March 2026 Quarterly Rebalance, rise is consistent with prevailing short and long term uptrends, a regular in ChartWatch ASX Scans Uptrends list 🔎📈
+5.2% Megaport (MP1) – No news, general strength across the broader Information Technology sector today.
+4.9% REA Group (REA) – No news, general strength across the broader Information Technology sector today.
+4.8% Temple & Webster Group (TPW) – No news, general strength across the broader Consumer Discretionary sector today.
+4.5% Electro Optic Systems (EOS) – No news, general strength across the broader Defence sector today.
+4.5% Xero (XRO) – No news, general strength across the broader Information Technology sector today.
+3.9% Technology One (TNE) – No news, general strength across the broader Information Technology sector today.
Trading lower
-11.8% (DYL) – Half-Year Financial Report - 31 December 2025 and continued negative response to Response to Media Speculation, general weakness across the broader Uranium sector today.
-11.3% Catalyst Metals (CYL) – No news, general weakness across the broader Gold sector today.
-9.6% Sandfire Resources (SFR) – No news, general weakness across the broader Resources sector today.
-8.2% Westgold Resources (WGX) – No news, general weakness across the broader Gold sector today.
-8.1% Northern Star Resources (NST) – No news, general weakness across the broader Gold sector today.
-7.8% Firefly Metals (FFM) – No news, general weakness across the broader Resources sector today.
-7.6% Metals X (MLX) – No news, general weakness across the broader Resources sector today.
-7.2% Genesis Minerals (GMD) – No news, general weakness across the broader Gold sector today.
-7.0% Ora Banda Mining (OBM) – No news, general weakness across the broader Gold sector today.
-7.0% Black Cat Syndicate (BC8) – No news, general weakness across the broader Gold sector today.
-6.9% Boss Energy (BOE) – No news, general weakness across the broader Uranium sector today, fall is consistent with prevailing short and long term downtrends, a regular in ChartWatch ASX Scans Downtrends list 🔎📉
-6.0% St Barbara (SBM) – Ceasing to be a substantial holder (IP Concept was 4.8%), general weakness across the broader Gold sector today.
-6.0% Evolution Mining (EVN) – No news, general weakness across the broader Gold sector today.
-6.0% Capricorn Metals (CMM) – No news, general weakness across the broader Gold sector today.
-5.9% Peninsula Energy (PEN) – No news, general weakness across the broader Uranium sector today.
-5.6% Capstone Copper Corp. (CSC) – No news, general weakness across the broader Resources sector today.
-5.6% Resolute Mining (RSG) – No news, general weakness across the broader Gold sector today.
-5.4% Paladin Energy (PDN) – No news, general weakness across the broader Uranium sector today.
Broker Moves
Audinate Group (AD8)
Retained at neutral at Macquarie; Price Target: $3.20
Ampol (ALD)
Retained at outperform at Macquarie; Price Target: $36.00
ASX (ASX)
Retained at neutral at UBS; Price Target: $58.40
BHP Group (BHP)
Retained at neutral at UBS; Price Target: $52.00
Boss Energy (BOE)
Retained at hold at Jefferies; Price Target: $1.60
Retained at sell at Ord Minnett; Price Target: $1.50
Beach Energy (BPT)
Upgraded to underweight from sell at Jarden; Price Target: $1.10 from $0.91
Catapult Sports (CAT)
Retained at buy at Bell Potter; Price Target: $4.85 from $5.50
Charter Hall Group (CHC)
Retained at buy at Ord Minnett; Price Target: $25.10 from $25.50
Charter Hall Social Infrastructure REIT (CQE)
Retained at buy at Ord Minnett; Price Target: $3.25
Digico Infrastructure REIT (DGT)
Retained at buy at Ord Minnett; Price Target: $3.60 from $3.80
Endeavour Group (EDV)
Retained at lighten at Ord Minnett; Price Target: $2.90 from $3.00
Frontier Digital Ventures (FDV)
Retained at speculative buy at Bell Potter; Price Target: $0.46 from $0.58
Golden Horse Minerals (GHM)
Retained at buy at Shaw and Partners; Price Target: $1.50
Goodman Group (GMG)
Retained at hold at Ord Minnett; Price Target: $29.15 from $31.25
GPT Group (GPT)
Retained at accumulate at Ord Minnett; Price Target: $5.45 from $5.35
Ingenia Communities Group (INA)
Upgraded to buy from accumulate at Ord Minnett; Price Target: $5.00 from $4.95
Karoon Energy (KAR)
Upgraded to buy from neutral at Jarden; Price Target: $2.50 from $1.57
Lifestyle Communities (LIC)
Upgraded to accumulate from hold at Ord Minnett; Price Target: $5.35 from $5.10
LendLease Group (LLC)
Retained at hold at Ord Minnett; Price Target: $4.50 from $4.95
Mirvac Group (MGR)
Retained at buy at Ord Minnett; Price Target: $2.15 from $2.25
Megaport (MP1)
Retained at outperform at Macquarie; Price Target: $23.30
Metcash (MTS)
Downgraded to hold from outperform at CLSA; Price Target: $3.30 from $4.20
Nufarm (NUF)
Retained at buy at Bell Potter; Price Target: $3.60
NexGen Energy (Canada) (NXG)
Retained at buy at UBS; Price Target: $21.00
NEXTDC (NXT)
Retained at outperform at Macquarie; Price Target: $20.80
Scentre Group (SCG)
Retained at accumulate at Ord Minnett; Price Target: $3.95
Stockland (SGP)
Upgraded to buy from accumulate at Ord Minnett; Price Target: $5.90
Santos (STO)
Retained at buy at Citi; Price Target: $7.00
Upgraded to overweight from underweight at Jarden; Price Target: $8.00 from $5.90
Telstra Group (TLS)
Retained at outperform at Macquarie; Price Target: $5.44
Vicinity Centres (VCX)
Upgraded to accumulate from hold at Ord Minnett; Price Target: $2.50
Viva Energy Group (VEA)
Retained at outperform at Macquarie; Price Target: $2.70
Retained at buy at UBS; Price Target: $2.40
Woodside Energy Group (WDS)
Upgraded to overweight from neutral at Jarden; Price Target: $34.00 from $26.25
Wisetech Global (WTC)
Retained at outperform at Macquarie; Price Target: $97.70
Scans
Top Gainers
Code | Company | Last | % Chg |
|---|---|---|---|
| T92 | Terra Critical Minerals Ltd | $0.125 | +35.87% |
| FND | Findi Ltd | $1.045 | +27.44% |
| BEZ | Besra Gold Inc | $0.15 | +25.00% |
| TMK | TMK Energy Ltd | $0.13 | +23.81% |
| BAS | Bass Oil Ltd | $0.087 | +20.83% |
Top Fallers
Code | Company | Last | % Chg |
|---|---|---|---|
| TPC | TPC Consolidated Ltd | $3.10 | -31.11% |
| NFM | New Frontier Minerals Ltd | $0.011 | -26.67% |
| RMC | Resimac Group Ltd | $0.985 | -17.92% |
| NME | NEX Metals Exploration Ltd | $0.014 | -17.65% |
| NX1 | Nexalis Therapeutics Ltd | $0.021 | -16.00% |
52 Week Highs
Code | Company | Last | % Chg |
|---|---|---|---|
| T92 | Terra Critical Minerals Ltd | $0.125 | +35.87% |
| BAS | Bass Oil Ltd | $0.087 | +20.83% |
| TOR | Torque Metals Ltd | $0.37 | +19.36% |
| WEC | White Energy Company Ltd | $0.046 | +15.00% |
| MYE | Mastermyne Group Ltd | $0.20 | +11.11% |
52 Week Lows
Code | Company | Last | % Chg |
|---|---|---|---|
| TPC | TPC Consolidated Ltd | $3.10 | -31.11% |
| NME | NEX Metals Exploration Ltd | $0.014 | -17.65% |
| VTX | Vertex Minerals Ltd | $0.165 | -8.33% |
| FLX | FELIX Group Holdings Ltd | $0.115 | -8.00% |
| EMC | Everest Metals Corporation Ltd | $0.12 | -7.69% |
Near Highs
Code | Company | Last | % Chg |
|---|---|---|---|
| VVLU | Vanguard Global Value Equity Active ETF | $80.22 | +0.26% |
| IHD | iShares S&P/ASX DIV Opportunities Esg Screened ETF | $17.14 | -0.98% |
| KOV | Korvest Ltd | $15.99 | -0.50% |
| HGBL | Betashares Global Shares Currency Hedged ETF | $78.17 | -0.31% |
| MQGPG | Macquarie Group Ltd | $103.49 | -0.01% |
Relative Strength Index (RSI) Oversold
Code | Company | Last | % Chg |
|---|---|---|---|
| DDR | Dicker Data Ltd | $8.61 | 0.00% |
| GRR | Grange Resources Ltd | $0.195 | 0.00% |
| SGP | Stockland | $4.79 | -0.83% |
| CGFPC | Challenger Ltd | $100.18 | -0.02% |
| WES | Wesfarmers Ltd | $75.82 | +0.33% |
