
The ASX 200 is tumbling — and short sellers are making a killing. Here’s what investors can do
Short sellers have been hammering your portfolio for months. If you can’t beat them, it might be time to learn how to join them.


Source: Market Index using ChatGPT 5.2
Mentioned
KEY POINTS
- Many ASX sectors, including Consumer Discretionary, Health Care and Information Technology, have been trending lower since August, challenging the long-held belief that diversification across sectors is the best protection against volatility.
- Modern markets are increasingly dominated by institutional flows and momentum-driven strategies, pushing capital toward winning sectors while abandoning losing ones — posing difficult questions for investors determined to buy the dip.
- This article explores two approaches investors can adopt to both prosper and protect their portfolios in modern markets: trend following and short selling.
Recent volatility tied to escalating conflict in the Middle East has once again reminded investors how quickly markets can turn. Headlines this week have been dominated by sharp swings in commodities, currencies, and stocks as traders reassess geopolitical risk.
But for many parts of the ASX, the weakness didn’t start this week.
In fact, several major sectors — particularly Consumer Discretionary, Health Care, and Information Technology — have been trending lower for months. In many cases, the decline began as far back as August last year, long before the latest geopolitical shock.
That longer-term weakness raises an uncomfortable question:
How effective is traditional diversification when multiple sectors are falling together?
For many investors, falling share prices simply mean anxiety and heartbreak. But for another group of market participants, they represent something very different — opportunity.
Short sellers aim to profit from declining share prices. Their activities are often blamed in the media — and sometimes by professional investors — for exacerbating the sharpest falls in major ASX stocks. Ironically, those same stocks are often widely held in everyday investors’ portfolios: short sellers’ gains often equate to average investors’ pain.
This article challenges the conventional way volatility is framed. More importantly, it explores how investors can diversify not just across sectors — but across direction. In other words: if you can’t beat the short sellers, you might consider joining them.
Diversification doesn't always equal protection
The traditional advice given to investors is simple: diversify across sectors. The idea is that when one part of the market struggles, strength in another will offset the weakness. “A balanced portfolio should smooth out volatility,” we’re told.
But modern markets do not always behave that way. Over the past eight months, the sector performance picture on the ASX tells a different story. While a handful of areas have performed relatively well, several large sectors have been locked in persistent downtrends.
Full name (TR = Total Return) | 3-month Chg % | 6-month Chg % | 1-year Chg % |
|---|---|---|---|
S&P/ASX Gold Sub-Index TR | +21.8% | +56.9% | +118.6% |
S&P/ASX 200 Resources Sector TR | +22.9% | +35.8% | +55.9% |
S&P/ASX 200 Energy Sector TR | +19.0% | +12.4% | +30.3% |
S&P/ASX 200 Consumer Staples Sector TR | +6.7% | +4.9% | +9.4% |
S&P/ASX 200 Utilities Sector TR | +3.6% | +4.3% | +18.0% |
S&P/ASX 200 Financials Sector TR | +8.2% | +3.4% | +14.9% |
S&P/ASX 200 TR | +4.6% | +3.3% | +12.2% |
S&P/ASX 200 Industrials Sector TR | -0.2% | +0.3% | +8.0% |
S&P/ASX 200 Communications Sector TR | -3.4% | -8.3% | +2.4% |
S&P/ASX 200 Real Estate TR | -8.5% | -11.2% | -1.3% |
S&P/ASX 200 Consumer Discretionary Sector TR | -13.0% | -19.7% | -11.2% |
S&P/ASX 200 Health Care Sector TR | -18.7% | -24.0% | -31.8% |
S&P/ASX 200 Information Technology Sector TR | -28.0% | -40.0% | -33.3% |
ASX 200 sector indices performance table since August 1, 2025. Total Return = Capital gains + Dividends.
When several sectors trend lower together, diversification alone does not protect portfolios — it simply spreads the losses around. This is partly a reflection of how markets have evolved.
Institutional flows, systematic funds, and momentum-driven trading strategies now play a dominant role in determining market direction. These strategies tend to amplify trends rather than dampen them, pushing capital toward sectors already rising and withdrawing it rapidly from those already falling. The result is a market environment where sector trends persist longer and move further than many traditional investors expect.
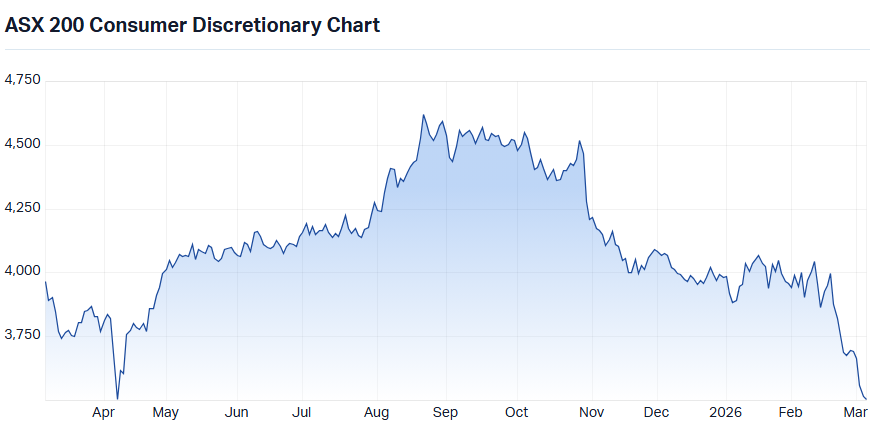
ASX 200 Consumer Discretionary (XDJ) chart
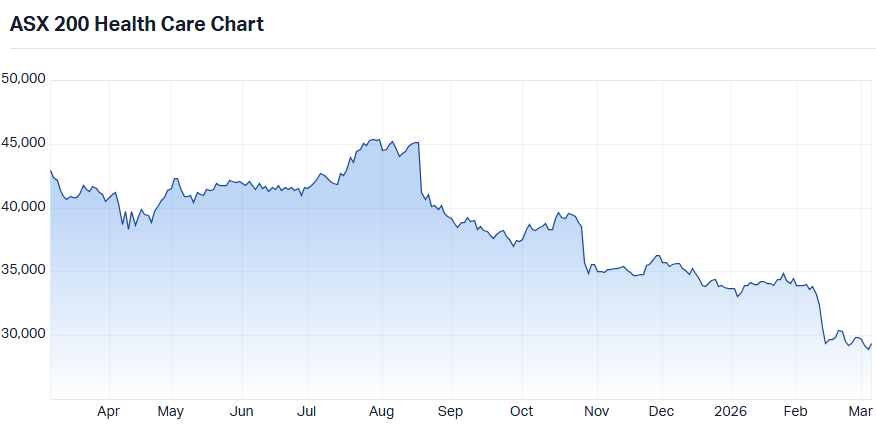
ASX 200 Health Care (XHJ) chart
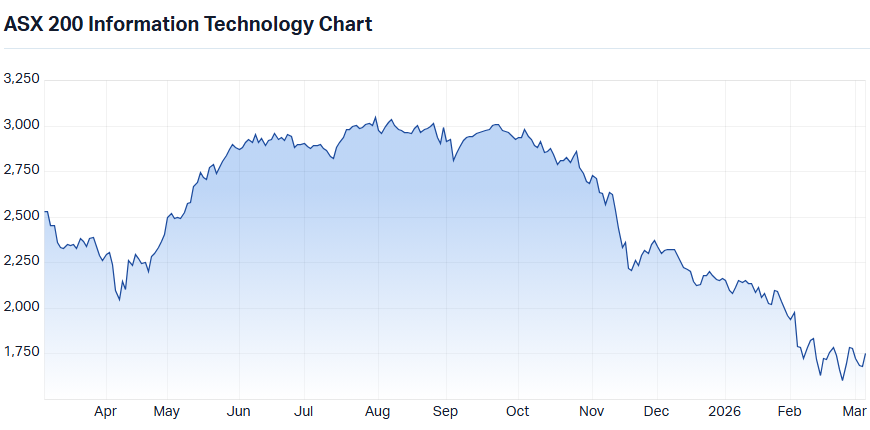
ASX 200 Information Technology (XIJ) chart
For investors still following the old rulebook of simply owning “a bit of everything” — this can be dangerous. In modern markets, diversification across sectors is often less effective than diversification across trends.
If markets increasingly reward perceived winning sectors with capital flows while starving perceived losing sectors, then the most sensible response to a falling sector may not be to hold it, but to step aside entirely — or even take the other side of the trade.
Strategy one: Follow the trend
The first adaptation investors should consider is embracing trend following.
Rather than allocating capital evenly across sectors, trend followers direct capital toward areas of the market that are already demonstrating sustained strength, while reducing or eliminating exposure to sectors that are trending lower.
The principle is simple: markets tend to trend more often than they mean-revert. Instead of trying to predict turning points, trend followers focus on identifying the direction of the prevailing move and participating in it.
One of the simplest frameworks for identifying trends is the long-term moving average, such as the widely used 200-day moving average. When price is above it, the long-term trend is generally considered up; when below it, down. The slope of the indicator can also provide early warning signals as momentum strengthens or fades.
My own ChartWatch trend ribbons operate on a similar principle, using layered trend measures to identify when momentum is building or deteriorating across the market. The goal isn’t to predict where prices should go — it is to respond to what prices are actually doing.
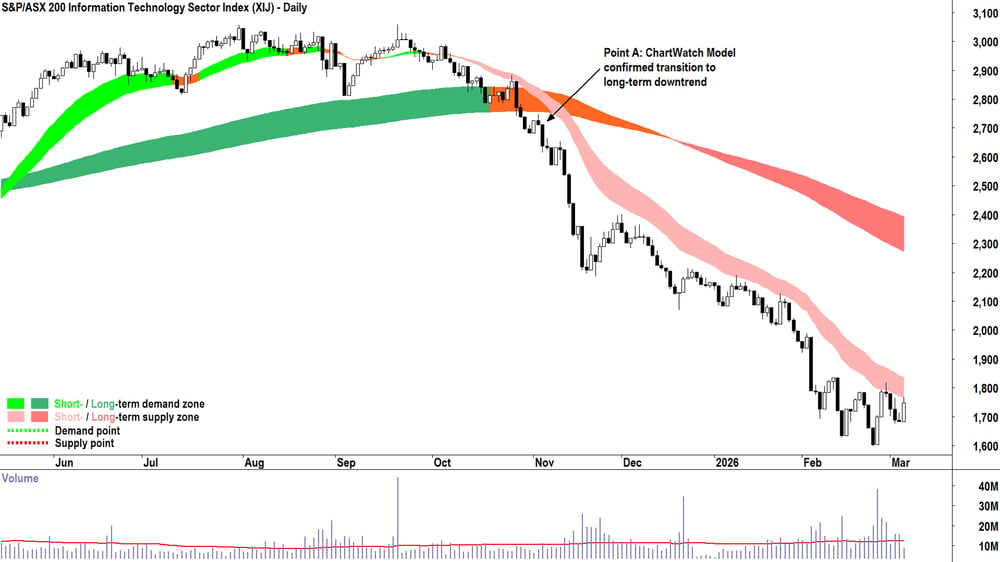
ASX 200 Information Technology chart with ChartWatch trend ribbons
When a sector enters a sustained downtrend, marked as Point A on the chart above of the ASX 200 Information Technology Sector Index (XIJ), the trend-following investor does not attempt to argue with the market or fight the decline. They simply reduce exposure and allocate capital elsewhere.
For example, at roughly the same time the XIJ was flagging a new long-term downtrend, the ASX 200 Resources Sector Index (XJR) was flagging a new long-term uptrend, marked as Point B on the chart below.
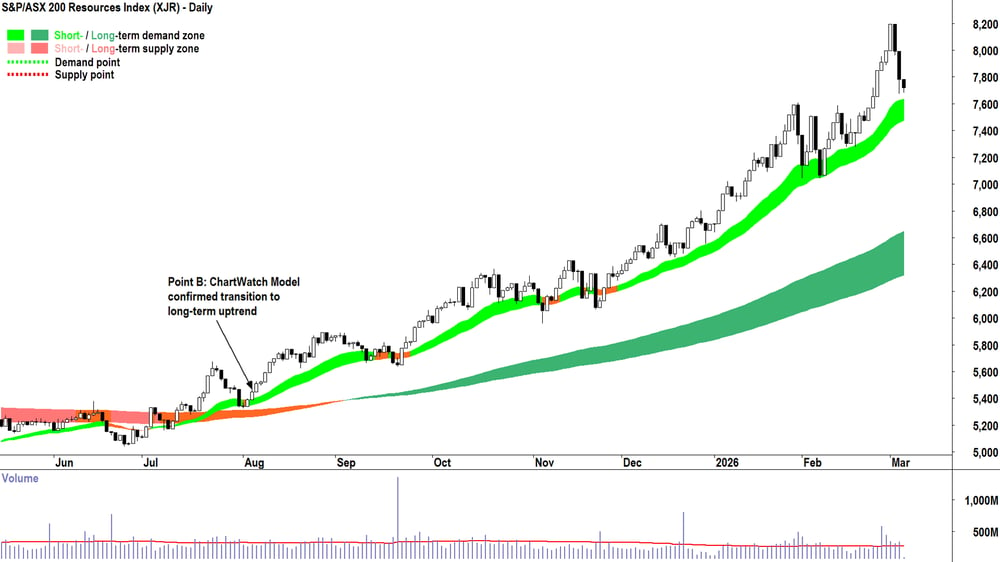
ASX 200 Resources chart with ChartWatch trend ribbons
I'll explain more about the ChartWatch model for long-term trend change below, but for now I propose that in modern markets, there's another option than simply stepping aside from weak sectors — investors can potentially profit from their decline.
Strategy two: Short selling (if you can’t beat them, join them!)
Short sellers have long been portrayed as the villains of financial markets. Whenever a high-profile stock collapses, commentary often points to hedge funds or institutional traders “attacking” the company by selling it short.
But short selling itself is simply another way of expressing a view on price direction. It’s perfectly legal on the ASX, and in modern markets that aim to price risk and return — it’s an essential component of the price discovery process.
In plain English, short selling involves borrowing shares and selling them, with the intention of buying them back later at a lower price.
If the price falls as expected, the short seller buys the shares back at the lower price, returns them to the lender, and keeps the difference as profit.
If instead the price rises, the short seller must still buy the shares back — potentially at a loss.
Short selling therefore carries its own risks, but it also provides investors with a powerful tool: the ability to profit from declining markets.
Institutional investors and hedge funds use short selling extensively as part of broader long-short strategies, where they buy strong stocks while simultaneously shorting weak ones. This approach allows them to benefit from relative performance — the winners rising and the losers falling — while reducing overall portfolio volatility.
That last point is critical. The addition of short selling to one’s toolbox may not only improve returns, but it may also help reduce portfolio risk. This is because short positions can also serve another purpose: hedging. By holding positions that benefit when prices fall, investors can offset losses elsewhere in their portfolio, reducing overall volatility during broad market downturns.
But short selling continues to receive a bad rap. This is likely because many retail investors unknowingly provide the other side of these trades — helping short sellers accumulate profits while they themselves are left holding losing positions.
When a stock enters a clear downtrend, institutions are often building short positions at the same time that everyday investors attempt to “buy the dip.” From the perspective of professional traders, that dip-buying activity provides the liquidity they need to establish their positions.
In other words, the big fish are often feeding on the behaviour of the small fish.
But today, retail investors have more tools than ever before to access similar strategies — including short exposure through derivatives, contracts for difference (CFDs), and inverse exchange-traded fund products (ETFs).
There are two ASX-listed ETFs that offer investors short exposure to the Australian share market, Betashares’ BEAR and BBOZ. Each uses derivatives and short selling strategies to grow the value of the ETF, and therefore its market price, as the ASX 200 falls.
Used carefully and responsibly, these tools can allow investors to diversify their portfolios across direction, rather than simply across sectors.
Lessons from ChartWatch ASX Scans
The concept becomes clearer when we examine real-world examples.
Over the past several months, our ChartWatch ASX Scans series has repeatedly identified stocks entering strong downtrends across sectors such as Technology, Health Care, and Consumer Discretionary.
These scans focus on identifying deteriorating price structures — lower highs, lower lows, and sustained breaks below critical trend measures. Once these conditions emerge, the probability of continued downside tends to increase, potentially creating favourable conditions for short selling strategies.
See the table below showing the dates and prices at which ChartWatch ASX Scans first flagged a range of underperforming stocks over the past 6–8 months, along with the number of subsequent flags confirming their continued downtrends. In theory, each could have provided an opportunity to implement a short selling strategy.
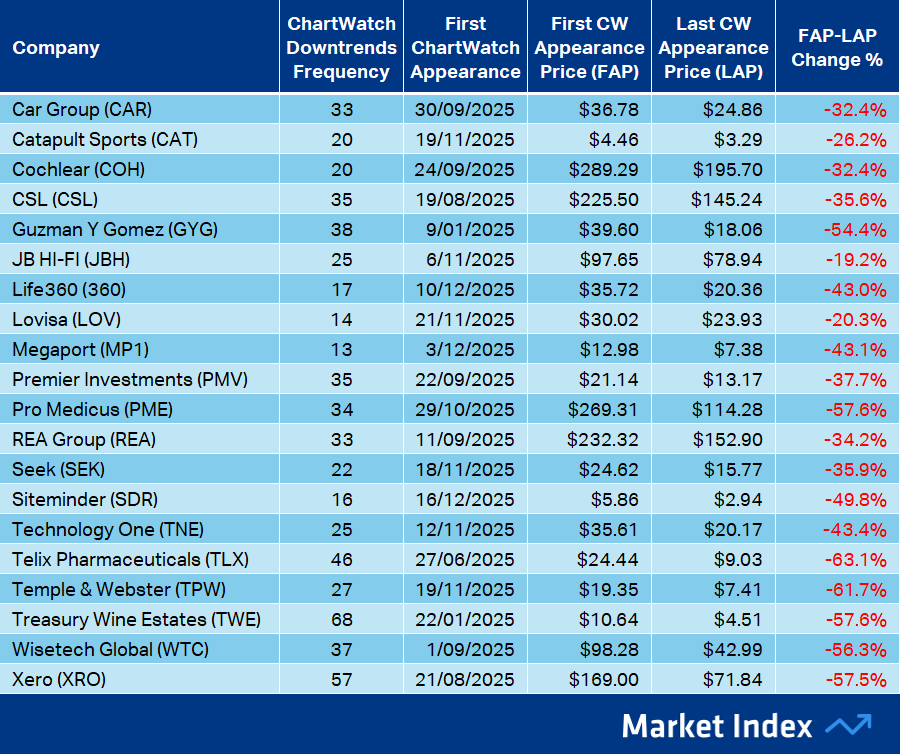
ChartWatch ASX Scans identification of downtrends in a range of underperforming ASX stocks as at Wednesday 4 March
Many readers likely still hold some of the twenty stocks listed above in their portfolios. Whilst this may be of little comfort now, recognising deteriorating price trends earlier could have helped avoid much of the damage.
For investors able to go short, however, the declines shown in the rightmost column could have represented gains rather than losses.
The following three case studies illustrate the ChartWatch trend change model in action, and how it could have been used to identify potential short selling opportunities in the respective stocks.
Case Study 1: Xero (XRO) (Information Technology)
%20chart,%20ChartWatch%20trend%20change%20model.png)
The ChartWatch technical analysis model first flagged accounting software company Xero as a strong downtrend on 21 August last year at a share price of $169. These are the key factors the model considered in concluding that Xero shares were more likely to decline than remain steady or rise:
Trend Conditions
Short term trend = short term trend ribbon (light green when up, light pink when down) is down
Long term trend = long term trend ribbon (dark green when up, dark pink when down) is no longer up — i.e., equilibrium (amber) or down
Price Action
Falling peaks and falling troughs
Sell-offs are larger than the rallies that follow
Candles
Predominantly supply-side in nature (i.e., black-bodied and or upward pointing shadows)
Volume and volatility
Volume climax around 24 June peak followed by withdrawal of volume ex-post (demand dried up!)
Increased downside volatility compared to upside volatility
Don't worry if you don't understand all of the terms mentioned above. They will become second nature with a little training — and by watching the instructional videos on the Market Index YouTube page.
The bottom line is this: The ChartWatch technical analysis model is designed to determine when the balance between demand and supply of a company's shares has likely tipped towards short- and long-erm excess supply. When this occurs, the company is flagged in the Downtrends List in the ChartWatch ASX Scans series published daily on the Market Index News page.
In Xero's case, it appeared in the Downtrends List another 56 times until its last appearance on February 24 this year. Xero shares have fallen over 57% from their level at the time of the initial signal.
Case Study 2: Temple & Webster (TPW) (Consumer Discretionary)
%20chart,%20ChartWatch%20trend%20change%20model.png)
What should strike you most about online retailer Temple & Webster chart, is just how similar the start of its long-term downtrend is to Xero’s.
Once again, the same technical conditions appeared:
A major fundamental event triggering a strong supply-side response (in this case the company’s 15 August 2025 earnings release)
Failure of the short-term trend
Deterioration in price action and candlesticks
A decisive slide below the long-term trend ribbon
In Temple & Webster’s case, the ChartWatch model flagged the transition when these conditions aligned on 19 November 2025, marking the start of a protracted long-term downtrend.
Temple & Webster shareholders saw 61% of the company’s market value wiped out between that first Downtrends List appearance and its most recent on 3 March.
Case Study 3: CSL (CSL) (Health Care)
%20chart%20ChartWatch%20trend%20change%20model.png)
Despite operating in very different industries — Xero in accounting software, Temple & Webster in online retail, and CSL in global biotechnology — their share prices ultimately followed a remarkably similar path once their uptrends broke.
Question: How many times did you hear in the financial media, or from a financial professional, to “buy the dip” in CSL?
This simply wasn't an option for the ChartWatch technical analysis model. The model is indifferent to company activity or profitability; it simply measures investors’ collective willingness to accumulate or discard a stock, doing so in an unemotional and clinical manner.
In CSL’s case, the stock was flagged several times in the Downtrends List between September 2024 and June 2025, with a brief pause during the July 2025 rally. The data in the ChartWatch performance table above relates to the period following the massive supply event on 19 August 2025.
Instead of buying the ensuing dip, ChartWatch ASX Scans flagged CSL as a downtrend — and therefore a potential short selling opportunity — 35 times, during which the company’s shares fell more than 35%.
The big fish and the small fish
Markets have always evolved.
What worked decades ago does not necessarily work today, particularly in an environment increasingly dominated by systematic strategies, institutional flows, and algorithmic trading. In this ecosystem, large professional investors operate with sophisticated tools and strategies designed to exploit trends — both upward and downward.
For investors still relying on an antiquated approach to diversification, the risk is simple: you become the liquidity. When large funds want to short a falling stock, they need buyers. When they want to buy a rising one, they need sellers.
Sooner or later, every investor must decide which side of that trade they want to be on.
The good news is that modern investors have access to far more information, analysis, and trading tools than ever before. By embracing approaches such as trend following and directional diversification, investors can adapt to the realities of modern markets rather than fighting against them.
In markets dominated by big fish, there is a simple rule: If you don’t learn to trade like them, there is a good chance you’ll eventually be eaten by them!
Want to Learn More? Attend our ChartWatch *LIVE* Webinars
ChartWatch *LIVE* Webinars – WEEKLY Wednesday's @ 12pm AEDT
Learn more about technical analysis and trend following through real case studies on ASX stocks. Australia's premier technical analyst, Carl Capolingua, shares his unique insights on stocks as requested by viewers. Ask about a company in your portfolio or anything related to trading and investing and get Carl's expert opinion.
Places are limited so >REGISTER NOW!<
