News | Market Wraps
Evening Wrap: ASX 200 rebounds as bargain hunters lift tech stocks, Wisetech jumps 7%, Life360 up 6%
The S&P/ASX 200 closed 39.1 points higher, up 0.4%.

Mentioned
The S&P/ASX 200 closed 39.1 points higher, up 0.4%.
The ASX 200 finished higher at 8,940.3, but off its morning highs, as bargain hunters stepped in to snap up beaten down technology stocks after two straight losing sessions. Eight of the eleven major sectors rebounded.
Information Technology (XIJ) (+4.5%) led the gain, tracking a rally in the tech-laden Nasdaq overnight. WiseTech Global (WTC) (+7.1%), Xero (XRO) (+4.2%) and NextDC (NXT) (+3.3%) were among the top performers.
Resources (XJR) (-0.3%) was the weakest sector as ex-dividend selling and softer sentiment toward miners weighed on the complex. BHP Group (BHP) dipped 0.9% as it went ex-dividend $1.03 fully franked, but bucking the "down on ex-dividend day" rule, Rio Tinto Limited (RIO) added $1.88 (+1.2%) after going ex-dividend $3.60 fully franked.
In stock news:
CSL (CSL) (+2.5%) — rose after securing a Canadian pandemic flu vaccine supply contract.
Deep Yellow (DYL) (-2.4%) — after refuting media reports that it is on the verge of a major capital raising.
The Lottery Corporation (TLC) (-0.7%) — slid amid plans for a new operating model and an executive re-shuffle.
Pengana Capital (PCG) (+4.1%) — lifted after appointing Antipodes to help manage its global equities LIC.
In Asian trade, spot silver lifted by 1.3% to US$84.60/oz, while Brent crude oil rose by 1.7% to US$84.19/bbl on widening Middle East conflict. Nevertheless, Woodside Energy Group (WDS) (-1.0%) and Karoon Energy (KAR) (-0.5%) were weaker.
Spot gold was flat around US$5,153/oz, but Evolution Mining (EVN) (-2.1%) and Genesis Minerals (GMD) (-4.2%) traded lower.
Be sure to click/scroll through for the usual reporting of the major sector and stock-specific moves, the broker responses to them, as well as all the key economic data in tonight's Evening Wrap.
Also, I have detailed technical analysis on the Nasdaq Composite and the S&P/ASX 200 in today's ChartWatch.
Let's dive in!
Today in Review
Thu 05 Mar 26, 5:08pm (AEST)
Name | Value | % Chg |
|---|---|---|
Major Indices | ||
| ASX 200 | 8,940.3 | +0.44% |
| All Ords | 9,164.9 | +0.52% |
| Small Ords | 3,640.6 | +0.73% |
| All Tech | 2,790.9 | +3.44% |
| Emerging Companies | 3,239.5 | +1.58% |
Currency | ||
| AUD/USD | 0.705 | -0.36% |
US Futures | ||
| S&P 500 | 6,859.75 | -0.24% |
| Dow Jones | 48,617.0 | -0.37% |
| Nasdaq | 25,060.0 | -0.27% |
Name | Value | % Chg |
|---|---|---|
Sector | ||
| Information Technology | 1,760.2 | +4.56% |
| Health Care | 29,495.4 | +1.92% |
| Real Estate | 3,548.4 | +0.95% |
| Energy | 10,300.4 | +0.78% |
| Financials | 9,654.6 | +0.76% |
| Consumer Staples | 12,615.6 | +0.55% |
| Communication Services | 1,702.4 | +0.51% |
| Utilities | 9,987.3 | +0.35% |
| Consumer Discretionary | 3,515.5 | -0.05% |
| Industrials | 8,389.1 | -0.28% |
| Materials | 24,172.7 | -0.48% |
Markets
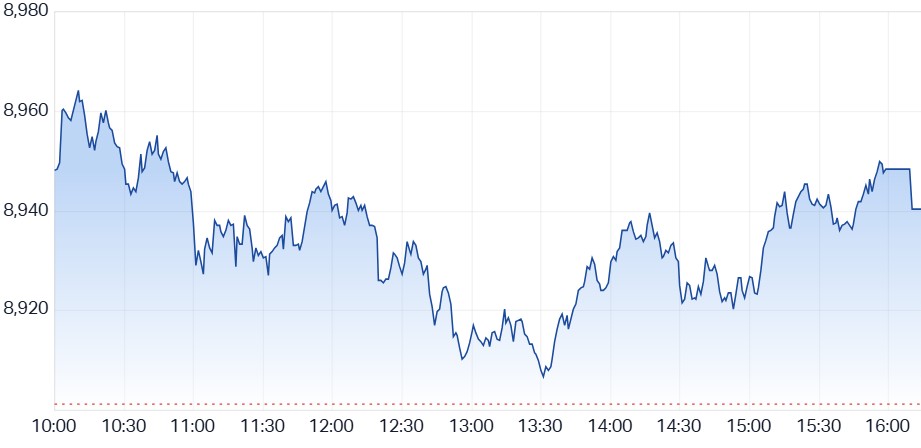
ASX 200 Session Chart
The S&P/ASX 200 (XJO) finished 39.1 points higher at 8,940.3, 0.27% from its session high and 0.44% from its low. In the broader-based S&P/ASX 300 (XKO) advancers beat decliners by a healthy 182 to 91.
Fund flows: Light at the end of the tech tunnel? 🔦
Today’s price action in Information Technology (XIJ) (4.6%) puts us one tentative but important step closer to setting a credible major point of demand — one that could potentially, with confirming price action and volume — solidify as the major bear market low for this sector.
The volume on the demand-side candles of 25-Feb and 26-Feb smack of short covering, and the reduced impact of the previous two drives lower suggests positional buying.
Today’s candle marks the first rising trough this year (the last was set on 4-Dec 2025!).
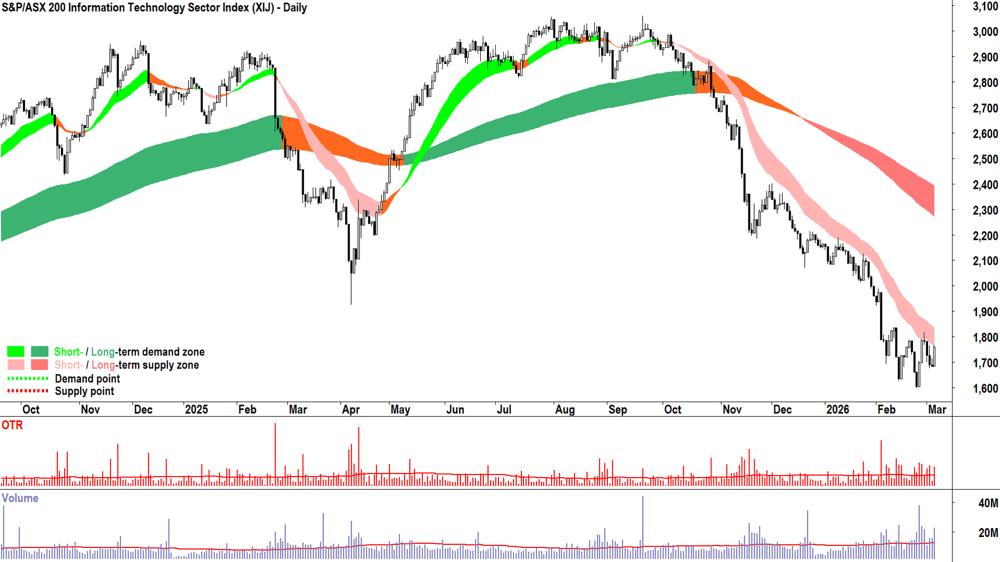
S&P-ASX 200 Information Technology Sector Index chart
But, as you likely know if you’ve been learning my technical model, I’m still a long way from calling the XIJ a “+R” chart!
Let’s see how it goes at the dynamic supply of the short term trend ribbon — a close above, retest, and hold is required there to confirm the ribbon's transition to a zone of dynamic demand.
Better still, the XIJ's price action goes on to breach the 27-Feb high of 1820 — thus putting it back into rising peaks and rising troughs. (If so, it would be the best showing of rising peaks and rising troughs since the index peaked all the way back in August last year — such is the consistency and severity of this move! 🤯)
Energy (XEJ) (+0.8%) is another sector chart that caught my attention today. The daily chart below demonstrates a strong motive up-phase cracking through an extended period of grinding equilibrium that started with the sector’s emergence from its long term downtrend in late-June last year.
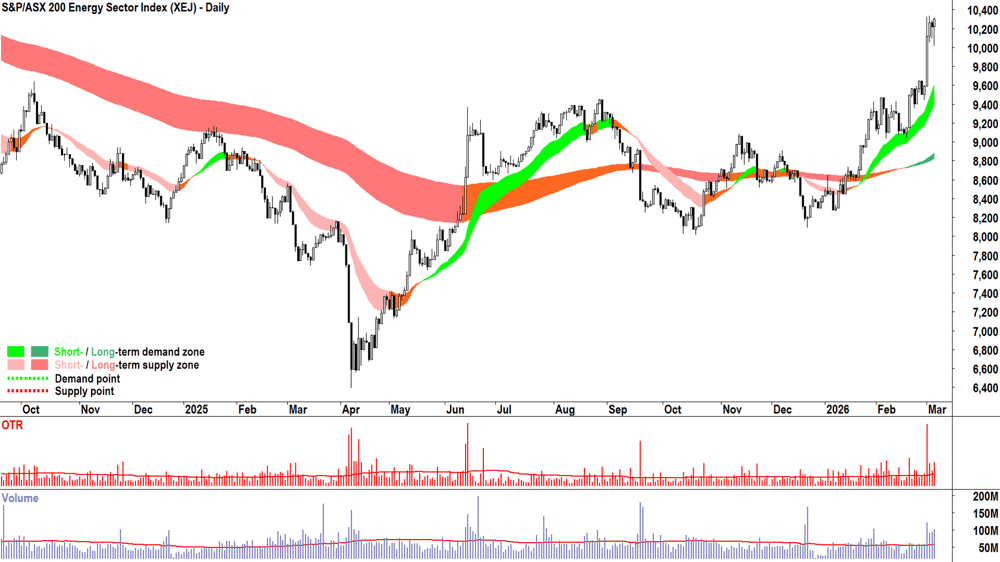
S&P-ASX 200 Energy Sector Index chart daily
This could be the decisive transition into an enduring long term uptrend (yes, the dark green caterpillar is born! 🐛).
I especially like today’s price action, it could have been a solid pullback, but the demand-side swept in to buy this morning’s dip, and the massive demand-side signal (long white-bodied candle) of 2-March is now confirmed. ✅
But, we look across to the left of the above chart — and there’s nothing to see in terms of potential historical points of supply… So we must click the “W” button to zoom out to the weekly chart!
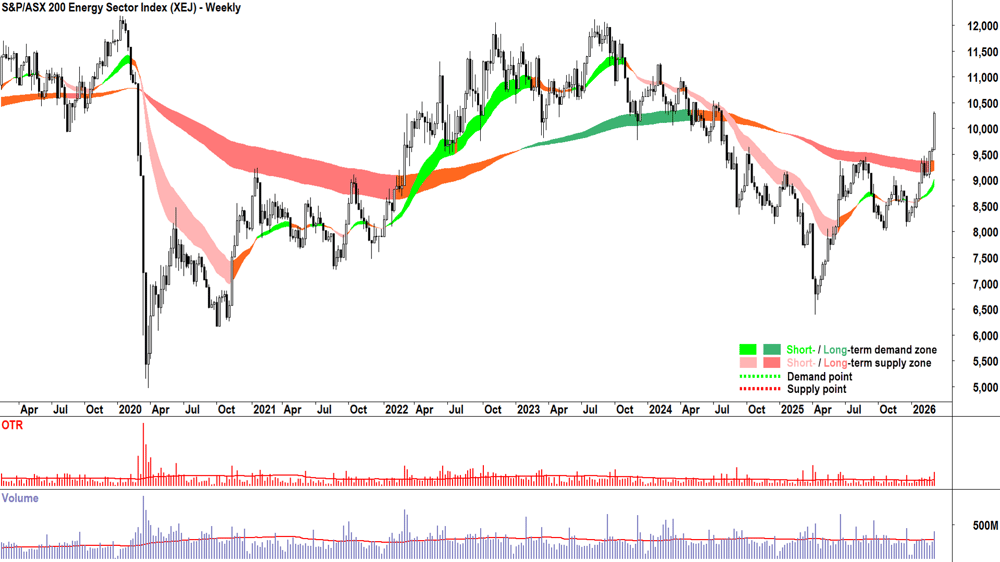
S&P-ASX 200 Energy Sector Index chart weekly
It shows a few potential pressure points at 10546, 11,008, and 11,272, but then a relatively clear run to August 2023’s 12122. The price action looks constructive here, too.
Today's best blue chip gainers
Company | Last Price | Change $ | Change % | 1mo % | 1yr % |
|---|---|---|---|---|---|
Ampol (ALD) | $32.06 | +$2.52 | +8.5% | +11.2% | +27.6% |
Wisetech Global (WTC) | $47.57 | +$3.17 | +7.1% | -7.2% | -47.8% |
Telix Pharmaceuticals (TLX) | $10.09 | +$0.62 | +6.5% | -0.3% | -63.4% |
Life360 (360) | $21.54 | +$1.16 | +5.7% | -20.0% | -3.8% |
Pinnacle Investment (PNI) | $15.52 | +$0.71 | +4.8% | -12.6% | -26.1% |
Pro Medicus (PME) | $121.49 | +$5.3 | +4.6% | -27.0% | -53.7% |
Technology One (TNE) | $26.30 | +$1.11 | +4.4% | +16.1% | -10.6% |
Whitehaven Coal (WHC) | $8.70 | +$0.36 | +4.3% | -9.0% | +51.3% |
Xero (XRO) | $83.89 | +$3.43 | +4.3% | +3.8% | -51.8% |
Macquarie Group (MQG) | $198.86 | +$7.33 | +3.8% | -7.0% | -10.2% |
Block (XYZ) | $91.81 | +$3.2 | +3.6% | +15.1% | -5.1% |
Nextdc (NXT) | $13.44 | +$0.44 | +3.4% | +4.6% | -3.0% |
The A2 Milk (A2M) | $9.91 | +$0.31 | +3.2% | +15.8% | +24.2% |
Car Group (CAR) | $25.75 | +$0.75 | +3.0% | +0.3% | -29.9% |
Ramsay Health Care (RHC) | $44.00 | +$1.24 | +2.9% | +23.7% | +28.6% |
Worley (WOR) | $11.03 | +$0.31 | +2.9% | -17.7% | -24.7% |
Steadfast Group (SDF) | $4.30 | +$0.12 | +2.9% | -14.0% | -20.7% |
Endeavour Group (EDV) | $3.95 | +$0.11 | +2.9% | +7.9% | -6.0% |
Treasury Wine Estates (TWE) | $4.36 | +$0.12 | +2.8% | -15.5% | -60.0% |
CSL (CSL) | $146.49 | +$3.63 | +2.5% | -19.4% | -44.6% |
Today's worst blue chip losers
Company | Last Price | Change $ | Change % | 1mo % | 1yr % |
|---|---|---|---|---|---|
Genesis Minerals (GMD) | $7.25 | -$0.32 | -4.2% | -0.8% | +128.7% |
QBE Insurance Group (QBE) | $20.80 | -$0.76 | -3.5% | +5.3% | -1.5% |
Amcor PLC (AMC) | $64.22 | -$2.34 | -3.5% | -1.7% | -20.0% |
Capricorn Metals (CMM) | $14.24 | -$0.45 | -3.1% | +0.6% | +82.1% |
Evolution Mining (EVN) | $15.73 | -$0.34 | -2.1% | +4.7% | +148.5% |
Northern Star Resources (NST) | $29.36 | -$0.57 | -1.9% | +2.8% | +69.8% |
Ramelius Resources (RMS) | $4.45 | -$0.08 | -1.8% | -5.1% | +64.8% |
Perseus Mining (PRU) | $5.78 | -$0.09 | -1.5% | +1.6% | +90.1% |
Transurban Group (TCL) | $14.14 | -$0.21 | -1.5% | +1.6% | +6.7% |
Brambles (BXB) | $24.56 | -$0.34 | -1.4% | +10.0% | +17.7% |
Newmont Corp. (NEM) | $169.68 | -$2.18 | -1.3% | -1.3% | +148.5% |
Downer EDI (DOW) | $8.09 | -$0.1 | -1.2% | +1.4% | +50.1% |
Woodside Energy Group (WDS) | $30.45 | -$0.3 | -1.0% | +17.8% | +26.2% |
SGH (SGH) | $44.63 | -$0.43 | -1.0% | -3.6% | -13.0% |
BHP Group (BHP) | $55.15 | -$0.53 | -1.0% | +5.2% | +39.5% |
Vicinity Centres (VCX) | $2.33 | -$0.02 | -0.9% | -7.5% | +6.4% |
The Lottery Corp. (TLC) | $5.36 | -$0.04 | -0.7% | +3.5% | +10.3% |
Aurizon (AZJ) | $4.04 | -$0.03 | -0.7% | +11.6% | +28.7% |
Bluescope Steel (BSL) | $27.60 | -$0.19 | -0.7% | -5.7% | +19.1% |
Wesfarmers (WES) | $75.57 | -$0.5 | -0.7% | -10.5% | +3.8% |
ChartWatch
Nasdaq Composite Index
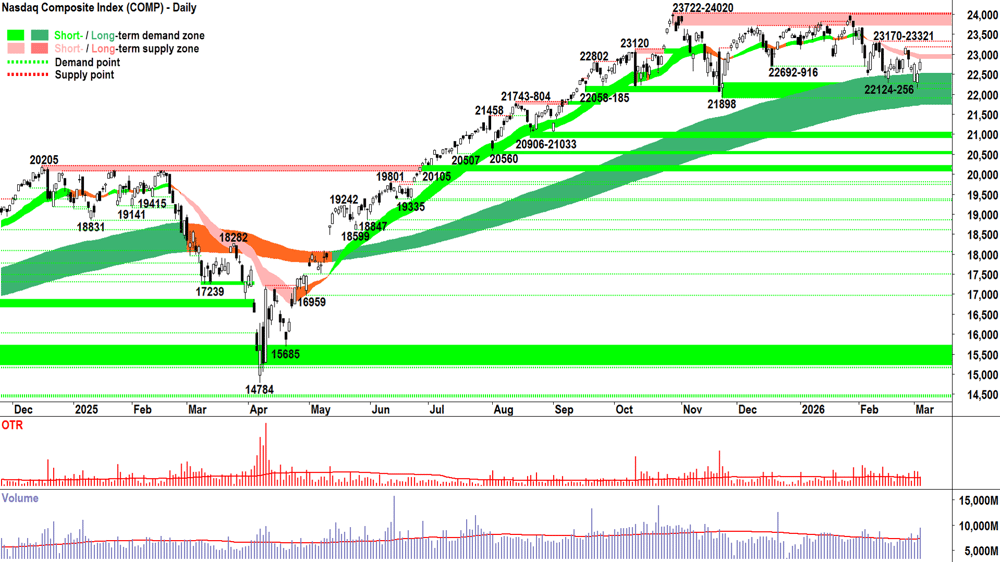
Analysis
Yesterday’s update: “we are now 9 out of the last 11 candles white-bodied.”
Make that 10 out of the last 12.
Of course, it’s pure coincidence that these manifestations of excess demand are occurring at the long term uptrend ribbon.
That ribbon exists only in our imaginations and in our charts. It’s not a physical object — but then again, neither are stock prices!
So, perhaps it’s not so crazy then that one imaginary construct is appearing to prevent another imaginary construct from falling.
Um, come to think of it… more crazy or less crazy!? 🤔
I’ll let you decide!
What’s not crazy at all, is the idea that demand and supply interact to determine price. More specifically, that:
D > S = P⬆️
D = S = P ↔️
S > S = P ⬇️
We must always bring our analysis back to these three scenarios — and which appears to be the prevailing state of the market. As trend followers, we skew our risk towards the long-side in the first scenario, towards the short-side in the last, and we stay the hell out in the second.
Back to the long term uptrend ribbon. Imaginary or not — we are witnessing excess demand manifest itself as white bodied candles in a price range between 22256 and 23170 (-ish!). That’s a fact.
As I noted yesterday, this is fantastic for us trend followers because it suggests that we can expect one of the two following scenarios:
The demand-side has sufficient cash to absorb the stock being dished out around current prices — but once that’s exhausted — it has sufficient cash and motivation to continue to chase any remaining supply to higher prices. 📈
The supply-side has sufficient stock to absorb the cash bravely lurking around current prices — but should that disappear — it has sufficient stock and motivation to continue to chase any remaining demand to lower prices. 📉
Scenario 1 equals what naysayers will no doubt come to call a miraculous and unfounded rally — but remember it is the nature of a bull market to rise!!! 📈
Scenario 2, on the other hand, very likely spells the end of this bull market. It may mark the beginning of a stagnation phase, at best, but it could also prove to be the beginning of a new bear market.
Which is more likely? 10 out of the last 12 candles are white, remember? This is the key item for me.
While the Comp keeps printing white candles, surely, at some point… the supply must take a breather, and the bull market will get back to doing what it does best! 🚀
If not… well, I’ll cut my portfolio risk further from its already super-conservative level. Can’t make an omelette without breaking a few eggs… and all! Plus, consider that I’m always long and short… so, there’s that too! ⚖️
(The bottom line is this: I have a clearly defined plan for managing my risk regardless of what the market throws at me!)
View
1/2RP still feels valid with respect to my US portfolio risk limit (RP = Risk Position — it reflects my personal allowable capital allocation limit for my investments in US stocks. So 1/2RP is 50%, 2/3RP is 67% and FRP is 100% 🪣).
Key levels
22124-22256 is the critical zone of demand — a close below it implies the supply-side is in control of the Comp's short term price, and that the long term uptrend is likely under significant pressure = ⚠️. The short term downtrend ribbon (presently 22888-22993) is the nearest critical zone of point supply, and 23170-23321 is not far beyond that.
S&P/ASX 200 (XJO)
%20chart_5%20Mar.png)
Analysis
Thud.
Boing.
One sound corresponds to the dreaded “dead cat bounce”.
And the other to a healthy, buy the dip rally.
Look up at the above chart of the ASX 200 and tell me which sound you heard today!? 🙉
What I heard wasn’t great. Really, I feel the Golden Le Creuset should have done better. Can I even call it that anymore!? 🤷
Let’s give it another candle to either confirm today’s modest rally wasn’t a fluke — or to confirm it’s merely a precursor to further selling.
I note the short term trend ribbon has transitioned to equilibrium (amber), also, it did a pretty good job of capping today’s upside move… MOTN = Not a great look!
Today’s above average volume, accompanied by the modest trading range — suggests that the buy the dip flow was met with credible, capping supply. It’s not ideal, nor is it a death-knell, it just requires further scrutiny: does the supply continue to cap upside price action or not? 🧐
Still, there’s reason to be optimistic while the long term uptrend ribbon continues to do its thing.
Clearly the analysis must now be more-balanced — more accommodative of both the bull and bear case scenarios — much like the Comp’s, above.
So, forgive me for not making a more definitive prediction as to what's about to happen next — but should you find someone who can do this for you… by all means go listen to them! 🙉
View
I am FRP... Just! 🪣 (i.e., my personal allowable capital allocation limit for my investments in Australian stocks is 100%). One more confirming supply-side candle would see me adjust to 2/3RP.
Key levels
8675-8683 is the closest zone of demand (static), and beyond this, sits the long term uptrend ribbon (presently 8673 - 8786) (dynamic). A close below 8673 neutralises the long term uptrend. 9201 is the key point of supply, but so too now is the short term trend ribbon (presently 8959 - 9006). The ASX 200 must at least close back above 9006 to reclaim the previous short term uptrend.
ChartWatch *LIVE* Webinar
ChartWatch *LIVE* Webinars – WEEKLY Wednesday's @ 12pm AEDT
Learn more about technical analysis and trend following through real case studies on ASX stocks. Australia's premier technical analyst, Carl Capolingua, shares his unique insights on stocks as requested by viewers. Ask about a company in your portfolio or anything related to trading and investing and get Carl's expert opinion.
Places are limited so >REGISTER NOW!<
Economy
Today
11:30 AUS Household Spending
Result: +0.3% m/m actual vs +0.4% m/m forecast and -0.5% m/m in January
Later this week
Friday
00:30 USA Unemployment Claims (+215k w/w forecast vs +212k w/w previous)
00:30 USA Import Prices (+0.2% m/m forecast vs -0.1% m/m previous)
Saturday
00:30 USA Unemployment Rate (+4.3% m/m forecast vs +4.3% m/m previous)
Latest News
Interesting Movers
Trading higher
+15.3% Lindian Resources (LIN) – Continued positive response to 04-Mar Investor Presentation - PDAC 2026, rise is consistent with prevailing short and long term uptrends, a regular in ChartWatch ASX Scans Uptrends list 🔎📈
+11.9% Viva Energy Group (VEA) – No news, general strength across the broader Energy sector today.
+11.7% Weebit Nano (WBT) – No news, general strength across the broader Information Technology sector today, bounced perfectly from long term uptrend ribbon!.
+11.6% Clarity Pharmaceuticals (CU6) – No news, general strength across the broader HealthCare sector today.
+10.4% Magellan Financial Group (MFG) – Continued positive response to 02-Mar Proposed merger with Barrenjoey, general strength across the broader Financials sector today.
+10.3% Catapult Sports (CAT) – Change in substantial holding, general strength across the broader Information Technology sector today, (Northcape Capital 7.3% from 6.3%).
+10.1% Droneshield (DRO) – No news, today's move is consistent with recent volatility.
+9.9% Zip Co. (ZIP) – No news, general strength across the broader Financials sector today.
+9.5% Benz Mining Corp. (BNZ) – No news, rise is consistent with prevailing short and long term uptrends, a regular in ChartWatch ASX Scans Uptrends list 🔎📈
+9.5% Iperionx (IPX) – No news, rise is consistent with prevailing short and long term uptrends 🔎📈
+8.5% Ampol (ALD) – No news, general strength across the broader Energy sector today.
+8.5% Core Lithium (CXO) – No news, general strength across the broader Lithium sector today.
+7.9% Mesoblast (MSB) – No news, general strength across the broader HealthCare sector today.
+7.1% Wisetech Global (WTC) – No news, general strength across the broader Information Technology sector today.
+6.5% Telix Pharmaceuticals (TLX) – No news, general strength across the broader HealthCare sector today.
+6.3% GQG Partners (GQG) – No news, general strength across the broader Information Technology sector today.
+5.7% Life360 (360) – No news, general strength across the broader Information Technology sector today.
+5.1% Polynovo (PNV) – No news, general strength across the broader HealthCare sector today.
+4.6% Pro Medicus (PME) – No news, general strength across the broader HealthCare sector today.
+4.4% Technology One (TNE) – No news, general strength across the broader Information Technology sector today.
+4.3% Whitehaven Coal (WHC) – No news, general strength across the broader Energy sector today.
+4.3% Xero (XRO) – No news, general strength across the broader Information Technology sector today.
Trading lower
-5.0% (SIQ) – No news, Ex-dividend 33.5 cents fully franked.
-4.6% Monadelphous Group (MND) – No news, Ex-dividend 49 cents fully franked.
-4.2% Genesis Minerals (GMD) – No news, general weakness across the broader Gold sector today.
-3.5% QBE Insurance Group (QBE) – No news, Ex-dividend 78 cents 30% franked.
-3.3% Jumbo Interactive (JIN) – Ceasing to be a substantial holder (Macquarie Group last update was 5.0%).
Broker Moves
Advanced Energy Minerals (AEM)
Retained at speculative buy at Ord Minnett; Price Target: $0.90
Ampol (ALD)
Retained at overweight at Morgan Stanley; Price Target: $31.00
Atlas Arteria (ALX)
Retained at equal-weight at Morgan Stanley; Price Target: $4.96
Amotiv (AOV)
Retained at outperform at Macquarie; Price Target: $11.90
Eagers Automotive (APE)
Retained at outperform at Macquarie; Price Target: $30.70
ARB Corporation (ARB)
Retained at neutral at Citi; Price Target: $22.05
Retained at outperform at Macquarie; Price Target: $29.95
Retained at buy at Ord Minnett; Price Target: $31.00
Arena REIT (ARF)
Retained at buy at UBS; Price Target: $4.09 from $4.05
Autosports Group (ASG)
Retained at outperform at Macquarie; Price Target: $5.19
Accent Group (AX1)
Retained at neutral at UBS; Price Target: $1.05 from $1.10
Aurizon Holdings (AZJ)
Retained at underweight at Morgan Stanley; Price Target: $3.50
Bapcor (BAP)
Upgraded to neutral from sell at Citi; Price Target: $0.76 from $1.25
Boss Energy (BOE)
Retained at speculative buy at Canaccord Genuity; Price Target: $2.80
Beach Energy (BPT)
Retained at sell at UBS; Price Target: $1.05
Breville Group (BRG)
Retained at overweight at Morgan Stanley; Price Target: $38.20
BWP Trust (BWP)
Retained at buy at UBS; Price Target: $4.17 from $4.11
Charter Hall Group (CHC)
Retained at buy at UBS; Price Target: $27.00 from $26.50
Centuria Industrial REIT (CIP)
Retained at buy at UBS; Price Target: $3.84 from $3.78
Charter Hall Long Wale REIT (CLW)
Retained at sell at UBS; Price Target: $3.75
Centuria Capital Group (CNI)
Retained at neutral at UBS; Price Target: $2.07 from $2.03
Centuria Office REIT (COF)
Retained at neutral at UBS; Price Target: $1.07 from $1.03
Charter Hall Retail REIT (CQR)
Retained at neutral at UBS; Price Target: $4.09 from $4.20
Capstone Copper Corp. (CSC)
Retained at accumulate at Ord Minnett; Price Target: $15.00
CSL (CSL)
Retained at hold at Ord Minnett; Price Target: $198.00
Cleanaway Waste Management (CWY)
Retained at overweight at Morgan Stanley; Price Target: $3.11
Dexus (DXS)
Retained at neutral at UBS; Price Target: $7.13 from $7.34
Endeavour Group (EDV)
Retained at buy at Bell Potter; Price Target: $4.15 from $4.00
Retained at buy at Citi; Price Target: $4.30
Retained at underweight at Jarden; Price Target: $3.10 from $3.20
Retained at neutral at JPMorgan; Price Target: $3.50 from $3.70
Retained at underperform at Macquarie; Price Target: $3.40
Retained at equal-weight at Morgan Stanley; Price Target: $4.10
Retained at sector perform at RBC Capital Markets; Price Target: $4.00 from $3.85
Retained at neutral at UBS; Price Target: $4.00 from $3.75
FleetPartners Group (FPR)
Retained at outperform at Macquarie; Price Target: $3.36
Golden Horse Minerals (GHM)
Retained at speculative buy at Canaccord Genuity; Price Target: $1.50
Goodman Group (GMG)
Retained at buy at UBS; Price Target: $36.98 from $37.14
GenusPlus Group (GNP)
Retained at buy at Bell Potter; Price Target: $9.50 from $9.00
GPT Group (GPT)
Retained at buy at UBS; Price Target: $5.90 from $6.00
HomeCo Daily Needs REIT (HDN)
Retained at buy at UBS; Price Target: $1.55
HMC Capital (HMC)
Retained at buy at UBS; Price Target: $4.00
Ingenia Communities Group (INA)
Retained at neutral at UBS; Price Target: $5.00
Lifestyle Communities (LIC)
Retained at neutral at UBS; Price Target: $5.80 from $5.99
Mirvac Group (MGR)
Retained at neutral at UBS; Price Target: $2.17 from $2.15
McMillan Shakespeare (MMS)
Retained at neutral at Macquarie; Price Target: $16.40
Macquarie Group (MQG)
Retained at equal-weight at Morgan Stanley; Price Target: $223.00
National Storage REIT (NSR)
Retained at neutral at UBS; Price Target: $2.80
Origin Energy (ORG)
Retained at buy at UBS; Price Target: $14.00
Qantas Airways (QAN)
Upgraded to outperform from sector perform at RBC Capital Markets; Price Target: $11.25 from $12.00
Qube Holdings (QUB)
Retained at equal-weight at Morgan Stanley; Price Target: $4.93
RAM Essential Services Property Fund (REP)
Retained at buy at UBS; Price Target: $0.70 from $0.71
Rural Funds Group (RFF)
Retained at neutral at UBS; Price Target: $2.15 from $2.11
Region Group (RGN)
Retained at sell at UBS; Price Target: $2.20 from $2.15
Scentre Group (SCG)
Retained at neutral at UBS; Price Target: $4.10 from $4.20
Stockland (SGP)
Retained at neutral at UBS; Price Target: $5.79 from $5.82
Smartgroup Corporation (SIQ)
Retained at outperform at Macquarie; Price Target: $9.20
Santos (STO)
Retained at buy at UBS; Price Target: $8.20 from $7.80
Transurban Group (TCL)
Retained at equal-weight at Morgan Stanley; Price Target: $14.24
Vicinity Centres (VCX)
Retained at buy at UBS; Price Target: $2.85 from $2.80
Viva Energy Group (VEA)
Retained at equal-weight at Morgan Stanley; Price Target: $2.18
Woodside Energy Group (WDS)
Retained at neutral at UBS; Price Target: $28.10 from $25.60
Scans
Top Gainers
Code | Company | Last | % Chg |
|---|---|---|---|
| R8R | REGENER8 Resources NL | $0.19 | +72.73% |
| UM1 | Unity Metals Ltd | $0.30 | +42.86% |
| AKN | Auking Mining Ltd | $0.013 | +30.00% |
| NIM | Nimy Resources Ltd | $0.078 | +27.87% |
| SFM | Santa Fe Minerals Ltd | $0.405 | +26.56% |
Top Fallers
Code | Company | Last | % Chg |
|---|---|---|---|
| ECL | Excelsior Capital Ltd | $1.385 | -69.29% |
| RR1 | Reach Resources Ltd | $0.013 | -18.75% |
| ASQ | Australian Silica Quartz Group Ltd | $0.018 | -18.18% |
| RAU | Resouro Strategic Metals Inc | $0.32 | -15.79% |
| BM8 | Battery Age Minerals Ltd | $0.093 | -15.46% |
52 Week Highs
Code | Company | Last | % Chg |
|---|---|---|---|
| R8R | REGENER8 Resources NL | $0.19 | +72.73% |
| SFM | Santa Fe Minerals Ltd | $0.405 | +26.56% |
| C1X | Cosmos Exploration Ltd | $0.315 | +26.00% |
| AVE | Avecho Biotechnology Ltd | $0.012 | +20.00% |
| EMT | Emetals Ltd | $0.012 | +20.00% |
52 Week Lows
Code | Company | Last | % Chg |
|---|---|---|---|
| ECL | Excelsior Capital Ltd | $1.385 | -69.29% |
| BEO | Beonic Ltd | $0.11 | -15.39% |
| RGT | Argent Biopharma Ltd | $0.044 | -12.00% |
| XF1 | Xref Ltd | $0.09 | -10.00% |
| DUB | Dubber Corporation Ltd | $0.013 | -7.14% |
Near Highs
Code | Company | Last | % Chg |
|---|---|---|---|
| WVOL | iShares MSCI World Ex Aust Minimum Volatility ETF | $45.30 | -0.03% |
| AII | Almonty Industries Inc | $27.83 | +0.32% |
| VVLU | Vanguard Global Value Equity Active ETF | $80.01 | -0.05% |
| IHD | iShares S&P/ASX DIV Opportunities Esg Screened ETF | $17.31 | +0.93% |
| KOV | Korvest Ltd | $16.07 | +0.44% |
Relative Strength Index (RSI) Oversold
Code | Company | Last | % Chg |
|---|---|---|---|
| DDR | Dicker Data Ltd | $8.61 | +0.94% |
| GRR | Grange Resources Ltd | $0.195 | -2.50% |
| SGP | Stockland | $4.83 | +0.21% |
| CGFPC | Challenger Ltd | $100.20 | -0.13% |
| WES | Wesfarmers Ltd | $75.57 | -0.66% |
