News | Market Wraps
Evening Wrap: ASX 200 smashed again as Middle East selloff broadens to resources and gold, BHP -3.5%, NEM -6%
The S&P/ASX 200 closed 176.1 points lower, down 1.94%.

Mentioned
The S&P/ASX 200 closed 176.1 points lower, down 1.94%.
The ASX 200 sank to 8,901.2 with all eleven major sectors in the red, as the ongoing Middle East conflict drove broad de-risking across the local bourse. Meanwhile, the stronger-than-expected December quarter GDP data continued to stoke rate hike fears.
Telecommunications (XTJ) (-0.11%) was the best worst performer, as bargain hunters picked at the carcasses of beaten down online classifieds stocks, with REA Group (REA) (+1.6%) and Seek (SEK) (+1.8%) among the day’s rare gainers.
Materials (XMJ) (-2.9%) was once again the biggest drag as a rising US dollar and weaker bulk and precious metals pricing hit miners. The falls were broad, led by BHP Group (BHP) (-3.5%) and Fortescue (FMG) (-2.9%).
Endeavour Group (EDV) (-5.5%) — fell after a 1H profit drop and an interim dividend that missed expectations
Treasury Wine Estates (TWE) (+4.7%) — rose after confirming its CFO will retire later this year
AUB Group (AUB) (-2.4%) — slipped after completing its share purchase plan
Paladin Energy (PDN) (-8.4%) — sold off on profit taking across uranium producers
Silex Systems (SLX) (-9.1%) — dropped in a risk off tape that hit high beta stocks
In Asian trade, gold rose 1.3% to around US$5,155/oz while silver climbed 3% to about US$84.5/oz, as precious metals rebounded after a sharp overnight pullback. Newmont (NEM)(-6.3%) and Evolution Mining (EVN) (-4.7%), nevertheless, traded lower as mining equities lagged amid broader risk-off selling.
Lithium carbonate slipped 3.5% to 151,960 yuan/t, weighing on PLS Group (PLS) (-1.2%) and Liontown Resources (LTR) (-3.2%).
Be sure to click/scroll through for the usual reporting of the major sector and stock-specific moves, the broker responses to them, as well as all the key economic data in tonight's Evening Wrap.
Also, I have detailed technical analysis on the Nasdaq Composite and the S&P/ASX 200 in today's ChartWatch.
Let's dive in!
Today in Review
Wed 04 Mar 26, 5:23pm (AEST)
Name | Value | % Chg |
|---|---|---|
Major Indices | ||
| ASX 200 | 8,901.2 | -1.94% |
| All Ords | 9,117.1 | -1.94% |
| Small Ords | 3,614.1 | -2.62% |
| All Tech | 2,698.1 | -0.60% |
| Emerging Companies | 3,189.0 | -3.10% |
Currency | ||
| AUD/USD | 0.6994 | -0.59% |
US Futures | ||
| S&P 500 | 6,783.5 | -0.60% |
| Dow Jones | 48,331.0 | -0.47% |
| Nasdaq | 24,551.25 | -0.83% |
Name | Value | % Chg |
|---|---|---|
Sector | ||
| Communication Services | 1,693.8 | -0.11% |
| Information Technology | 1,683.4 | -0.34% |
| Energy | 10,220.8 | -0.40% |
| Health Care | 28,941.1 | -1.08% |
| Utilities | 9,952.5 | -1.13% |
| Consumer Discretionary | 3,517.4 | -1.22% |
| Industrials | 8,413.1 | -1.61% |
| Financials | 9,582.3 | -1.90% |
| Consumer Staples | 12,546.8 | -2.05% |
| Real Estate | 3,514.9 | -2.42% |
| Materials | 24,289.6 | -2.98% |
Markets
ASX 200 Session Chart
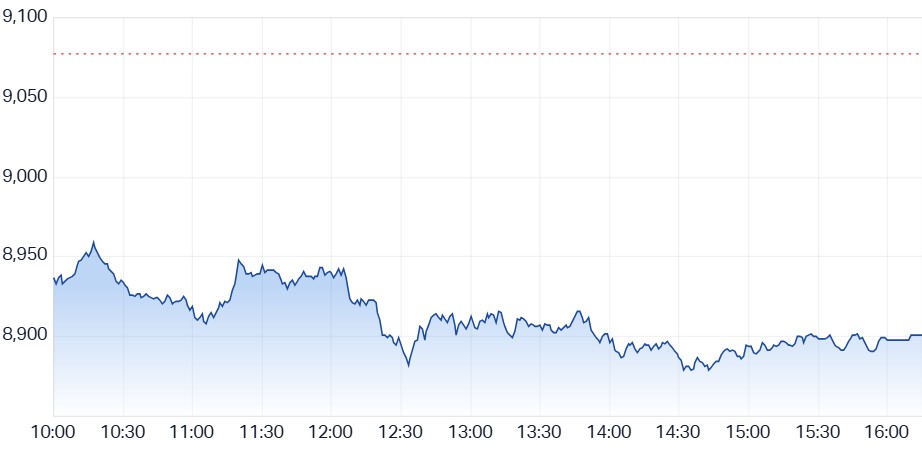
The S&P/ASX 200 (XJO) finished 176.1 points lower at 8,901.2, 1.98% from its session high and just 0.25% from its low. In the broader-based S&P/ASX 300 (XKO) advancers lagged decliners by a massive 42 to 242.
Fund flows: Don't be a hero! 🦸
Volatility doesn’t just mean prices swinging wildly from one session to the next. It can also mean the narratives traders rely on are starting to wobble!
For example, gold is supposed to rally when uncertainty rises. Right?
Resources are meant to benefit from geopolitical tension.
Value stocks should outperform when growth falters.
These stories often create powerful trends — and traders can trust them… until suddenly they can’t!
Take today. Only a couple of sessions ago, gold and resource names appeared to be clear beneficiaries of rising tensions in the Middle East. Yet today those same trades came unstuck.
That doesn’t necessarily mean these narratives are broken — sometimes trends simply become victims of their own success. When markets are falling broadly and traders are getting smacked elsewhere, profitable positions can quickly turn into a source of liquidity: winners get sold not because the story has changed, but because they offer the fastest path back toward breakeven.
This is when things get really tricky for trend followers. Trusted trends begin to falter...
In periods like this, discipline matters more than conviction. Watch the price action, manage risk meticulously, and remember the old trading adage:
There are old traders and there are bold traders — but there are no old, bold traders.
Trend followers, please don’t try to be heroes in volatile markets! ⚠️🚨
Today's best blue chip gainers
Company | Last Price | Change $ | Change % | 1mo % | 1yr % |
|---|---|---|---|---|---|
Bluescope Steel (BSL) | $27.79 | +$0.89 | +3.3% | -6.2% | +18.0% |
Xero (XRO) | $80.46 | +$1.6 | +2.0% | -16.3% | -53.7% |
Seek (SEK) | $16.06 | +$0.29 | +1.8% | -23.5% | -34.2% |
Whitehaven Coal (WHC) | $8.34 | +$0.15 | +1.8% | -10.1% | +43.1% |
Technology One (TNE) | $25.19 | +$0.42 | +1.7% | -0.4% | -15.6% |
Pro Medicus (PME) | $116.19 | +$1.91 | +1.7% | -34.6% | -55.2% |
REA Group (REA) | $164.25 | +$2.67 | +1.7% | -14.3% | -33.6% |
Sigma Healthcare (SIG) | $2.76 | +$0.03 | +1.1% | -12.1% | -5.8% |
Resmed Inc (RMD) | $36.34 | +$0.35 | +1.0% | +0.1% | -3.8% |
Woodside Energy (WDS) | $30.75 | +$0.27 | +0.9% | +22.7% | +25.6% |
AMP (AMP) | $1.230 | +$0.01 | +0.8% | -28.3% | -7.2% |
Ramelius Resources (RMS) | $4.53 | +$0.02 | +0.4% | +1.3% | +69.7% |
Ramsay Health Care (RHC) | $42.76 | +$0.17 | +0.4% | +18.6% | +27.5% |
Wisetech Global (WTC) | $44.40 | +$0.14 | +0.3% | -22.6% | -50.7% |
Fisher & Paykel Healthcare (FPH) | $34.25 | +$0.08 | +0.2% | +0.4% | +13.1% |
Light & Wonder (LNW) | $129.59 | +$0.29 | +0.2% | -25.3% | -27.3% |
Qube Holdings (QUB) | $4.97 | +$0.01 | +0.2% | +4.6% | +24.9% |
Life360 (360) | $20.38 | +$0.02 | +0.1% | -28.8% | -9.1% |
Car Group (CAR) | $25.00 | +$0.01 | +0.0% | -9.8% | -32.5% |
Cleanaway Waste (CWY) | $2.54 | $0 | 0% | +5.4% | -0.8% |
Today's worst blue chip losers
Company | Last Price | Change $ | Change % | 1mo % | 1yr % |
|---|---|---|---|---|---|
Genesis Minerals (GMD) | $7.57 | -$0.56 | -6.9% | +6.6% | +135.8% |
Newmont Corp. (NEM) | $171.86 | -$11.58 | -6.3% | +4.3% | +153.3% |
Treasury Wine Estates (TWE) | $4.24 | -$0.27 | -6.0% | -20.0% | -61.2% |
Worley (WOR) | $10.72 | -$0.6 | -5.3% | -19.9% | -27.5% |
Evolution Mining (EVN) | $16.07 | -$0.8 | -4.7% | +11.1% | +157.5% |
Ansell (ANN) | $30.42 | -$1.45 | -4.6% | -7.1% | -13.4% |
Challenger (CGF) | $8.06 | -$0.38 | -4.5% | -13.3% | +43.2% |
Dyno Nobel (DNL) | $3.34 | -$0.15 | -4.3% | -2.3% | +21.9% |
James Hardie (JHX) | $31.23 | -$1.4 | -4.3% | -5.8% | -38.9% |
Telix Pharmaceuticals (TLX) | $9.47 | -$0.4 | -4.1% | -7.2% | -66.0% |
ALS (ALQ) | $24.57 | -$1.02 | -4.0% | -0.4% | +52.2% |
ANZ Group Holdings (ANZ) | $37.94 | -$1.46 | -3.7% | +3.2% | +28.1% |
Nextdc (NXT) | $13.00 | -$0.5 | -3.7% | -2.0% | -5.5% |
Goodman Group (GMG) | $27.14 | -$1.03 | -3.7% | -13.5% | -14.3% |
Capricorn Metals (CMM) | $14.69 | -$0.55 | -3.6% | +7.0% | +89.3% |
Cochlear (COH) | $185.83 | -$6.79 | -3.5% | -30.3% | -28.7% |
Endeavour Group (EDV) | $3.84 | -$0.14 | -3.5% | +4.6% | -9.9% |
Pinnacle Investment (PNI) | $14.81 | -$0.54 | -3.5% | -13.9% | -30.7% |
BHP Group (BHP) | $55.68 | -$2.02 | -3.5% | +11.1% | +41.0% |
Perseus Mining (PRU) | $5.87 | -$0.2 | -3.3% | +5.8% | +95.0% |
ChartWatch
Nasdaq Composite Index
Analysis
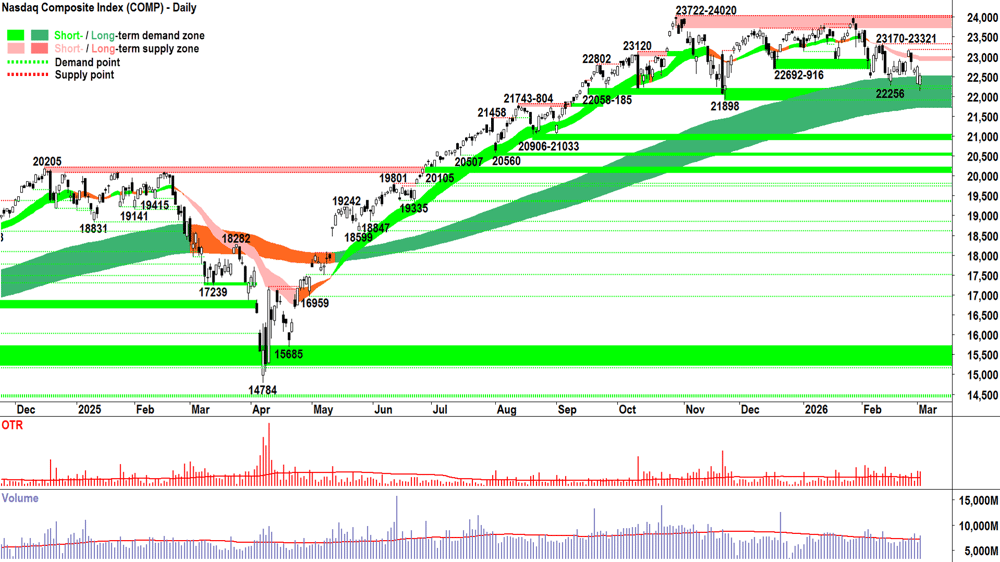
In yesterday’s update, we discussed the long term uptrend ribbon’s propensity to behave as a dynamic (i.e., moving) zone of excess demand. I said:
“To me [the long term uptrend ribbon] represents where longer term, institutional, positional buyers are absorbing supply from shorter term traders. Assuming the longer term investors have sufficient demand and the traders insufficient supply — which MOTN (More Often Than Not) is the case — when shorter term traders flip back to buying the dip, their demand aligns with long term demand and the price rallies. The long term trend perpetuates. 📈”
In the Comp chart above, we can see yet again just how robust the long term uptrend ribbon is as a zone of dynamic excess demand. It has withstood yet another vigorous test, with a nervous open — tickling the 22256 point of demand, followed by a demand-side push to rebound price towards the high of the candle.
But... the Comp still lost ground on Monday’s candle... and add in the fact that Tuesday’s low was lower than 22256 — it implies there’s quite a bit of supply-side tickling going on!
As bad as stuff seems in the world right now… we are now 9 out of the last 11 candles white-bodied.
Call it the plunge protection team (Google that term!), or call it longer term positional buying — there clearly remains an element of the market that is seeing value in Comp stocks in the long term uptrend ribbon.
That’s good for two reasons:
The long term uptrend ribbon is doing its job. ✅ Fingers crossed 🤞 it continues to do so… the bad news dissipates… we find some good news… and the bull market continues
The long term uptrend ribbon is doing its job. ✅ But if it stops doing its job, i.e., we get a strong supply-side showing (long black-bodied and or long upward pointing shadow) that cracks it… or it stops supporting price and we see more candles appearing within the ribbon / the ribbon transitions to equilibrium (amber) — then what a fantastic signal that will be for us = -R! ⚠️🚨
It really that simple. One of those two scenarios will play out. Granted, there are a zillion scenarios that could play out in the fundamentals to trigger one of our scenarios over the other — but why would be fuss about any of those!!! What would be the point? 🤷
Let’s let the media, and those who are captivated by its wall of fear, fuss about stuff they have no control over!
We simply need to control what we can control — our allocation of risk. So, we will commit to watching the trends, price action, candles, and volume… and based on these… we will manage our risk accordingly! 💪💪💪
View
1/2RP still feels valid with respect to my US portfolio risk limit (RP = Risk Position — it reflects my personal allowable capital allocation limit for my investments in US stocks. So 1/2RP is 50%, 2/3RP is 67% and FRP is 100% 🪣).
Key levels
22256 is the critical point of demand — a close below it implies the supply-side is in control of the Comp's short term price, and that the long term uptrend is likely under significant pressure = ⚠️. The short term downtrend ribbon (presently 22935-23034) is the nearest critical zone of point supply, and 23170-23321 is not far beyond that.
S&P/ASX 200 (XJO)
%20chart_4%20Mar.png)
Analysis
The ASX 200, aka the Golden Le Creuset set a record high of 9116 on 21 October last year. It took until 25 February this year to close above it.
The last record of 9200.9 from Monday feels a long way away now. How long will it take until we next close above it? 4 months like last time? 🤔
I sure hope not! But there’s no way to sugar coat it: the last 2 candles = decent damage done to the GLC’s short term uptrend. 😭
It’s worth watching today’s ChartWatch *LIVE* Webinar recording 👇. In it, I conduct a whip around the grounds, checking major global indices. It looks like we’re being lumped in with European bourses (similar black-bodied candles), rather than the downward pointing shadows enjoyed by their US counterparts.
Let’s consider what we have now for the GLC:
The price has closed below the 8987 point of demand ❎
The price has closed below the 8911 point of demand ❎
The price has closed below the short term uptrend ribbon ❎
Today’s candle is a solid supply-side showing (long black + close near low) = motivated supply ❎
Above average volume = decent supply-side engagement, demand was active, however, but lacked motivation / was running away ❎
Long term uptrend intact ✅
We can see that we’re no longer the “all ✅” scenario, intact on Monday — just two days ago!!! 🤦
No surprise there — there’s a bit going on at the moment… but the conclusion is a simple one because our analysis of the GLC guides only one decision: Portfolio Risk Limit = +R, =R, or -R?
Clearly, +R is off limits… too many crosses!
=R is a reasonable conclusion… after two, granted, solid days down — the long term uptrend remains strong and well-established.
-R is also a reasonable conclusion… again, there are just too many crosses.
So, =R or -R… which is better? 🤔
I don’t know, can’t tell the future — remember!? 🔮
Can I offer that under the circumstances, a practical and sensible course of action is this:
I will stop adding new portfolio risk. I will let existing portfolio risk roll off (i.e., as the price action and candles on individual holdings warrant specific -R’s).
If we see a quick resolution to the present supply-side pulse, i.e., a strong demand-side candle (= long white-bodied and or long downward pointing shadow) — particularly one that closes the GLC back above the short term uptrend ribbon — I can always move back to a more risk-seeking bias.
If I see the short term uptrend ribbon begin to act as a zone of dynamic demand, then I will have no choice to officially move to a 2/3RP Portfolio Risk Limit.
The rest is up to the market.
View
I am FRP 🪣 (i.e., my personal allowable capital allocation limit for my investments in Australian stocks is 100%).
Key levels
8675-8686 is the closest zone of demand (static), and beyond this, sits the long term uptrend ribbon (presently 8671-8784) (dynamic). It's hard to argue that today's candle didn't neutralise the short term uptrend... Let's hope the long term uptrend fares much better! 🤞
***NEW VIDEO DROPPED — DEFENCE + COAL REVIEWS! 📺***
ChartWatch *LIVE* Webinar
ChartWatch *LIVE* Webinars – WEEKLY Wednesday's @ 12pm AEDT
Learn more about technical analysis and trend following through real case studies on ASX stocks. Australia's premier technical analyst, Carl Capolingua, shares his unique insights on stocks as requested by viewers. Ask about a company in your portfolio or anything related to trading and investing and get Carl's expert opinion.
Places are limited so >REGISTER NOW!<
Economy
11:30 AUS GDP
Result: +0.8% q/q actual vs +0.7% q/q forecast and +0.4% q/q in December
Commentary: "GDP per capita increased for the fourth consecutive quarter and is now 0.9% higher than a year ago, the highest through the year growth since December quarter 2022," said Grace Kim, ABS Head of National Accounts.
Later this week
Thursday
11:30 AUS Goods Trade Balance (+3.89 billion m/m forecast vs +3.37 billion m/m previous)
11:30 AUS Household Spending (+0.4% m/m forecast vs -0.4% m/m previous)
Friday
00:30 USA Unemployment Claims (+215k w/w forecast vs +212k w/w previous)
00:30 USA Import Prices (+0.2% m/m forecast vs -0.1% m/m previous)
Saturday
00:30 USA Unemployment Rate (+4.3% m/m forecast vs +4.3% m/m previous)
Latest News
Interesting Movers
Trading higher
+15.7% Sunrise Energy Metals (SRL) – No news, rebounded after yesterday's sharp sell-off due to Reinstatement to Quotation and Feasibility Study Demonstrates Scalable Operation.
+8.0% Alpha HPA (A4N) – No news, bounced in the wake of the recent sharp selloff.
+4.6% EQ Resources (EQR) – No news, rise is consistent with prevailing short and long term uptrends, a regular in ChartWatch ASX Scans Uptrends list 🔎📈
+4.6% Stanmore Resources (SMR) – No news, general strength across the broader Coal sector today.
+4.4% BetaShares Australian Equities Strong Bear Complex ETF (BBOZ) – No news (Bear / short ASX stocks ETF).
+4.3% BetaShares Crude Oil ETF (OOO) – No news (crude oil price sharply higher overnight).
+3.8% Electro Optic Systems Holdings (EOS) – No news, defence stock, rise is consistent with prevailing short and long term uptrends 🔎📈
Trading lower
-11.5% (PEN) – No news, general weakness across the broader Uranium sector today.
-10.7% Metals X (MLX) – No news, general weakness across the broader Critical Minerals sector today.
-10.1% Silex Systems (SLX) – No news, general weakness across the broader Uranium sector today.
-9.4% Andean Silver (ASL) – No news, general weakness across the broader Silver sector today.
-9.3% Lotus Resources (LOT) – No news, general weakness across the broader Uranium sector today.
-8.8% Clarity Pharmaceuticals (CU6) – No news.
-8.8% BetaShares Global Gold Miners Currency Hedged ETF (MNRS) – No news, general weakness across the broader Resources sector today.
-8.8% iShares MSCI South Korea ETF (IKO) – No news, (KOSPI sharply lower today).
-8.6% African Gold (A1G) – No news, general weakness across the broader Gold sector today.
-8.6% Bannerman Energy (BMN) – Half Yearly Report and Accounts and New Board Appointments, general weakness across the broader Uranium sector today.
-8.4% Boss Energy (BOE) – No news, general weakness across the broader Uranium sector today, fall is consistent with prevailing short and long term downtrends, a regular in ChartWatch ASX Scans Downtrends list 🔎📉
-8.2% Silver Mines (SVL) – No news, general weakness across the broader Silver sector today.
-8.2% 4DMEDICAL (4DX) – No news.
-8.1% Boab Metals (BML) – No news, general weakness across the broader Silver sector today.
-7.9% G8 Education (GEM) – No news, fall is consistent with prevailing short and long term downtrends, a regular in ChartWatch ASX Scans Downtrends list 🔎📉
-7.7% Appen (APX) – No news, today's move is consistent with recent volatility.
-7.6% Paladin Energy (PDN) – No news, general weakness across the broader Uranium sector today.
-7.5% Dateline Resources (DTR) – Fast-Tracked HREE Exploration at Music Valley, general weakness across the broader Critical Minerals sector today.
-7.4% West African Resources (WAF) – Change in substantial holding, general weakness across the broader Iron Ore sector today, (UBS 7.2% from 8.3%).
-7.3% Unico Silver (USL) – No news, general weakness across the broader Silver sector today.
-7.2% Droneshield (DRO) – No news, today's move is consistent with recent volatility.
-7.2% Magellan Financial Group (MFG) – Continued negative response to .
-7.2% Australian Strategic Materials (ASM) – No news, general weakness across the broader Critical Minerals sector today.
-7.1% Westgold Resources (WGX) – Change in substantial holding, general weakness across the broader Gold sector today, (L1 Capital 7.1% from 9.3%).
-7.1% Generation Development Group (GDG) – No news, fall is consistent with prevailing short and long term downtrends, a regular in ChartWatch ASX Scans Downtrends list 🔎📉
-7.0% MA Financial Group (MAF) – No news, fall is consistent with prevailing short and long term downtrends, a recent regular in ChartWatch ASX Scans Downtrends list 🔎📉
-6.9% Genesis Minerals (GMD) – No news, general weakness across the broader Gold sector today.
-6.7% Deep Yellow (DYL) – No news, general weakness across the broader Uranium sector today.
Broker Moves
Life360 Inc (360)
Retained at buy at Bell Potter; Price Target: $40.00 from $41.50
Retained at buy at Citi; Price Target: $40.75
Retained at outperform at CLSA; Price Target: $41.00
Retained at buy at Goldman Sachs; Price Target: $38.40 from $41.20
Retained at buy at Jefferies; Price Target: $31.00 from $33.00
Retained at overweight at JPMorgan; Price Target: $38.00 from $47.00
Retained at overweight at Morgan Stanley; Price Target: $50.00
Retained at buy at Ord Minnett; Price Target: $27.00 from $50.00
Aristocrat Leisure (ALL)
Retained at outperform at Macquarie; Price Target: $63.00
ALS (ALQ)
Retained at buy at Bell Potter; Price Target: $28.00 from $25.00
Austral Resources Australia (AR1)
Retained at buy at Shaw and Partners; Price Target: $0.42 from $0.50
BHP Group (BHP)
Retained at neutral at UBS; Price Target: $52.00
Bannerman Energy (BMN)
Retained at outperform at Macquarie; Price Target: $5.60
Boss Energy (BOE)
Retained at underperform at Macquarie; Price Target: $1.30
Collins Foods (CKF)
Retained at buy at Citi; Price Target: $12.85
Coronado Global Resources Inc (CRN)
Retained at buy at UBS; Price Target: $0.36
Capstone Copper Corp. (CSC)
Retained at outperform at Macquarie; Price Target: $15.40 from $15.60
Catalyst Metals (CYL)
Retained at buy at Morgans; Price Target: $15.24 from $14.56
Endeavour Group (EDV)
Retained at buy at Citi; Price Target: $4.10
EQ Resources (EQR)
Downgraded to trim from speculative buy at Morgans; Price Target: $0.23 from $0.16
Evolution Mining (EVN)
Retained at hold at Morgans; Price Target: $17.16 from $14.50
Income Asset Management Group (IAM)
Retained at speculative buy at Morgans; Price Target: $0.07 from $0.08
Meeka Metals (MEK)
Retained at buy at Morgans; Price Target: $0.39 from $0.33
Magellan Financial Group (MFG)
Retained at neutral at Macquarie; Price Target: $8.65 from $8.80
Newmont Corporation (NEM)
Upgraded to buy from accumulate at Morgans; Price Target: $214.00 from $187.00
Neuren Pharmaceuticals (NEU)
Retained at outperform at Macquarie; Price Target: $19.10 from $21.20
Northern Star Resources (NST)
Retained at accumulate at Morgans; Price Target: $35.00 from $30.50
Pantoro Gold (PNR)
Retained at buy at Morgans; Price Target: $6.83 from $6.04
ReadyTech Holdings (RDY)
Downgraded to speculative buy from buy at Morgans; Price Target: $2.20 from $3.00
Ramelius Resources (RMS)
Retained at buy at Morgans; Price Target: $6.21 from $5.75
Regis Resources (RRL)
Retained at accumulate at Morgans; Price Target: $10.03 from $9.13
Whitehaven Coal (WHC)
Upgraded to buy from accumulate at Ord Minnett; Price Target: $9.80 from $9.40
Retained at sell at UBS; Price Target: $7.70
Waypoint REIT (WPR)
Upgraded to accumulate from hold at Morgans; Price Target: $2.75 from $2.70
Scans
Top Gainers
Code | Company | Last | % Chg |
|---|---|---|---|
| OD6 | OD6 Metals Ltd | $0.091 | +68.52% |
| SCP | Scalare Partners Holdings Ltd | $0.11 | +37.50% |
| BLG | Bluglass Ltd | $0.30 | +33.33% |
| BAS | Bass Oil Ltd | $0.081 | +26.56% |
| PSL | Paterson Resources Ltd | $0.056 | +24.44% |
Top Fallers
Code | Company | Last | % Chg |
|---|---|---|---|
| CC9 | Chariot Resources Ltd | $0.087 | -24.35% |
| VFX | Visionflex Group Ltd | $0.063 | -20.25% |
| UM1 | Unity Metals Ltd | $0.21 | -17.65% |
| TSK | Tusker Minerals Ltd | $0.072 | -17.24% |
| PL3 | Patagonia Lithium Ltd | $0.10 | -16.67% |
52 Week Highs
Code | Company | Last | % Chg |
|---|---|---|---|
| PSL | Paterson Resources Ltd | $0.056 | +24.44% |
| WEC | White Energy Company Ltd | $0.045 | +12.50% |
| HRN | Horizon Gold Ltd | $1.36 | +4.62% |
| LSA | Lachlan Star Ltd | $0.125 | +4.17% |
| CUE | CUE Energy Resources Ltd | $0.135 | +3.85% |
52 Week Lows
Code | Company | Last | % Chg |
|---|---|---|---|
| CLU | Cluey Ltd | $0.043 | -15.69% |
| HTG | Harvest Technology Group Ltd | $0.011 | -15.39% |
| EZZ | EZZ Life Science Holdings Ltd | $1.08 | -13.94% |
| NOU | Noumi Ltd | $0.10 | -13.04% |
| VIT | Vitura Health Ltd | $0.041 | -10.87% |
Near Highs
Code | Company | Last | % Chg |
|---|---|---|---|
| WVOL | iShares MSCI World Ex Aust Minimum Volatility ETF | $45.315 | +0.06% |
| AII | Almonty Industries Inc | $27.74 | -2.12% |
| VVLU | Vanguard Global Value Equity Active ETF | $80.05 | +0.55% |
| IHD | iShares S&P/ASX DIV Opportunities Esg Screened ETF | $17.15 | -2.17% |
| KOV | Korvest Ltd | $16.00 | -0.56% |
Relative Strength Index (RSI) Oversold
Code | Company | Last | % Chg |
|---|---|---|---|
| GRR | Grange Resources Ltd | $0.20 | -4.76% |
| CNEW | Vaneck China New Economy ETF | $7.71 | -2.03% |
| FLT | Flight Centre Travel Group Ltd | $11.82 | -1.09% |
| AUI | Australian United Investment Company Ltd | $10.93 | -1.53% |
| HVN | Harvey Norman Holdings Ltd | $5.51 | -0.72% |
