News | Market Wraps
Evening Wrap: ASX 200 sags as CSL, Cochlear meltdowns continue, coal stocks drive energy sector gains, WHC, NHC, YAL soar
The S&P/ASX 200 closed 23.7 points lower, down 0.27%.

Mentioned
The S&P/ASX 200 closed 23.7 points lower, down 0.27%.
The ASX 200 fell again as a March quarter CPI print of 4.6% cemented expectations of a third consecutive RBA rate rise next Tuesday, even as the softer-than-feared core reading of 3.3% gave the market a brief shot of hope.
Healthcare bore the brunt of another punishing session while utilities and energy staged sharp reversals, with lower local bond yields following the CPI release providing the catalyst.
Be sure to click/scroll through for the usual reporting of the major sector and stock-specific moves, the broker responses to them, as well as all the key economic data in tonight's Evening Wrap.
Also, I have detailed technical analysis on the Nasdaq Composite and the S&P/ASX 200 in today's ChartWatch.
Let's dive in!
Today in Review
Wed 29 Apr 26, 4:56pm (AEST)
Name | Value | % Chg |
|---|---|---|
Major Indices | ||
| ASX 200 | 8,687.0 | -0.27% |
| All Ords | 8,915.7 | -0.22% |
| Small Ords | 3,477.0 | +0.25% |
| All Tech | 2,779.0 | -0.18% |
| Emerging Companies | 3,092.3 | -0.36% |
Currency | ||
| AUD/USD | 0.7156 | -0.36% |
US Futures | ||
| S&P 500 | 7,182.25 | +0.16% |
| Dow Jones | 49,376.0 | +0.16% |
| Nasdaq | 27,282.75 | +0.42% |
Name | Value | % Chg |
|---|---|---|
Sector | ||
| Utilities | 10,343.1 | +2.18% |
| Energy | 10,914.3 | +1.27% |
| Information Technology | 1,751.6 | +0.33% |
| Real Estate | 3,493.7 | +0.31% |
| Consumer Discretionary | 3,386.8 | +0.27% |
| Industrials | 7,913.2 | +0.13% |
| Materials | 23,317.0 | -0.38% |
| Consumer Staples | 12,661.3 | -0.41% |
| Communication Services | 1,700.3 | -0.49% |
| Financials | 9,465.2 | -0.61% |
| Health Care | 25,479.4 | -1.36% |
Markets
%20intraday%20chart_29%20Apr.png)
ASX 200 Session Chart
The S&P/ASX 200 (XJO) finished 23.7 points lower at 8,687, roughly mid-range, 0.32% from its session low and 0.27% from its high. Interestingly, bucking the loss in the benchmark, in the broader-based S&P/ASX 300 (XKO) advancers narrowly beat decliners by 142 to 135.
Utilities (XUJ) (+2.2%) staged a sharp reversal — yesterday's worst sector became today's best, as local benchmark bond yields fell following the softer-than-expected CPI core reading. Utility stocks are priced much like bonds: when yields fall, their stable income streams look more attractive relative to risk-free alternatives.
Origin Energy (ORG) (+3.2%) led the recovery, reversing two sessions of sharp post-trading-update losses. AGL Energy (AGL) (+2.4%) and APA Group (APA) (+0.6%) were also firmer.
Energy (XEJ) (+1.3%) extended its winning run as Brent crude continued higher for an eighth consecutive session, reaching above US$111/bbl, with Middle East tensions maintaining a strong bid for oil and coal. Coal was particularly well supported — Newcastle coal futures gained 0.2% to US$135.45/t and SGX Australian Premium Coking Coal added 0.1% to $230/t.
New Hope Corp. (NHC) (+3.4%), Yancoal Australia (YAL) (+3.0%), and Whitehaven Coal (WHC) (+2.9%) all advanced. Woodside Energy (WDS) (+2.0%) gained on its March quarter production update and stronger LNG price guidance.
Real Estate (XPJ) (+0.3%) earned a modest reprieve as the bond yield retreat made property trust income streams comparatively more attractive. Cromwell Property (CMW) (+1.3%), Lifestyle Communities (LIC) (+1.2%), and HomeCo Daily Needs REIT (HDN) (+1.2%) were among the firmer names.
Information Technology (XIJ) (+0.3%) edged higher, benefiting from the same lower bond yield dynamic that supports long-duration growth stocks. Codan (CDA) (+15.4%) was the standout by some distance after its earnings upgrade, while the rest of the sector registered only modest gains in a quiet session.
Consumer Discretionary (XDJ) (+0.3%) ticked up as the softer CPI core reading provided mild relief for consumer-facing stocks. Myer (MYR) (+3.7%), Domino's Pizza Enterprises (DMP) (+2.5%), Eagers Automotive (APE) (+2.1%), and JB Hi-Fi (JBH) (+1.8%) were all firmer.
Health Care (XHJ) (-1.4%) was again the session's worst performer — the sector's woes showed no sign of abating. Cochlear (COH) (-3.2%) fell to its lowest close since 2015, with CSL (CSL) (-2.4%) also lower. Healthcare biotech stocks continued to underperform, with several smaller names falling sharply.
Financials (XFJ) (-0.6%) were dragged lower by the major banks, which appeared to be pricing in the near-certain RBA rate rise next week as a net negative for credit quality and margins rather than a tailwind for net interest income. Commonwealth Bank (CBA) (-1.4%), National Australia Bank (NAB) (-1.2%), and Westpac (WBC) (-1.0%) all declined.
The Gold Sub-Index (XGD) (-0.5%) slipped despite COMEX gold futures easing only modestly at 0.2% to US$4,598/oz and local bond yields falling — a positive backdrop that would typically support the sector. The divergence likely reflected fund flow rotation rather than fundamentals, with managers trimming gold positions to fund reentries into rate-sensitive sectors.
Ora Banda Mining (OBM) (-4.1%), Westgold Resources (WGX) (-3.3%), and Pantoro Gold (PNR) (-3.3%) were the hardest hit. Bellevue Gold (BGL) edged slightly lower despite reporting record free cash flow of $158 million in the March quarter.
Materials (XMJ) (-0.4%) were weaker overall, with base metals stocks dragged down by sharp overnight losses on the London Metals Exchange even as COMEX copper futures recovered 1.6% to US$6.015/lb and SGX iron ore futures gained 0.5% to US$106.95/t in the Asian session. Alcoa (AAI) (-4.0%), BHP (BHP) (-0.9%), and Rio Tinto (RIO) (-0.8%) all declined.
Rare earths stocks bucked the trend as NdPr prices in China rose 1.0% to 772,500 CNY/t — Lynas Rare Earths (LYC) (+5.2%), Arafura Rare Earths (ARU) (+4.1%), and Iluka Resources (ILU) (+3.6%) all gained.
Lithium stocks were mixed despite GFEX lithium carbonate futures surging 3.7% to 183,880 CNY/t — the sector's recent strong run appeared to prompt some profit-taking, with Liontown Resources (LTR) (+2.5%), Vulcan Energy Resources (VUL) (+2.3%), and IGO (IGO) (+1.1%) gaining while Pilbara Minerals (PLS) (-2.1%) slipped.
Uranium stocks tracked losses in global major Cameco overnight, with NexGen Energy (NXG) (-2.8%), Deep Yellow (DYL) (-2.2%), and Boss Energy (BOE) (-1.9%) all lower.
Today's best blue chip gainers
Company | Last Price | Change $ | Change % | 1mo % | 1yr % |
|---|---|---|---|---|---|
Lynas Rare Earths (LYC) | $19.68 | +$0.97 | +5.2% | -2.0% | +128.8% |
Origin Energy (ORG) | $12.03 | +$0.37 | +3.2% | -3.5% | +13.1% |
Whitehaven Coal (WHC) | $8.23 | +$0.23 | +2.9% | -10.8% | +64.9% |
Capricorn Metals (CMM) | $11.80 | +$0.31 | +2.7% | +15.5% | +27.6% |
AGL Energy (AGL) | $9.48 | +$0.22 | +2.4% | -3.3% | -10.8% |
Eagers Automotive (APE) | $23.78 | +$0.48 | +2.1% | +7.2% | +31.5% |
Woodside Energy (WDS) | $33.05 | +$0.65 | +2.0% | -4.1% | +59.4% |
Bank of Queensland (BOQ) | $6.70 | +$0.12 | +1.8% | -3.7% | -10.2% |
JB HI-FI (JBH) | $77.49 | +$1.37 | +1.8% | +2.5% | -24.6% |
Telix Pharmaceuticals (TLX) | $15.00 | +$0.26 | +1.8% | +9.9% | -44.7% |
Bluescope Steel (BSL) | $30.49 | +$0.49 | +1.6% | +14.1% | +31.9% |
Medibank Private (MPL) | $4.61 | +$0.07 | +1.5% | +4.5% | -0.9% |
Aristocrat Leisure (ALL) | $46.89 | +$0.69 | +1.5% | +1.9% | -29.8% |
Perseus Mining (PRU) | $5.59 | +$0.08 | +1.5% | +13.2% | +66.9% |
Computershare (CPU) | $29.70 | +$0.41 | +1.4% | +6.3% | -27.1% |
Brambles (BXB) | $22.07 | +$0.29 | +1.3% | -0.8% | +7.6% |
GPT (GPT) | $4.76 | +$0.06 | +1.3% | +5.1% | +2.8% |
Genesis Minerals (GMD) | $6.35 | +$0.08 | +1.3% | +13.0% | +64.5% |
Dyno Nobel (DNL) | $3.23 | +$0.04 | +1.3% | +3.5% | +42.3% |
Suncorp (SUN) | $16.98 | +$0.21 | +1.3% | +3.4% | -16.2% |
Today's worst blue chip losers
Company | Last Price | Change $ | Change % | 1mo % | 1yr % |
|---|---|---|---|---|---|
Westgold Resources (WGX) | $5.90 | -$0.2 | -3.3% | +8.9% | +98.7% |
Cochlear (COH) | $90.00 | -$3. | -3.2% | -47.1% | -67.2% |
Newmont (NEM) | $153.58 | -$5.11 | -3.2% | +4.6% | +87.1% |
Seek (SEK) | $13.64 | -$0.42 | -3.0% | -0.7% | -36.0% |
Nextdc (NXT) | $14.00 | -$0.42 | -2.9% | +13.4% | +24.8% |
CSL (CSL) | $125.78 | -$3.12 | -2.4% | -12.2% | -49.9% |
Ramelius Resources (RMS) | $3.59 | -$0.08 | -2.2% | +2.0% | +36.5% |
Wisetech Global (WTC) | $41.31 | -$0.91 | -2.2% | +7.7% | -53.3% |
PLS Group (PLS) | $5.98 | -$0.13 | -2.1% | +16.1% | +297.3% |
A2 Milk Company (A2M) | $7.13 | -$0.15 | -2.1% | -24.5% | -12.8% |
Block, (XYZ) | $97.95 | -$1.5 | -1.5% | +13.3% | +6.1% |
SGH (SGH) | $38.10 | -$0.57 | -1.5% | -8.8% | -25.4% |
Light & Wonder (LNW) | $114.61 | -$1.71 | -1.5% | -7.5% | -13.5% |
Atlas Arteria (ALX) | $4.82 | -$0.07 | -1.4% | +9.8% | -6.8% |
Commonwealth Bank of Australia (CBA) | $172.18 | -$2.43 | -1.4% | -0.8% | +3.3% |
National Australia Bank (NAB) | $39.67 | -$0.5 | -1.2% | -5.5% | +9.8% |
Sonic Healthcare (SHL) | $19.93 | -$0.25 | -1.2% | -3.4% | -23.6% |
W.H. Soul Pattinson (SOL) | $41.10 | -$0.51 | -1.2% | +2.1% | +10.5% |
South32 (S32) | $4.26 | -$0.05 | -1.2% | +5.7% | +54.9% |
ChartWatch
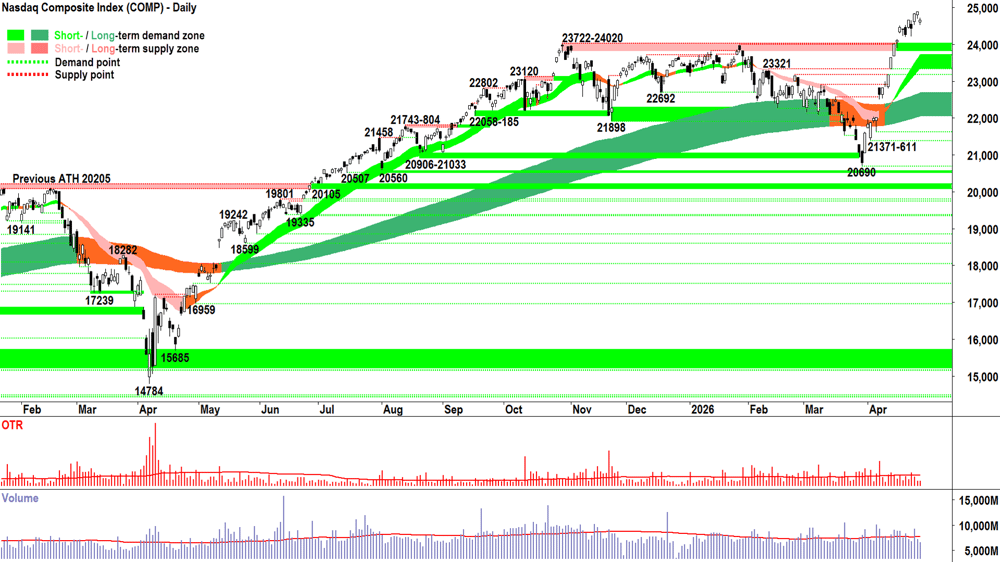
Nasdaq Composite Index
Analysis
Nothing is particularly unusual about the Comp's present price action. It reminds me of the period in mid-May to June last year as markets were emerging from the reciprocal tariffs plunge (oh, so many fantastic memories You Know Who has created for us investors! 🤦)
At that point, the Comp had logged a similar “defying all logic at the time” rally, but it didn't quite push to new highs as it has done this time, though…. Still, very similar in terms of scale and angle of attack.
The vibration between 19242 and 18599 was telling. Sure, there was the odd modest supply-side candle showing, but compared to the massive wall of demand that preceded them — insufficient to cause us-trend followers any concern. When the short term uptrend resumed, the Compl entered a new low-volatility upward grind that added thousands of points.
Hey, it’s just plain foolish to say: "This time is exactly like that time, and what happened then is about to happen now." 🙅
The future is unknown. Anything can happen. Prediction is futile.
Simply, that period is a template for what can happen in strongly demand side controlled markets. Particularly in those where cash is so far behind the curve — investors just didn't have time or the confidence to trust the rally... leaving them painfully short of risk against a rising benchmark.
At some point, though, there's a quelling of FOMO, there’s a chink in the HOFU armour… and so, a bit of excess supply trickles into the market.
Prices pause, or in some cases where supply is insufficient to meaningfully tip the balance, simply don’t go up as fast as they were before.
Soon enough, the reasons that drove the initial rally reassert, stimulating FOMO among cash holders to drive them to BTD, and HOFU among stock holders to drive them to withhold supply. Off we go again 📈.
The critical takeaway is this: We don’t know what’s going to happen next. But we do know what the fingerprints of excess demand and excess supply look like in price action and candles.
So, given Tuesday’s candle is insufficient a supply side showing to do anything with respect to my portfolio management — I simply continue to watch for:
Fingerprints of excess demand:
Rising peaks and rising troughs = FOMO + HOFU + BTD ✅
White-bodied candles and or those with downward pointing shadows (longer = more motivated excess demand, plus above average volume = greater size) = FOMO + HOFU + BTD ✅
Old points of supply act as points of demand (e.g., 23722-24020 and ST trend ribbon, presently 23343-23707) = BTD ✅
Fingerprints of excess supply:
Falling peaks and falling troughs = 🚫FOMO + 🚫HOFU + STR⚠️
Black-bodied candles and or those with upward pointing shadows (longer = more motivated excess supply, plus above average volume = greater size) = 🚫FOMO + 🚫HOFU + STR ⚠️
Old points of supply fail to act as points of demand (e.g., close below 23722-24020 or close below ST trend ribbon) = 🚫BTD ⚠️
The rest is up to the market. If I see something I don’t like, then I’ll adjust my risk accordingly.
View
FRP (RP = Risk Position — it reflects my personal allowable capital allocation limit for my investments in US stocks. So 1/2RP is 50%, 2/3RP is 67% and FRP is 100% 🪣). I don't know what's going to happen next, only that right now, the chart above remains a picture of excess demand.
Key levels
There are no key supply zones to contend with. The old all-time high supply zone of 23722-24020 will likely act as a short term zone of demand, however the short-term trend ribbon (presently 23343-23707) is now the key zone of demand. If the price closes back below this range, the supply-side is very likely back in control of the Comp's price.
S&P/ASX 200 (XJO)
%20chart_29%20Apr.png)
Analysis
The Old Tin Pot. What can you say about it? 🤷
It is what it is! Still, all the headlines about "longest losing streak since whenever" kinda smacks of finance journo's with very little to add to the conversation.
The pullback over the last 7 black candles is modest compared to the rally that preceded it, and the long term trend ribbon remains dark green / up.
Yes, the short term trend is a bit cactus again, and we've underperformed US stocks by about a gazillion percent... But what you're seeing in the chart above is just the usual OTP ebb and flow. There's nothing really interesting to see here.
Which is kinda the point.
Equilibrium is the opposite of control — demand or supply side. Given that as trend followers we don't care which side is in control as long as one or the other is doing the business = Equilibrium is our worst case scenario! 🙅
When neither is capable of holding control of price, we tend to just sit on our hands. But! Can I present Exhibit B: The S&P/ASX 200 Equal Weight Index (XEW).
%20chart_29%20Apr.png)
S&P/ASX 200 Equal Weight Index (XEW) chart
The XEW gives every company an equal voice, creating a more democratic snapshot of the market. Rather than being dominated by a handful of giants, it reflects what the “average” stock is doing — often a better gauge of underlying breadth and sentiment.
By contrast, the S&P/ASX 200 (XJO) concentrates influence in its largest constituents. So, when the big banks or big miners move, it can mask terrible weaknesses elsewhere — like in Information Technology, Consumer Discretionary, and Healthcare (sound familiar!?).
Consider two things here. Today's candle on the XEW was white — that's both very interesting and encouraging — as today wasn't as bad as certain clueless finance journo's might have thought, but also, what would our Portfolio Risk Limit be if we were using the XEW as our benchmark instead of the XJO? 🤔
I'd argue, probably the same... 1/2RP — given the price action and candles were very decent on the 21-Apr close back above the long term trend ribbon. So, no big deal there...
But also consider, that in this chart — with the long term trend under immense pressure (i.e., amber, falling, looks like its being rejected again!) — it will take far less to flip back to 1/3RP than using the XJO chart (long term uptrend ribbon still up).
Anyways, food for thought, and something to keep an eye on. 🧐
View
I propose 1/2RP 🪣 has been totally vindicated here (i.e., my personal allowable capital allocation limit for my investments in Australian stocks is 50%).
Key levels
9201, the all time high, is the key point of supply. Below it there likely remains a degree of trepidation among market participants. A close above the last peak at 9022 would be constructive.
The OTP is below the short-term trend ribbon (presently 8796-8808) — definitely not a good look! The long term uptrend (presently 8686-8864) must hold to stave off a retracement back to the 8262-8379 lows.
(Glossary of acronyms! MOTN: More Often Than Not | FOMO: Fear Of Missing Out | HOFU: Holding On For Upside | BTD: Buy The Dip | STR: Sell The Rally | RP: Risk Position)
***NEW VIDEO DROPPED — LITHIUM & RARE EARTHS REVIEWS 📺***
ChartWatch *LIVE* Webinar
ChartWatch *LIVE* Webinars – WEEKLY Wednesday's @ 12pm AEDT
Learn more about technical analysis and trend following through real case studies on ASX stocks. Australia's premier technical analyst, Carl Capolingua, shares his unique insights on stocks as requested by viewers. Ask about a company in your portfolio or anything related to trading and investing and get Carl's expert opinion.
Places are limited so >REGISTER NOW!<
Economy
Today
11:30 AUS March Consumer Price Index (CPI)
Headline:
Monthly: +1.3% m/m vs +1.3% m/m forecast and +0.0% m/m in February
Annualised: +4.6% p.a. vs +4.8% p.a. forecast and +3.7% p.a. in February
Trimmed Mean:
Monhtly: +0.3% m/m vs +0.3% m/m forecast and +0.2% m/m in February
Annualised: +3.5% p.a. vs +3.5% p.a. forecast and +3.3% p.a. in February
Reader: Roughly as expected, but expectations were for a big bump given fuel price spike during the sample period. Importantly, no negative sticker shock, but it still doesn't change the equation for next RBA meeting where most economists continue to forecast another +0.25% to the cash rate. +3.5% ain't 2-3%! 🚫
Later this week
Wednesday
22:30 USA March Core Durable Goods Orders (+0.4% m/m forecast vs +0.9% m/m in February)
Thursday
04:00 USA Federal Reserve FOMC Meeting & Statement of Monetary Policy
Fed Funds Rate: 3.75% p.a. forecast, unchanged
FOMC Press Conference with Chairman Powell @ 04:30
11:30 CHN April Purchasing Managers Index ("PMI")
Manufacturing: 50.1 forecast vs 50.4 in March
Non-manufacturing: 49.9 forecast vs 50.1 in March
22:30 USA March Core Personal Consumption Expenditures ("PCE") Data
PCE Index: +0.3% m/m forecast vs +0.4% m/m in February
Personal Income: +0.3% m/m forecast vs -0.1% m/m in February
Personal Spending: +0.9% m/m forecast vs +0.5% m/m in February
Friday
ALL DAY CHN Labor Day Holiday
Saturday
11:30 USA April Institute for Supply Management ("ISM") PMI
Manufacturing: 53.1 forecast vs 52.7 in March
Manufacturing prices: 80.0 forecast vs 78.3 in March
Latest News
Interesting Movers
Trading higher
+32.9% OOh!media (OML) — Received a takeover offer from Pacific Equity Partners valuing the outdoor advertising group at approximately $754 million, or $1.40 per share
+15.4% Codan (CDA) — Upgraded its full-year FY26 earnings outlook to approximately $235 million, with net profit of approximately $170 million
+2.0% Woodside Energy (WDS) — Flagged stronger LNG prices ahead after average realised prices rose 11% to US$63 per barrel of oil equivalent in the March quarter, with quarterly production of 45.2 mmboe down 8% quarter-on-quarter due to cyclone disruptions
+2.0% Capricorn Metals (CMM) — Delivered $143 million in operating cash flow and approximately $204 million in revenue in the March quarter
+1.3% Suncorp (SUN) — Issued Australian dollar-denominated wholesale capital notes to institutional and wholesale investors under a new funding program
+0.4% ANZ (ANZ) — Agreed to buy out its merchant payments joint venture partner, French company Worldline, for $89 million
Trading lower
-31.3% G8 Education (GEM) — Suspended operations at approximately 40 childcare locations and announced cost-cutting across its support office, responding to weaker occupancy and rising sector pressures
-3.2% Cochlear (COH) – Ceasing to be a substantial holder and Ceasing to be a substantial holder (The Bank of New York Mellon Corporation, Australian Super), general weakness across the broader HealthCare sector today, fall is consistent with prevailing short and long term downtrends, one of the most Featured (highest conviction) stocks in ChartWatch ASX Scans Downtrends list 🔎📉
-2.4% CSL (CSL) – No news, general weakness across the broader HealthCare sector today, fall is consistent with prevailing short and long term downtrends, one of the most Featured (highest conviction) stocks in ChartWatch ASX Scans Downtrends list 🔎📉
-0.5% Ramelius Resources (RMS) — Lifted full-year FY26 cost guidance to $1,900–$2,050 per ounce from $1,700–$1,900, with diesel costs alone adding approximately $35 per ounce
Broker Moves
Life360 Inc (360)
Initiated at outperform at Macquarie; Price Target: $32.20
6K Additive, Inc (6KA)
Retained at speculative buy at Bell Potter; Price Target: $1.45
Retained at buy at Morgans; Price Target: $1.30
Adairs (ADH)
Retained at buy at Morgans; Price Target: $2.00 from $2.40
Atlas Arteria (ALX)
Retained at trim at Morgans; Price Target: $4.22 from $4.31
Amcor Plc (AMC)
Retained at outperform at Macquarie; Price Target: $84.63 from $86.50
Aurelia Metals (AMI)
Retained at buy at Jefferies; Price Target: $0.38
Retained at outperform at Macquarie; Price Target: $0.40
Retained at buy at Moelis Australia; Price Target: $0.42 from $0.44
Retained at buy at Ord Minnett; Price Target: $0.50 from $0.45
Retained at buy at Shaw and Partners; Price Target: $0.50 from $0.42
American Rare Earths (ARR)
Retained at speculative buy at Bell Potter; Price Target: $0.65
Accent Group (AX1)
Retained at buy at Morgans; Price Target: $1.10 from $1.30
BCI Minerals (BCI)
Retained at speculative buy at Canaccord Genuity; Price Target: $0.50
Bega Cheese (BGA)
Downgraded to hold from outperform at CLSA; Price Target: $5.90 from $6.60
Biome Australia (BIO)
Retained at buy at Bell Potter; Price Target: $1.00
Beacon Lighting Group (BLX)
Retained at buy at Morgans; Price Target: $2.50 from $3.20
Beach Energy (BPT)
Retained at hold at Bell Potter; Price Target: $1.15
Retained at buy at Canaccord Genuity; Price Target: $1.43 from $1.35
Retained at sell at Citi; Price Target: $1.10
Retained at underweight at Jarden; Price Target: $1.10 from $1.20
Retained at underperform at Macquarie; Price Target: $0.78 from $0.77
Retained at underweight at Morgan Stanley; Price Target: $1.18
Retained at sector perform at RBC Capital Markets; Price Target: $1.05 from $1.10
Retained at sell at UBS; Price Target: $1.10
Cuscal (CCL)
Initiated at buy at Canaccord Genuity; Price Target: $6.00
Coronado Global Resources Inc (CRN)
Retained at buy at Argonaut Securities; Price Target: $0.60
Retained at hold at Bell Potter; Price Target: $0.30 from $0.38
Retained at hold at Jefferies; Price Target: $0.29 from $0.35
Retained at buy at UBS; Price Target: $0.38 from $0.42
Domino's Pizza Enterprises (DMP)
Retained at neutral at Citi; Price Target: $17.50
Retained at buy at UBS; Price Target: $24.00
Deep Yellow (DYL)
Upgraded to speculative buy from hold at Argonaut Securities; Price Target: $2.40
Retained at speculative buy at Canaccord Genuity; Price Target: $3.01
EQ Resources (EQR)
Retained at buy at Canaccord Genuity; Price Target: $0.50
Greatland Resources (GGP)
Retained at buy at Citi; Price Target: $16.00
Retained at underweight at Jarden; Price Target: $8.50 from $8.30
Retained at neutral at Macquarie; Price Target: $15.00
Retained at sell at Moelis Australia; Price Target: $11.90 from $11.50
Retained at outperform at RBC Capital Markets; Price Target: $15.60
Global Lithium Resources (GL1)
Retained at outperform at Macquarie; Price Target: $0.80 from $0.70
Karoon Energy (KAR)
Retained at positive at E&P; Price Target: $2.10
Retained at buy at Jarden; Price Target: $2.55
Retained at neutral at Macquarie; Price Target: $2.00
Retained at sector perform at RBC Capital Markets; Price Target: $2.30 from $2.35
Lovisa Holdings (LOV)
Retained at buy at Morgans; Price Target: $32.50 from $36.80
Meteoric Resources NL (MEI)
Retained at speculative buy at Ord Minnett; Price Target: $0.25
Minerals 260 (MI6)
Retained at speculative buy at Bell Potter; Price Target: $1.35 from $0.90
Mayfield Group Holdings (MYG)
Initiated at buy at Moelis Australia; Price Target: $2.65
Predictive Discovery (PDI)
Retained at speculative buy at Canaccord Genuity; Price Target: $1.66 from $1.64
Pantoro Gold (PNR)
Retained at buy at Argonaut Securities; Price Target: $6.50
Retained at buy at Moelis Australia; Price Target: $5.31 from $4.90
Retained at buy at Ord Minnett; Price Target: $5.90 from $6.35
Retained at buy at UBS; Price Target: $6.20
Reliance Worldwide Corporation (RWC)
Retained at hold at Morgans; Price Target: $3.25 from $3.00
Step One Clothing (STP)
Retained at hold at Morgans; Price Target: $0.20 from $0.29
Technology One (TNE)
Downgraded to neutral from buy at UBS; Price Target: $32.00 from $38.70
Treasury Wine Estates (TWE)
Retained at neutral at Citi; Price Target: $4.25
Retained at neutral at UBS; Price Target: $4.00
Universal Store Holdings (UNI)
Retained at buy at Morgans; Price Target: $9.60 from $10.60
Vitrafy Life Sciences (VFY)
Retained at speculative buy at Bell Potter; Price Target: $3.00 from $2.25
Viridis Mining and Minerals (VMM)
Retained at speculative buy at Ord Minnett; Price Target: $3.60
WA1 Resources (WA1)
Retained at speculative buy at Bell Potter; Price Target: $24.80
Whitehaven Coal (WHC)
Retained at hold at Bell Potter; Price Target: $8.10
Retained at hold at CLSA; Price Target: $8.10 from $7.80
Upgraded to positive from neutral at E&P; Price Target: $8.80 from $8.50
Retained at buy at Jefferies; Price Target: $10.00
Upgraded to neutral from underweight at JPMorgan; Price Target: $8.70 from $8.30
Retained at outperform at Macquarie; Price Target: $9.75 from $9.50
Retained at accumulate at Morgans; Price Target: $9.20 from $9.05
Retained at buy at Ord Minnett; Price Target: $9.90
Retained at buy at UBS; Price Target: $9.10 from $9.60
Scans
Top Gainers
Code | Company | Last | % Chg |
|---|---|---|---|
| AM7 | Arcadia Minerals Ltd | $0.051 | +45.71% |
| IAM | Income Asset Management Group Ltd | $0.023 | +35.29% |
| EPM | Eclipse Metals Ltd | $0.02 | +33.33% |
| OML | Ooh!Media Ltd | $1.13 | +32.94% |
| PKY | Pathkey.Ai Ltd | $0.052 | +26.83% |
Top Fallers
Code | Company | Last | % Chg |
|---|---|---|---|
| GSS | Genetic Signatures Ltd | $0.085 | -39.29% |
| MDX | Mindax Ltd | $0.019 | -36.67% |
| GEM | G8 Education Ltd | $0.165 | -31.25% |
| KEY | KEY Petroleum Ltd | $0.16 | -28.89% |
| OCT | Octava Minerals Ltd | $0.033 | -25.00% |
52 Week Highs
Code | Company | Last | % Chg |
|---|---|---|---|
| AM7 | Arcadia Minerals Ltd | $0.051 | +45.71% |
| PKY | Pathkey.Ai Ltd | $0.052 | +26.83% |
| AEG | Aland Equity Group Ltd | $0.059 | +18.00% |
| CDA | Codan Ltd | $42.00 | +15.45% |
| AVE | Avecho Biotechnology Ltd | $0.012 | +9.09% |
52 Week Lows
Code | Company | Last | % Chg |
|---|---|---|---|
| MDX | Mindax Ltd | $0.019 | -36.67% |
| GEM | G8 Education Ltd | $0.165 | -31.25% |
| IR1 | Iris Metals Ltd | $0.08 | -12.09% |
| BMT | Beamtree Holdings Ltd | $0.115 | -11.54% |
| DXB | Dimerix Ltd | $0.215 | -10.42% |
Near Highs
Code | Company | Last | % Chg |
|---|---|---|---|
| BILL | iShares Core Cash ETF | $100.64 | +0.02% |
| GLN | Galan Lithium Ltd | $0.535 | -0.93% |
| HGBL | Betashares Global Shares Currency Hedged ETF | $80.65 | -0.11% |
| MQGPG | Macquarie Group Ltd | $103.30 | +1.09% |
| AHL | Adrad Holdings Ltd | $1.33 | 0.00% |
Relative Strength Index (RSI) Oversold
Code | Company | Last | % Chg |
|---|---|---|---|
| DGL | DGL Group Ltd | $0.395 | 0.00% |
| SPK | Spark New Zealand Ltd | $1.675 | -1.47% |
| LDX | Lumos Diagnostics Holdings Ltd | $0.15 | 0.00% |
| DTR | Dateline Resources Ltd | $0.24 | +2.13% |
| COH | Cochlear Ltd | $90.00 | -3.23% |
