
News | Market Wraps
Evening Wrap: ASX 200 flat as tech stocks soar, massive gains for WTC, XRO and 360, as retail stocks smashed on FWC call
The S&P/ASX 200 closed 5.0 points lower, down 0.06%.

Mentioned
The S&P/ASX 200 closed 5.0 points lower, down 0.06%.
The ASX 200 barely moved at the index level as a decisive rotation split the market in two — technology, gold, and materials surged on a global growth narrative, while retailers, banks, real estate, and healthcare were hammered by a Fair Work Commission wage decision that keeps an August RBA rate hike firmly in play.
Be sure to click/scroll through for the usual reporting of the major sector and stock-specific moves, the broker responses to them, as well as all the key economic data in tonight's Evening Wrap. Also, I have detailed technical analysis on the Nasdaq Composite and the S&P/ASX 200 in today's ChartWatch.
Let's dive in!
Today in Review
Tue 02 Jun 26, 5:21pm (AEST)
Name | Value | % Chg |
|---|---|---|
Major Indices | ||
| ASX 200 | 8,724.4 | -0.06% |
| All Ords | 8,966.0 | -0.04% |
| Small Ords | 3,505.0 | -0.18% |
| All Tech | 3,062.7 | +3.89% |
| Emerging Companies | 3,071.9 | +0.22% |
Currency | ||
| AUD/USD | 0.7178 | +0.25% |
US Futures | ||
| S&P 500 | 7,604.0 | -0.12% |
| Dow Jones | 51,018.0 | -0.23% |
| Nasdaq | 30,527.25 | -0.13% |
Name | Value | % Chg |
|---|---|---|
Sector | ||
| Information Technology | 1,957.5 | +4.71% |
| Materials | 25,512.9 | +1.25% |
| Communication Services | 1,665.0 | +1.07% |
| Energy | 10,486.2 | +0.35% |
| Industrials | 8,143.0 | +0.04% |
| Utilities | 9,578.8 | -0.41% |
| Consumer Discretionary | 3,532.6 | -0.60% |
| Financials | 9,065.2 | -1.00% |
| Health Care | 22,334.2 | -1.21% |
| Consumer Staples | 11,618.4 | -1.31% |
| Real Estate | 3,545.5 | -1.44% |
Markets
%20intraday%20chart_2%20Jun.png)
ASX 200 Session Chart
The S&P/ASX 200 (XJO) finished 5.0 points lower at 8,724.4, 1.14% from its session low and just 0.6% from its high. Despite what appeared to be a strong showing at benchmark level, in the broader-based S&P/ASX 300 (XKO) advancers lagged decliners by a very disturbing 99 to 184.
The above market breadth numbers kinda say it all: it was a typical two-speed Australian share market today with clear winners and losers. The intraday chart above apes those of certain sectors only, as you will see below — and the trick for investors each day is to try and guess which sectors will be favoured and which will be shunned!
Information Technology (XIJ) (+4.7%) delivered its best single session in months, playing catch-up to two months of surging US technology stocks as offshore peers continued to hit records overnight. Stocks with international revenues led the charge. Life360 (360) (+13.3%), WiseTech Global (WTC) (+7.9%), Xero (XRO) (+7.5%), and Catapult Sports (CAT) (+6.5%) all surged. Pro Medicus (PME) (+10.8%) — not strictly an IT sector constituent but a healthcare technology SaaS company — soared in sympathy with the broader tech bid.
Communication Services (XTJ) (+1.1%) caught the tech sector's tailwind as online classified names rallied sharply. Seek (SEK) (+7.0%), CAR Group (CAR) (+5.1%), and REA Group (REA) (+4.5%) were all strongly higher.
%20chart_2%20Jun.png)
ASX 200 Information Technology Sector Index (XIJ) chart
The Gold Sub-Index (XGD) (+2.8%) received a significant boost as COMEX gold futures gained 1.3% to US$4,566/oz and COMEX silver futures surged 2.5% to US$77.11/oz, with precious metals finding renewed safe-haven demand amid the Middle East's continued uncertainty.
Northern Star Resources (NST) (+13.6%) provided the sector's biggest jolt after agreeing to engage constructively with activist investor Elliott Management, which called for a CEO search to be expedited and a banker appointed to consider a sale. Vault Minerals (VAU) (+3.1%), Regis Resources (RRL) (+2.8%), and Ramelius Resources (RMS) (+2.5%) also gained.
%20chart_2%20Jun.png)
ASX 200 Materials Sector Index (XMJ) chart
Materials (XMJ) (+1.2%) were well supported by strong overnight LME base metals gains — aluminium hit a new multi-year high while copper, nickel, and tin also rose strongly. COMEX copper futures added a further 1.2% to US$6.63/lb in Asian trade after rallying 2.6% overnight. BHP (BHP) (+1.4%) closed at a fresh all-time high of $63.37, with Rio Tinto (RIO) (+1.5%), South32 (S32) (+1.7%), Capstone Copper (CSC) (+3.7%), Sandfire Resources (SFR) (+2.5%), and Nickel Industries (NIC) (+2.4%) all advancing.
There was a far larger list of losing sectors...
Real Estate (XPJ) (-1.5%) was the session's worst performer as the Fair Work Commission's 4.75% wage increase — slightly above market expectations — added to concerns that higher labour costs will compress retail and hospitality tenants' margins, weakening their ability to service leases. A Citi note flagging the decision keeps an August RBA rate hike in play added a second headwind via rising benchmark bond yields. Stockland (SGP) (-4.3%), Vicinity Centres (VCX) (-4.0%), GPT Group (GPT) (-2.7%), and Dexus (DXS) (-2.7%) all fell.
Consumer Staples (XSJ) (-1.3%) and Consumer Discretionary (XDJ) (-0.6%) were both also caught by the FWC decision — the wage increase compresses retail margins directly while also raising the prospect of higher rates, which squeeze consumer spending capacity. Domino's Pizza Enterprises (DMP) (-5.9%), JB Hi-Fi (JBH) (-5.4%), and Myer (MYR) (-4.0%) bore the sharpest discretionary losses. Treasury Wine Estates (TWE) (-2.6%), Woolworths (WOW) (-1.9%), and Coles (COL) (-0.7%) were the staples laggards. Scentre Group (SCG) (-2.4%) also fell.
%20chart_2%20Jun.png)
ASX 200 Healthcare Sector Index (XHJ) chart
Health Care (XHJ) (-1.2%) resumed its underperformance in what continues to be the worst-performing major sector on the ASX over the past 12 months. Cochlear (COH) (-4.3%), Telix Pharmaceuticals (TLX) (-3.0%), ResMed (RMD) (-2.1%), and CSL (CSL) (-1.7%) all fell.
Financials (XFJ) (-1.0%) were caught between two headwinds — the FWC wage decision keeping an August rate hike in play elevated credit quality concerns, while the broader rotation out of domestic-economy-exposed stocks weighed on sentiment. ANZ (ANZ) (-3.0%), AMP (AMP) (-4.4%), Westpac (WBC) (-1.5%), and National Australia Bank (NAB) (-0.9%) all declined.
%20chart_2%20Jun.png)
ASX 200 Financials Sector Index (XFJ) chart
Utilities (XUJ) (-0.4%) were softer as investors rotated away from defensive sectors. AGL Energy (AGL) (-1.6%) and Origin Energy (ORG) (-0.6%) were both lower.
Uranium stocks suffered another bruising session despite COMEX uranium futures gaining 1.6% on Monday. Paladin Energy (PDN) (-5.9%), Deep Yellow (DYL) (-5.3%), Bannerman Energy (BMN) (-4.1%), and Boss Energy (BOE) (-3.5%) all fell sharply.
Lithium stocks tracked a 3.9% decline in GFEX lithium carbonate futures to CNY 172,980/t — Pilbara Minerals (PLS) (-2.8%), and Mineral Resources (MIN) (-2.1%) were all lower. IGO's (IGO) (-4.8%) fortunes were further hampered by a rating downgrade to neutral from overweight by JPMorgan.
Today's best ASX Top 300 gainers
Company | Last Price | Change $ | Change % | 1mo % | 1yr % |
|---|---|---|---|---|---|
SRG Global (SRG) | $3.66 | +$0.52 | +16.6% | +21.6% | +139.2% |
Northern Star Resources (NST) | $21.03 | +$2.52 | +13.6% | -0.3% | -1.1% |
Life360 (360) | $23.07 | +$2.7 | +13.3% | +8.7% | -28.2% |
Gentrack (GTK) | $3.40 | +$0.37 | +12.2% | -30.0% | -69.6% |
Pro Medicus (PME) | $160.08 | +$15.62 | +10.8% | +15.4% | -43.3% |
Firefly Metals (FFM) | $2.32 | +$0.18 | +8.4% | +28.5% | +131.8% |
Wisetech Global (WTC) | $42.23 | +$3.08 | +7.9% | -2.9% | -59.9% |
Xero (XRO) | $87.00 | +$6.05 | +7.5% | +4.9% | -53.5% |
Seek (SEK) | $13.17 | +$0.86 | +7.0% | -5.0% | -45.7% |
Catapult Sports (CAT) | $3.95 | +$0.24 | +6.5% | +17.2% | -29.7% |
Santana Minerals (SMI) | $0.585 | +$0.035 | +6.4% | -0.8% | +8.3% |
Minerals 260 (MI6) | $0.865 | +$0.045 | +5.5% | +11.6% | +476.7% |
Southern Cross Gold (SX2) | $10.80 | +$0.54 | +5.3% | +11.8% | +63.6% |
Car (CAR) | $27.01 | +$1.32 | +5.1% | +5.7% | -24.0% |
Metals X (MLX) | $1.650 | +$0.075 | +4.8% | +16.2% | +226.7% |
Lendlease (LLC) | $2.69 | +$0.12 | +4.7% | -17.7% | -53.2% |
Tabcorp (TAH) | $0.815 | +$0.035 | +4.5% | -30.0% | +11.6% |
REA (REA) | $157.99 | +$6.75 | +4.5% | -9.8% | -34.5% |
Predictive Discovery (PDI) | $0.780 | +$0.03 | +4.0% | -12.8% | +100.0% |
Dicker Data (DDR) | $11.30 | +$0.43 | +4.0% | +23.1% | +39.3% |
Today's worst ASX Top 300 losers
Company | Last Price | Change $ | Change % | 1mo % | 1yr % |
|---|---|---|---|---|---|
Vulcan Steel (VSL) | $5.18 | -$0.71 | -12.1% | +1.8% | -18.8% |
TPG Telecom (TPG) | $3.70 | -$0.3 | -7.5% | -12.1% | +0.8% |
G8 Education (GEM) | $0.135 | -$0.01 | -6.9% | -20.6% | -88.8% |
Paladin Energy (PDN) | $10.63 | -$0.67 | -5.9% | -13.9% | +77.5% |
4DMEDICAL (4DX) | $3.85 | -$0.24 | -5.9% | -5.9% | +1032.4% |
Domino's Pizza Enterprises (DMP) | $16.55 | -$1.03 | -5.9% | +3.1% | -23.9% |
Immutep (IMM) | $0.050 | -$0.003 | -5.7% | -21.9% | -83.1% |
JB HI-FI (JBH) | $71.05 | -$4.08 | -5.4% | -9.6% | -34.9% |
Deep Yellow (DYL) | $1.510 | -$0.085 | -5.3% | -17.7% | +18.9% |
Kingsgate Consolidated (KCN) | $5.99 | -$0.33 | -5.2% | -2.0% | +181.2% |
Polynovo (PNV) | $1.105 | -$0.06 | -5.2% | +10.5% | -12.3% |
IDP Education (IEL) | $2.25 | -$0.12 | -5.1% | -27.9% | -42.0% |
IGO (IGO) | $9.55 | -$0.48 | -4.8% | +25.0% | +152.0% |
Select Harvests (SHV) | $3.79 | -$0.18 | -4.5% | -0.3% | -18.5% |
Healius (HLS) | $0.320 | -$0.015 | -4.5% | -36.0% | -63.0% |
AMP (AMP) | $1.530 | -$0.07 | -4.4% | +4.1% | +20.0% |
Bapcor (BAP) | $0.440 | -$0.02 | -4.3% | -20.7% | -88.3% |
Stockland (SGP) | $3.79 | -$0.17 | -4.3% | -5.7% | -30.6% |
Cochlear (COH) | $96.74 | -$4.33 | -4.3% | -3.5% | -64.0% |
ChartWatch
Nasdaq Composite Index
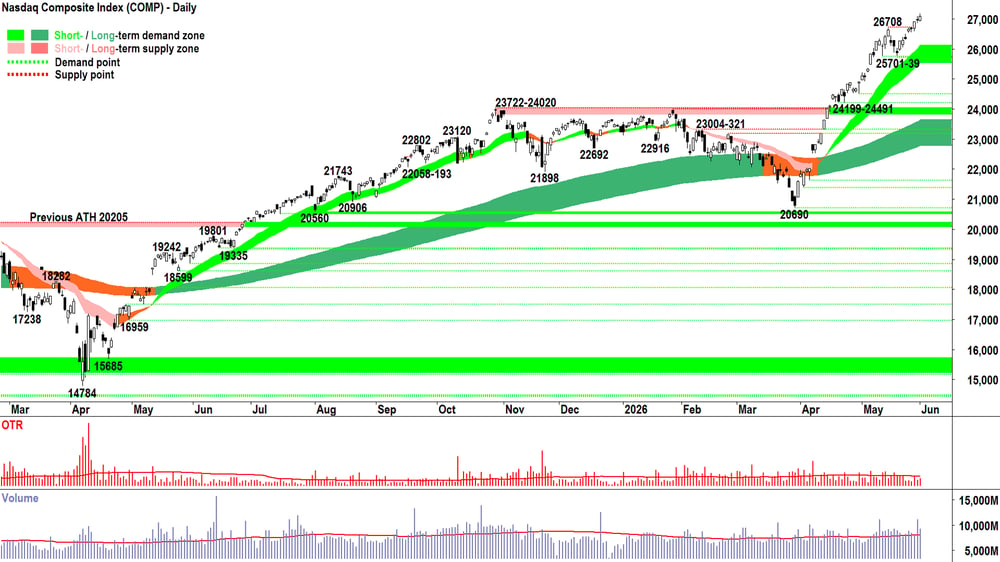
Analysis
I missed a candle there due to WA Day... We're us West-Aussies celebrate everything about the greatest state in the country, or as President Trump would likely opine, 'the world'. 🏆
Well, we do have all the iron ore... and the GST. So who are you to argue!? 😉
Speaking about the greatest, it's good to see that in my absence, the Comp has remained the greatest chart in the world, or perhaps even the history of the world!
Sure, there was a smidge of an upward pointing shadow on Monday, and above average volume = some churn / desire among the supply side to transact, but this chart remains for me a picture of excess demand.
I don't know when that's going to change and nor do I care. It will change when it changes = black-bodied candles and or upward pointing shadows. The 'fingerprints of excess supply' as I call them. ⚠️
When I see those, you can be sure a commensurate risk management response will be forthcoming. Until then, this object is in motion... it will remain in motion until acted upon by an unbalanced external force... or something like that (remembering back to Year 10 physics!)
(If you are reading ChartWatch for the first time: yes, none of this sounds like 'technical analysis'! It didn't mention the RSI, the Stochastics, the MACD, the Elliott Wave count, Gann cycles, Bollinger Bands, Pivot Points, Fibonacci projections or retracements, or any of those fancy technical indicators most self-proclaimed technical analysts will quote. Why? Well, firstly, because the future is unknown, which means prediction is futile. These indicators tend to be used by most technical analysts to predict what will happen next — so, for me, this renders them useless by default! Worse, they generally fail to address the most basic tenet of economics: D vs S = P. That's where my analysis lives — everything I do is aimed at understanding D or S and how they're interracting to create P. I follow trends, price action, and candles — taking what I'm given and never asking for more! For I am proudly a true Disciple of Demand and Supply! 💪)
View
FRP (RP = Risk Position — it reflects my personal allowable capital allocation limit for my investments in US stocks. So 1/2RP is 50%, 2/3RP is 67% and FRP is 100% 🪣).
Key levels
26708 is the key point of supply. 25739 is the closest point of demand, then there's the short term uptrend ribbon (presently 24473-25052). If the price closes back below this range, the supply-side is very likely back in control of the Comp's price.
S&P/ASX 200 (XJO)
%20chart_2%20Jun.png)
Analysis
Not much changed here either... at least from the price level of the OTP from my last update: Friday's close 8731.7 vs Today's close 8729.4. 🥱
But, dig a little deeper, and today's rather long downward pointing shadow does hint at persistent BTD activity. So did yesterday's candle, albeit tiny, with its downward pointing shadow.
Downward pointing shadow = BTD. It's that simple.
Then, we saw it on Friday coming out of Thursday's big black candle (blend those two candles together — and yep — downward pointing shadow), and if we go a bit further back, in the little zebra pattern that punctuated the 8485 trough (two downward pointing shadows through blending there, also).
BTD is a critical indicator of demand side control. In the present case, just bubbling under the surface, quietly hoovering up stock dumped by nervous sellers early in a trading session. Not wanting to show their hand too much... patient for now in their strategic buying.
What will be the catalyst that triggers the demand side to abandon their current cautious approach and become more aggressive... i.e., to give in to FOMO?
At the same time giving the supply side more reason to HOFU? 🤔
(FOMO and HOFU are the other two critical indicators that the price is under demand side control)
BTD + FOMO + HOFU = 📈
I wouldn't have a clue... Can't tell the future, remember!? 🚫🔮 But I do know that in addition to a 'few downward pointing shadows' that are already in the mix, we must see:
Long white-bodied candles with closes at-or-very-near their highs
A higher trough to 8561
A close above the short- and long-term trend ribbons (presently 8682-8737)
And ideally, above average volume to signal greater demand side engagement as well as the clearing of the pesky supply that continues to lurk around the middle of the broader 8262-9201 trading range
If we see the above, then there's a very good chance the OTP is going to challenge the top of that trading range again. If we don't, then it's very likely going to be a long, painful and choppy journey around the equilibrium that is so beautifully defined by my two (very amber 🟧🟧) trend ribbons! 🪓🪓🪓
View
I remain 1/3RP 🪣 on the OTP (i.e., my personal allowable capital allocation limit for my investments in Australian stocks is 33%).
Key levels
The short- and long-term downtrend ribbons (presently 8686-8750) combine to represent the key zone of supply. Beyond that, it's the not so lucky 8888 level! Demand is the 8262-8379 zone. Below that... 😱!
(Glossary of acronyms! Old Tin Pot (OTP): S&P/ASX 200 | MOTN: More Often Than Not | FOMO: Fear Of Missing Out | HOFU: Holding On For Upside | BTD: Buy The Dip | STR: Sell The Rally | RP: Risk Position)
ChartWatch *LIVE* Webinar
ChartWatch *LIVE* Webinars – WEEKLY Wednesday's @ 12pm AEDT
Learn more about technical analysis and trend following through real case studies on ASX stocks. Australia's premier technical analyst, Carl Capolingua, shares his unique insights on stocks as requested by viewers. Ask about a company in your portfolio or anything related to trading and investing and get Carl's expert opinion.
Places are limited so >REGISTER NOW!<
Economy
Today
AUS May Building Approvals
Result: -3.4% m/m vs -1.5% m/m forecast and -10.5% m/m in April (down, worse than expected)
Later this week
Tuesday
22:00 USA JOLTS Job Openings (6.87 million forecast vs 6.87 million in April)
Wednesday
09:30 AUS March Quarter Gross Domestic Product (GDP) (+0.5% q/q forecast vs +0.8% q/q in December)
22:00 USA May ISM Services Purchasing Managers Index (PMI) (53.7 forecast vs 53.6 in April)
Thursday
13:00 AUS Reserve Bank of Australia Governor Michelle Bullock speaks
Friday
20:30 USA May Non-Farm Payrolls
Employment change: +85,000 forecast vs 115,000 in April
Average hourly earnings: +0.3% m/m forecast vs +0.2% m/m in April
Unemployment rate: +4.3% forecast vs +4.3% in April
Latest News
Interesting Movers
Trading higher
+103.0% Energy World Corporation (EWC) - announced the sale of its Siemens gas and steam turbines to Hallador Energy for US$350 million, with net proceeds of approximately US$331 million expected after transaction costs and refurbishment expenses.
+16.6% SRG Global (SRG) - secured $1.85 billion in new contracts spanning long-dated agreements with Origin Energy, Fortescue, BHP Mitsubishi Alliance, Alcoa, and others; upgraded FY26 EBITDA guidance to the top end of its $164–168 million range and initiated FY27 EBITDA guidance at $190–200 million, above market consensus.
+16.2% Tasmea (TEA) - announced the acquisition of specialist contractor Maxim Group for up to $254 million, comprising $112 million in cash, $72 million in scrip, and up to $70 million in earn-out payments; the deal expands exposure to data centres, electrification, and infrastructure, and is expected to be immediately EPS accretive with approximately 31% pro forma FY26 uplift excluding synergies.
+13.6% Northern Star Resources (NST) - confirmed it was open to takeover approaches and agreed to engage constructively with activist investor Elliott Management, which called for the CEO search to be expedited and a banker appointed to consider a sale of the company.
+6.0% Pengana Capital (PGC) - lodged a product disclosure statement for its new AI Private Opportunities Trust, with the cornerstone offer increased from $100 million to $150 million and fully subscribed before the broader offer opens.
+3.6% DroneShield (DRO) - secured a $24.9 million contract to supply counter-drone systems to the US Department of War's Joint Interagency Task Force 401, including $19.3 million in committed value and $5.6 million in optional scope over five years.
Trading lower
-7.5% TPG Telecom (TPG) - half-year trading update at its investor day flagged EBITDA delivery weighted toward a stronger second half, while management noted customers were becoming more cautious and value-focused amid cost-of-living pressures; full-year guidance was unchanged.
-5.9% 4DMedical (4DX) - launched the CLEAR clinical evidence program to expand its CT:VQ technology into the acute pulmonary embolism market, entering a research agreement with Mass General Brigham; the stock fell despite the program targeting a US$3 billion addressable market, likely reflecting the time and cost required to validate and commercialise the pathway.
-2.6% Nine Entertainment (NEC) - completed the conversion of its regional television assets in Northern NSW and Darwin into affiliate operations, with WIN Network now owning those businesses.
-1.2% Collins Foods (CKF) - acquired eight KFC restaurants in Bavaria, Germany, from JJ Restaurant GmbH & Co, increasing its German store network by approximately 50% and expanding presence across three states accounting for more than half the country's population and around 54% of its economic output.
Broker Moves
Austco Healthcare (AHC)
Retained at buy at Bell Potter; Price Target: $0.45 from $0.55
Aristocrat Leisure (ALL)
Retained at overweight at Morgan Stanley; Price Target: $63.90
Atlas Arteria (ALX)
Retained at neutral at Citi; Price Target: $4.80
Artrya (AYA)
Retained at buy at Bell Potter; Price Target: $6.10
BHP Group (BHP)
Retained at neutral at UBS; Price Target: $60.00
Boss Energy (BOE)
Retained at overweight at Morgan Stanley; Price Target: $1.80
Breville Group (BRG)
Retained at buy at Citi; Price Target: $39.85
BlueScope Steel (BSL)
Retained at outperform at Macquarie; Price Target: $35.95 from $33.80
Retained at equal-weight at Morgan Stanley; Price Target: $29.00
Commonwealth Bank of Australia (CBA)
Retained at underweight at Morgan Stanley; Price Target: $130.00
Chalice Mining (CHN)
Retained at buy at UBS; Price Target: $3.00
Collins Foods (CKF)
Retained at neutral at Citi; Price Target: $10.45
Coronado Global Resources Inc (CRN)
Retained at buy at UBS; Price Target: $0.38
Catalyst Metals (CYL)
Retained at buy at UBS; Price Target: $9.25
Domino's Pizza Enterprises (DMP)
Retained at neutral at Citi; Price Target: $17.50
Deterra Royalties (DRR)
Retained at overweight at Morgan Stanley; Price Target: $4.45
Dexus (DXS)
Retained at neutral at UBS; Price Target: $6.68
Fortescue (FMG)
Retained at underweight at Morgan Stanley; Price Target: $18.85
Retained at neutral at UBS; Price Target: $19.40
Gemlife Communities Group (GLF)
Retained at overweight at Morgan Stanley; Price Target: $5.40
Genesis Minerals (GMD)
Retained at buy at UBS; Price Target: $10.15
Guzman Y Gomez (GYG)
Retained at sell at Citi; Price Target: $18.35
HUB24 (HUB)
Retained at accumulate at Ord Minnett; Price Target: $99.00
Harvey Norman Holdings (HVN)
Retained at equal-weight at Morgan Stanley; Price Target: $5.40
IGO (IGO)
Downgraded to neutral from overweight at JPMorgan; Price Target: $9.50 from $8.50
Retained at underweight at Morgan Stanley; Price Target: $6.85
ikeGPS Group (IKE)
Retained at buy at Bell Potter; Price Target: $1.21
Iluka Resources (ILU)
Retained at overweight at Morgan Stanley; Price Target: $7.95
JB Hi-Fi (JBH)
Retained at underweight at Morgan Stanley; Price Target: $70.70
James Hardie Industries Plc (JHX)
Retained at overweight at Morgan Stanley; Price Target: $38.00
LendLease Group (LLC)
Retained at buy at Citi; Price Target: $6.30
Retained at equal-weight at Morgan Stanley; Price Target: $3.89
Retained at hold at Ord Minnett; Price Target: $2.85 from $3.05
Lynas Rare Earths (LYC)
Retained at equal-weight at Morgan Stanley; Price Target: $20.45
Mirvac Group (MGR)
Retained at equal-weight at Morgan Stanley; Price Target: $2.05
Minerals 260 (MI6)
Retained at buy at UBS; Price Target: $1.10
Mineral Resources (MIN)
Retained at buy at UBS; Price Target: $83.00
Many Peaks Minerals (MPK)
Retained at speculative buy at Canaccord Genuity; Price Target: $1.90 from $1.85
Macquarie Group (MQG)
Retained at overweight at Morgan Stanley; Price Target: $263.00
Metcash (MTS)
Retained at equal-weight at Morgan Stanley; Price Target: $3.30
National Australia Bank (NAB)
Retained at underweight at Morgan Stanley; Price Target: $37.20
Newmont Corporation (NEM)
Retained at buy at UBS; Price Target: $195.00
Netwealth Group (NWL)
Retained at hold at Ord Minnett; Price Target: $25.00
Paladin Energy (PDN)
Retained at buy at Canaccord Genuity; Price Target: $15.65 from $16.00
Retained at overweight at Morgan Stanley; Price Target: $13.65
Paragon Care (PGC)
Downgraded to hold from buy at Bell Potter; Price Target: $0.17 from $0.30
PLS Group (PLS)
Retained at equal-weight at Morgan Stanley; Price Target: $5.60
PlaySide Studios (PLY)
Retained at buy at Shaw and Partners; Price Target: $0.28 from $0.44
Pro Medicus (PME)
Retained at buy at Goldman Sachs; Price Target: $197.00 from $200.00
Retained at buy at Morgans; Price Target: $210.00
Retained at sector perform at RBC Capital Markets; Price Target: $195.00
PMET Resources Inc (PMT)
Retained at buy at Shaw and Partners; Price Target: $1.50 from $1.20
Pantoro Gold (PNR)
Retained at buy at UBS; Price Target: $6.20
Praemium (PPS)
Retained at buy at Ord Minnett; Price Target: $1.05
Peter Warren Automotive Holdings (PWR)
Retained at positive at E&P; Price Target: $1.70 from $2.50
Retained at buy at Jarden; Price Target: $1.55 from $2.50
Retained at overweight at Morgan Stanley; Price Target: $2.10
Retained at hold at Morgans; Price Target: $0.73 from $1.24
ReadyTech Holdings (RDY)
Retained at buy at Shaw and Partners; Price Target: $2.80
REA Group (REA)
Retained at overweight at Morgan Stanley; Price Target: $230.00
Reece (REH)
Retained at overweight at Morgan Stanley; Price Target: $18.00
Rio Tinto (RIO)
Retained at equal-weight at Morgan Stanley; Price Target: $171.50
Retained at neutral at UBS; Price Target: $183.00
Reliance Worldwide Corporation (RWC)
Retained at equal-weight at Morgan Stanley; Price Target: $3.50
South32 (S32)
Retained at overweight at Morgan Stanley; Price Target: $4.85
Retained at buy at UBS; Price Target: $5.10
Scentre Group (SCG)
Downgraded to underperform from neutral at Macquarie; Price Target: $3.45
Sandfire Resources (SFR)
Retained at neutral at Citi; Price Target: $12.20
Retained at underweight at Morgan Stanley; Price Target: $16.00
SGH (SGH)
Retained at overweight at Morgan Stanley; Price Target: $50.00
Stockland (SGP)
Retained at equal-weight at Morgan Stanley; Price Target: $4.90
Superloop (SLC)
Retained at buy at UBS; Price Target: $3.50
Westpac Banking Corporation (WBC)
Retained at underweight at Morgan Stanley; Price Target: $34.00
Wesfarmers (WES)
Retained at equal-weight at Morgan Stanley; Price Target: $79.30
Whitehaven Coal (WHC)
Retained at overweight at Morgan Stanley; Price Target: $9.55
Retained at buy at UBS; Price Target: $9.10
Scans
Top Gainers
Code | Company | Last | % Chg |
|---|---|---|---|
| EWC | Energy World Corporation Ltd | $0.073 | +102.78% |
| LKO | Lakes Blue Energy NL | $0.495 | +52.31% |
| TR8 | Tarrina Resources Ltd | $0.022 | +46.67% |
| CCE | Carnegie Clean Energy Ltd | $0.135 | +35.00% |
| AR9 | Archtis Ltd | $0.092 | +29.58% |
Top Fallers
Code | Company | Last | % Chg |
|---|---|---|---|
| FAR | FAR Ltd | $0.29 | -53.60% |
| 14D | 1414 Degrees Ltd | $0.12 | -25.00% |
| JAT | Jatcorp Ltd | $0.155 | -22.50% |
| BEO | Beonic Ltd | $0.074 | -22.11% |
| EGA | Eastern Gas Corporation Ltd | $0.125 | -21.88% |
52 Week Highs
Code | Company | Last | % Chg |
|---|---|---|---|
| KTK | Ktek Aerosystems Ltd | $0.49 | +27.27% |
| DSM | Desert Minerals Ltd | $0.40 | +17.65% |
| RR1 | Reach Resources Ltd | $0.014 | +16.67% |
| SRG | SRG Global Ltd | $3.66 | +16.56% |
| TEA | Tasmea Ltd | $8.03 | +16.21% |
52 Week Lows
Code | Company | Last | % Chg |
|---|---|---|---|
| FAR | FAR Ltd | $0.29 | -53.60% |
| BEO | Beonic Ltd | $0.074 | -22.11% |
| EGA | Eastern Gas Corporation Ltd | $0.125 | -21.88% |
| FLX | FELIX Group Holdings Ltd | $0.051 | -21.54% |
| PLY | Playside Studios Ltd | $0.125 | -19.36% |
