
ASX 200 stocks hitting fresh 52-week highs and lows – Week 23
A volatile ASX 200 and commodity markets has produced a thin list of stocks making 52-week highs and lows.


Source: Shutterstock
Mentioned
Welcome back to the 52-Week Series, where we recap the S&P/ASX 200 stocks that have hit fresh yearly highs and lows over the past week. Tracking this data point helps identify emerging trends across various stocks and sectors.
When clusters of stocks within a sector reach new highs or lows, it often points to meaningful underlying drivers such as shifting commodity prices, changing demand patterns (such as AI, pivots into defensive sectors, consumer weakness etc), or companies beating/missing earnings expectations.
52-Week highs and lows by sector
Materials: 6 Highs, 0 Lows
Telecommunications: 1 High, 2 Lows
Energy: 1 High, 0 Lows
Discretionary: 0 Highs, 3 Lows
Real Estate: 0 Highs, 3 Lows
Industrials: 0 Highs, 2 Lows
Financials: 0 Highs, 2 Lows
Staples: 0 Highs, 2 Lows
Technology: 0 Highs, 1 Low
Health Care: 0 Highs, 0 Lows
Utilities: 0 Highs, 0 Lows
What Does the Data Tell Us?
Not a whole lot: It was a fairly quiet week for the 52-week list amid broader ASX 200 and commodity market volatility. The index sits around 5% below its 2 March record, but ~2% above the recent 20 May low. That backdrop produced a thin list of new highs, largely in lithium, steel and industrial materials stocks. The 52-week lows, meanwhile, eased to 15 from 27 in the prior week, reflecting an ongoing recovery in retailers. The S&P/ASX 200 Discretionary index is up more than 8% since 12 May, while Healthcare, Industrials and Materials (namely packaging names) also stopped bleeding. Even so, the lows list remains relatively long. The recurring theme is stocks caught in earnings-downgrade cycles or fresh, materially downbeat updates. The local exchange operator ASX experienced a notable 13% selloff last Tuesday after flagging a major capex and cost blowout, guiding to FY27 capex of $180–200 million (versus prior expectations of $160–180 million) and FY27 total expense growth of 18–21% (against analyst forecasts of just 10%).
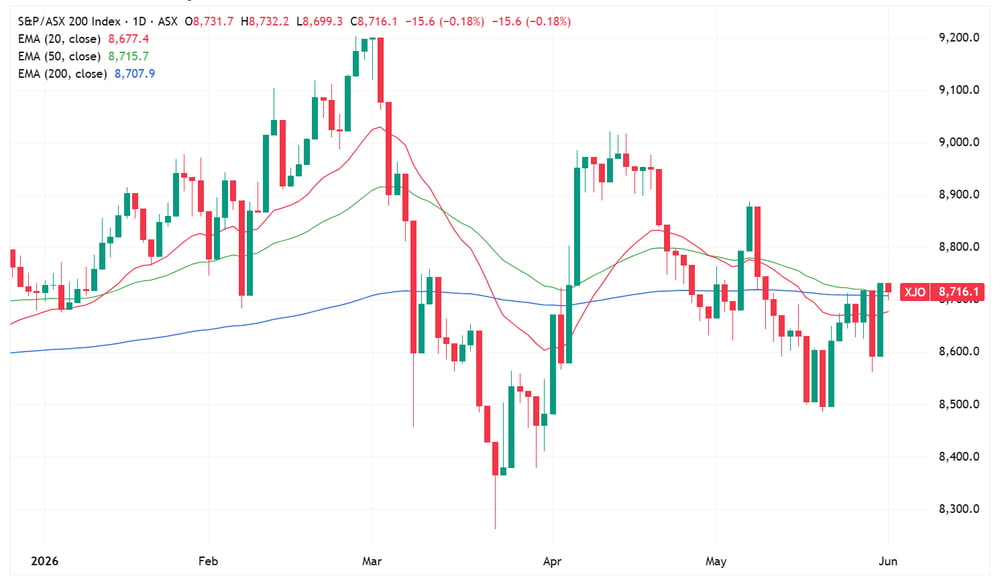
S&P/ASX 200 daily chart (Source: TradingView)
ASX 200 stocks making 52-week highs
Ticker | Company | Close | Sector | 1 Week | 1 Year |
|---|---|---|---|---|---|
Mineral Resources | $73.47 | Materials | 5.5% | 297.1% | |
IGO | $9.58 | Materials | 4.0% | 152.8% | |
Sims | $26.82 | Materials | 15.5% | 74.4% | |
Dyno Nobel | $3.76 | Materials | 2.2% | 42.4% | |
Bluescope Steel | $31.72 | Materials | 5.2% | 31.1% | |
Superloop | $3.47 | Telecommunications | -1.1% | 27.1% | |
Santos | $7.81 | Energy | -5.2% | 19.6% | |
Deterra Royalties | $4.50 | Materials | -0.9% | 18.7% |
S&P/ASX 200 stocks and sectors that hit a 52-week high in the past week, sorted by one-year returns. Data as at Friday, 29 May 2026.
ASX 200 stocks making 52-week lows
Ticker | Company | Close | Sector | 1 Week | 1 Year |
|---|---|---|---|---|---|
Lendlease | $2.72 | Real Estate | -3.6% | -52.7% | |
Seek | $12.41 | Telecommunications | -2.4% | -48.8% | |
IDP Education | $2.23 | Discretionary | -16.5% | -42.5% | |
REA Group | $149.00 | Telecommunications | -2.0% | -38.2% | |
ASX | $46.23 | Financials | -22.3% | -36.6% | |
The A2 Milk Company | $5.37 | Staples | -5.1% | -32.1% | |
Austal | $4.02 | Industrials | 4.7% | -31.1% | |
Endeavour Group | $2.88 | Staples | -6.5% | -30.8% | |
Iress | $6.01 | Technology | 4.9% | -30.5% | |
Brambles | $16.57 | Industrials | -3.2% | -29.4% | |
Nick Scali | $14.43 | Discretionary | 7.9% | -24.9% | |
Dexus | $5.61 | Real Estate | -7.7% | -20.3% | |
Pexa Group | $10.71 | Real Estate | -8.9% | -15.1% | |
Perpetual | $15.90 | Financials | -2.3% | -9.7% | |
Tabcorp | $0.77 | Discretionary | 14.1% | 5.5% |
S&P/ASX 200 stocks and sectors that hit a 52-week low in the past week, sorted by one-year returns. Data as at Friday, 29 May 2026.
