
News | Market Wraps
Evening Wrap: ASX 200 win streak grows as BEN, NAB lead banks, SaaSpocalypse resumes as price targets slashed
The S&P/ASX 200 closed 21.4 points higher, up 0.24%.

Mentioned
The S&P/ASX 200 closed 21.4 points higher, up 0.24%.
The ASX 200 edged higher as investors held their nerve through a fragile, fast-fraying ceasefire, with the day-old Iran-US truce already under serious strain. The Strait of Hormuz remained largely shut and Israeli strikes on Beirut cast doubt over weekend peace talks.
The session was a tale of sharp reversals — energy and defensives bounced back, while a broker report slashing price targets on 14 tech and telco names sent yesterday's biggest winners into a tailspin.
In stock specific news:
Bendigo and Adelaide Bank (BEN) (+8.4%) — posted a better-than-expected March quarter cash profit of $138 million, lifting net profit after tax 7.6%, cutting operating expenses 4.1%, and raising its net interest margin by 6 basis points quarter-on-quarter
Orora (ORA) (-18.0%) — downgraded earnings guidance for its Saverglass business and paused its on-market buyback, with operations at its UAE facility directly disrupted by the Middle East conflict
Sandfire Resources (SFR) (-4.0%) — flagged full-year copper production would land in the lower half of guidance after heavy rainfall, maintenance issues, and delays accessing higher-grade ore hit the March quarter
Electro Optic Systems (EOS) (-4.9%) — Federal Court handed down a $4 million penalty for failing to disclose a material revenue downgrade for 14 weeks back in 2022
Charter Hall (CHC) (+2.5%) — secured a $1.2 billion direct property mandate from an existing institutional client
Be sure to click/scroll through for the usual reporting of the major sector and stock-specific moves, the broker responses to them, as well as all the key economic data in tonight's Evening Wrap.
Also, I have detailed technical analysis on the Nasdaq Composite and the S&P/ASX 200 in today's ChartWatch.
Let's dive in!
Today in Review
Thu 09 Apr 26, 5:18pm (AEST)
Name | Value | % Chg |
|---|---|---|
Major Indices | ||
| ASX 200 | 8,973.2 | +0.24% |
| All Ords | 9,168.9 | +0.04% |
| Small Ords | 3,478.8 | -0.95% |
| All Tech | 2,656.3 | -4.39% |
| Emerging Companies | 3,105.3 | -1.82% |
Currency | ||
| AUD/USD | 0.7036 | -0.11% |
US Futures | ||
| S&P 500 | 6,808.5 | -0.22% |
| Dow Jones | 48,038.0 | -0.22% |
| Nasdaq | 25,028.75 | -0.18% |
Name | Value | % Chg |
|---|---|---|
Sector | ||
| Energy | 10,995.8 | +2.58% |
| Utilities | 10,425.2 | +1.92% |
| Financials | 10,031.1 | +1.21% |
| Consumer Staples | 12,745.4 | +0.85% |
| Communication Services | 1,724.0 | -0.12% |
| Industrials | 8,143.2 | -0.15% |
| Real Estate | 3,399.5 | -0.16% |
| Materials | 23,721.3 | -0.31% |
| Consumer Discretionary | 3,524.2 | -0.89% |
| Health Care | 28,012.4 | -1.21% |
| Information Technology | 1,615.2 | -6.46% |
Markets
%20intraday%20chart_9%20Apr.png)
ASX 200 Session Chart
The S&P/ASX 200 (XJO) finished 21.4 points higher at 8,973.2, 0.77% from its session low and smack–bang on its session high. Despite the benchmark clawing its way back into the black, in the broader-based S&P/ASX 300 (XKO) advancers lagged decliners by a disappointing 115 to 171.
Energy (XEJ) (+2.6%) snapped back sharply after yesterday's historic selloff, as Brent crude futures rebounded 2.5% to US$97.08/bbl in the Asian session — a reminder that the Strait of Hormuz is far from open for business, with just seven vessels clearing the waterway in the 24 hours since the ceasefire supposedly began.
Woodside Energy (WDS) (+4.0%) and Karoon Energy (KAR) (+4.2%) recovered a portion of Wednesday's heavy losses. Ampol (ALD) (+3.5%) also rallied after a deal with Export Finance Australia was struck to underwrite its oil purchases alongside Viva Energy.
Utilities (XUJ) (+1.9%) bounced back in kind, with the sector's defensive characteristics back in demand as ceasefire optimism faded. Origin Energy (ORG) (+2.4%) and AGL Energy (AGL) (+1.0%) were both firmer.
Financials (XFJ) (+1.2%) were a stabilising force, anchored by a standout quarterly update from Bendigo and Adelaide Bank (BEN) (+8.4%). National Australia Bank (NAB) (+2.2%) was the best of the big four.
Consumer Staples (XSJ) (+0.8%) ticked higher as investors rotated back toward defensives. Coles (COL) (+1.2%) and Woolworths (WOW) (+1.1%) both edged up.
Resources (XJR) (+0.2%) managed a marginal gain, masking a split within the sector. Iron ore stocks were hit — as COMEX benchmark iron ore futures on the SGX fell 2.1% to US$105.20/t — with Fortescue (FMG) (-2.4%), Champion Iron (CIA) (-2.0%), and Rio Tinto (RIO) (-1.1%) all lower.
Rare earths and critical minerals stocks were the notable exception, moving higher in what appeared to reflect growing investor conviction that elevated geopolitical tensions will only intensify demand for these materials over the long run. Arafura Rare Earths (ARU) (+6.8%), Develop Global (DVP) (+4.4%), Iluka Resources (ILU) (+3.0%), and Lynas Rare Earths (LYC) (+2.0%) all rose.
Information Technology (XIJ) (-6.5%) was the session's biggest loser — a jarring about-face after yesterday's 7.3% surge. A wide-ranging report from Morgan Stanley in which the broker slashed price targets on 14 ASX-listed technology and telco names, some by as much as 42%, triggered heavy selling across the sector. WiseTech Global (WTC) (-10.9%), Xero (XRO) (-8.6%), and Catapult Sports (CAT) (-8.3%) were among the biggest losers.
Stock | MS Old Target | MS New Target | Target Cut% |
|---|---|---|---|
CAR Group (CAR) | $38 | $32 | -15.8% |
Catapult Group (CAT) | $6.50 | $5.00 | -23.1% |
Hipages Group (HPG) | $1.00 | $0.78 | -22.0% |
Megaport (MP1) | $10 | $9 | -10.0% |
Nuix (NXL) | $3.75 | $2.50 | -33.3% |
PEXA Group (PXA) | $17.50 | $15.50 | -11.4% |
Pro Medicus (PME) | $275 | $200 | -27.3% |
REA Group (REA) | $250 | $230 | -8.0% |
SEEK (SEK) | $28 | $21 | -25.0% |
Technology One (TNE) | $34 | $32 | -5.9% |
Tyro Payments (TYR) | $0.90 | $0.70 | -22.2% |
WiseTech Global (WTC) | $100 | $70 | -30.0% |
Xero (XRO) | $225 | $130 | -42.2% |
Source: Morgan Stanley Research ("MS") — Tech and Communication Services stocks price target cuts
Health Care (XHJ) (-1.2%) was also under pressure, with high-PE, long-duration stocks broadly out of favour as ceasefire confidence ebbed. Cochlear (COH) (-2.0%) and CSL (CSL) (-1.4%) were both softer.
Consumer Discretionary (XDJ) (-0.9%) retreated as risk appetite pulled back. Myer (MYR) (-6.7%) and Web Travel (WEB) (-5.5%) were notable laggards.
In other commodities moves, COMEX benchmark gold futures eased 0.8% to US$4,740/oz, silver futures fell 1.9% to US$73.95/oz, and copper futures slipped 1.0% to US$5.718/lb. Lithium carbonate futures on the GFEX dropped 4.1% to 152,480 CNY/t, while NdPr rare earth prices in China edged down 0.7% to 757,500 CNY/t.
Today's best blue chip gainers
Company | Last Price | Change $ | Change % | 1mo % | 1yr % |
|---|---|---|---|---|---|
Bendigo and Adelaide Bank (BEN) | $11.34 | +$0.88 | +8.4% | +12.4% | +16.1% |
ASX (ASX) | $57.45 | +$3.57 | +6.6% | +13.6% | -11.2% |
Woodside Energy (WDS) | $33.33 | +$1.27 | +4.0% | +6.3% | +73.1% |
Ampol (ALD) | $33.23 | +$1.11 | +3.5% | +6.0% | +58.2% |
Charter Hall (CHC) | $19.96 | +$0.49 | +2.5% | +0.2% | +32.5% |
Bank of Queensland (BOQ) | $7.40 | +$0.18 | +2.5% | +9.5% | +16.7% |
Santos (STO) | $7.95 | +$0.19 | +2.4% | +4.1% | +48.0% |
Origin Energy (ORG) | $12.35 | +$0.29 | +2.4% | +5.0% | +27.3% |
Northern Star Resources (NST) | $24.47 | +$0.54 | +2.3% | -3.3% | +31.6% |
Worley (WOR) | $12.02 | +$0.26 | +2.2% | +14.3% | -1.8% |
National Australia Bank (NAB) | $45.50 | +$0.97 | +2.2% | -1.3% | +41.3% |
Lynas Rare Earths (LYC) | $21.86 | +$0.43 | +2.0% | +27.2% | +199.0% |
Metcash (MTS) | $3.06 | +$0.06 | +2.0% | +1.3% | +2.7% |
Regis Resources (RRL) | $7.51 | +$0.14 | +1.9% | -4.8% | +90.1% |
Westpac Banking Corp (WBC) | $42.65 | +$0.7 | +1.7% | +6.4% | +45.8% |
QBE Insurance (QBE) | $22.57 | +$0.36 | +1.6% | +9.5% | +16.8% |
Bluescope Steel (BSL) | $28.01 | +$0.43 | +1.6% | +8.2% | +42.1% |
APA (APA) | $9.92 | +$0.15 | +1.5% | +8.3% | +25.4% |
W.H. Soul Pattinson (SOL) | $43.52 | +$0.57 | +1.3% | +15.2% | +27.9% |
Telstra (TLS) | $5.41 | +$0.07 | +1.3% | +4.6% | +25.5% |
Today's worst blue chip losers
Company | Last Price | Change $ | Change % | 1mo % | 1yr % |
|---|---|---|---|---|---|
Wisetech Global (WTC) | $38.62 | -$4.73 | -10.9% | -23.8% | -49.5% |
Xero (XRO) | $73.41 | -$6.87 | -8.6% | -12.0% | -49.6% |
Life360 (360) | $20.14 | -$1.52 | -7.0% | -1.3% | +20.3% |
Technology One (TNE) | $27.89 | -$1.54 | -5.2% | +6.0% | +13.8% |
Car (CAR) | $23.41 | -$1.25 | -5.1% | -9.4% | -25.1% |
Greatland Resources (GGP) | $14.54 | -$0.69 | -4.5% | +22.1% | 0% |
Sandfire Resources (SFR) | $17.41 | -$0.73 | -4.0% | +11.0% | +106.8% |
Hub24 (HUB) | $87.60 | -$3.4 | -3.7% | -1.0% | +54.3% |
Pro Medicus (PME) | $127.38 | -$4.7 | -3.6% | -3.1% | -28.0% |
REA (REA) | $159.28 | -$5.8 | -3.5% | -5.7% | -28.2% |
Mirvac (MGR) | $1.715 | -$0.05 | -2.8% | -7.0% | -16.3% |
Seek (SEK) | $14.83 | -$0.42 | -2.8% | -9.6% | -24.1% |
Block, (XYZ) | $88.64 | -$2.48 | -2.7% | -3.1% | +15.3% |
Fortescue (FMG) | $20.53 | -$0.51 | -2.4% | +7.8% | +43.4% |
Nextdc (NXT) | $12.90 | -$0.3 | -2.3% | +0.7% | +28.5% |
Telix Pharmaceuticals (TLX) | $13.64 | -$0.31 | -2.2% | +33.7% | -41.1% |
Qantas Airways (QAN) | $9.09 | -$0.2 | -2.2% | +6.7% | +12.9% |
Whitehaven Coal (WHC) | $8.39 | -$0.18 | -2.1% | -5.2% | +92.9% |
Eagers Automotive (APE) | $23.52 | -$0.48 | -2.0% | +13.3% | +53.9% |
ChartWatch
Nasdaq Composite Index
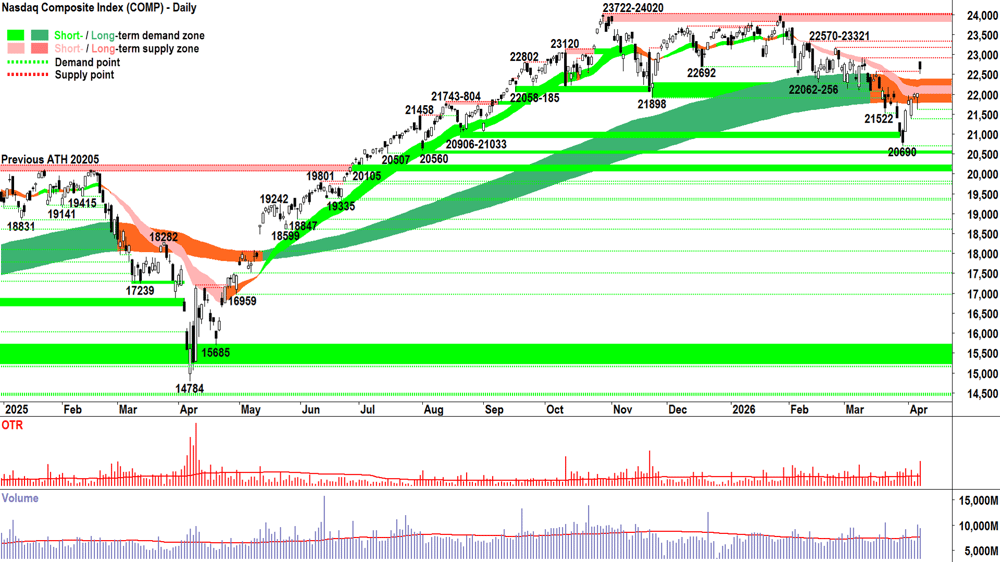
Analysis
Yesterday, we offered two options for Wednesday’s candle:
White body and or downward pointing shadow + close near session high and a long way up from Tuesday's close = Strong demand-side motivation. Add in substantially above average volume = ⬆️ Demand-side interest +
⬆️ Supply removal = ✅
Black body and or upward pointing shadow + close near session low and near or below Tuesday's close = Strong supply-side motivation. Add in substantially above average volume = ⬆️ Supply-side interest + ⬆️ New demand trapped in at higher prices = ⚠️🚨
Look up at the last candle on the chart above, which did we get? 🤔
Option 2, right? The candle body is definitely black and the close is near the session low. It’s not a big candle, so we can’t really say “strong” supply-side motivation — but it’s definitely a supply-side oriented candle.
Nope. That’s not how it works with candlesticks. One must mind the gap!
The gap is the difference between Wednesday’s low and Tuesday’s high. It’s not technically part of the candle as Munehisa Homma might have envisioned when he devised his revolutionary system for trading rice futures back in the late-1700’s.
But just like a regular candle body or shadow, gaps represent an imbalance between the motivation of demand- and supply-sides of the market — in this case, a sudden and large tilt towards excess demand. So, we must take them into account.
For me, this means simply treating the previous session’s high (i.e., typical application, or one could also use the previous session’s close — my preference) as the pseudo open for an imaginary “gap-adjusted” candle.
If done this way, Wednesday’s candle transforms into a long white candle with an upward pointing shadow the length of the body you see in last candle above. Bottom line: Wednesday’s candle is indeed a very decent and very credibly demand-side showing — and not a supply-side occurrence as regular candle analysis might suggest.
Add in the fact that the close is now well above the short- and long-term trend ribbon combo — as well as the price action environment of rising peaks and rising troughs — and we can safely assume that the demand-side is back in control of the Comp’s price.
Ideally, we now get some confirmation of this via a test and hold of the trend ribbons combo, letting us know both are again acting as zones of dynamic excess demand.
(24020 + 20690) / 2 = 22355.
Last night’s high / close values were 22822 / 22635. So, we’re roughly just over halfway back to the Comp’s all time high. Yes, a frustrating journey to get from Point A to Point B and back to where we are — but that’s markets. No point whinging about it! Just AAA!
Analyse = Very credible short term trend reversal, demand-side control of at least short term Comp price established. Requires confirmation via test and hold of trend ribbons.
Accept = Regardless of what we think about the fundamentals, and whether the concept of a “Middle East Ceasefire” has any real credibility anymore… The probabilities are roughly back to 33-33-33% up, down, sideways from here. Roughly two thirds corresponds to a “not down” scenario — that’s a plus — but I propose we’re still a decent whack of demand-side price action and candles away from a “more likely up” scenario.
Act = Clearly running at a 1/3RP portfolio risk limit is too conservative given the shifting odds, but going “all in” here is also probably substantially premature. Given the balanced nature of the technicals a balanced portfolio risk approach is best, which for me means 1/2RP. ⚖️
View
1/2RP (RP = Risk Position — it reflects my personal allowable capital allocation limit for my investments in US stocks. So 1/3RP is 33%, 1/2RP is 50%, 2/3RP is 67% and FRP is 100% 🪣).
Key levels
22570-23321 is the next key zone of supply. Supply-side candles near / in that range are a warning sign that the present rally is faltering.
The short- and long-term trend ribbon combo (presently 21788-22370) is now the key zone of demand. A test and hold of that range would really confirm this newfound semblance of demand-side control. If the price closes back below this range, the supply-side is very likely back in control of the Comp's price.
S&P/ASX 200 (XJO)
%20chart_9%20Apr.png)
Analysis
There are times in technical analysis when very little means a whole lot.
Today’s candle definitely falls in the “very little” category. The total candle’s range is just 0.6% — paltry against yesterday’s 3% monster — but in many ways, it’s just as descriptive about which party is in control of the ASX 200’s, aka, the Old Tin Pot’s price.
Think about Easter eggs for a second.
This was the first Easter my wife and I didn’t buy any for our kids. Sure, they’re 14 and 16 respectively, so “ceebs” on easter eggs anyways… but it was also partly due to the ridiculous price of the darned things, plus the fact most manufacturers had slashed cocoa content, and the old bet you didn’t notice our products are 20% lighter in the same packaging shrinkflation!
The point is… the price of Easter eggs skyrocketed. As far as the Capolingua household was concerned, value evaporated, so demand collapsed.
But stocks aren’t Easter eggs.
They’re a rare quirk of the demand-supply universe where price can skyrocket — and yet demand doesn’t change — or potentially, it even increases.
You buy an Easter egg. You eat the Easter egg. That’s pretty much the extent of the utility that Easter egg can provide.
You buy a share in a company, possibly that share generates more or less income down the track — that means it could be more or less valuable down the track.
If investors think your share will be more valuable down the track, they’ll pay you more for it. If that makes the price go up, and expectations remain “the share will be more valuable down the track," then there’s every chance the share's price will keep going up.
So, when we see share prices rise substantially like they did yesterday — and hold firm:
Immune from sellers suddenly believing they’re overvalued; and
Supported by a demand-side seemingly not yet perceiving overvaluation;
Then it’s usually a very good sign the market is very comfortable with that substantial price rise.
You might remember one of my favourite market sayings is: “If it can’t go down, it will probably go up!”. I suspect there’s a bit of that going on with the OTP today.
Today’s smidge of a pullback isn’t just worth comparing against yesterday's pop, it’s worth comparing against the absolute rocket of a rally we’ve experienced since the 8262 low. 🚀
Could it be the OTP is behaving like a pinball bopping between the bouncers… 9201-8292-9201? Let's do the checklist:
Trends: ST & LT trend ribbons both neutral, but beginning to move higher again, we await confirmation both are back to acting as zones of excess demand ⚖️
Price action: rising peaks and rising troughs with long motive phases and shallow pullbacks ✅
Candles: clear, strong demand-side showings ✅
The evidence we could complete the move back to all-time highs is growing...
View
1/2RP 🪣 (i.e., my personal allowable capital allocation limit for my investments in Australian stocks is 50%).
Key levels
9201, the all time high, is the key point of supply. Below it there likely remains a degree of trepidation among market participants.
Demand now moves back to the dynamic short- and long-term trend ribbons (presently 8662-8740). A test and hold of that range would really confirm this newfound semblance of demand-side control. If the price closes back below this range, the supply-side is very likely back in control of the OTP's price.
ChartWatch *LIVE* Webinar
ChartWatch *LIVE* Webinars – WEEKLY Wednesday's @ 12pm AEDT
Learn more about technical analysis and trend following through real case studies on ASX stocks. Australia's premier technical analyst, Carl Capolingua, shares his unique insights on stocks as requested by viewers. Ask about a company in your portfolio or anything related to trading and investing and get Carl's expert opinion.
Places are limited so >REGISTER NOW!<
Economy
Today
There weren't any major economic data releases in our time zone today
Later this week
Thursday
22:30 USA March Personal Consumption Expenditures (PCE)
Core PCE Price Index: +0.4% m/m forecast vs +0.4% m/m in February
Personal Income: +0.3% m/m forecast vs +0.4% m/m in February
Personal Spending: +0.6% m/m forecast vs +0.4% m/m in February
Friday
11:30 CHN March Consumer Price Index (CPI) (+1.2% p.a. forecast vs +1.3% p.a. in February)
11:30 CHN March Producer Price Index (PPI) (+0.4% p.a. forecast vs -0.9% p.a. in February)
22:30 USA Core CPI (+1.0% m/m forecast vs +0.3% m/m in February)
Saturday
00:00 USA Prelim April UoM Consumer Sentiment (51.6 forecast vs 53.3 in February)
Latest News
Interesting Movers
Trading higher
+9.8% Sunrise Energy Metals (SRL) – No news, general strength across the broader Critical Minerals sector today.
+8.4% Bendigo and Adelaide Bank (BEN) – Strategic Partnerships & Q3 Trading Update.
+6.8% Arafura Rare Earths (ARU) – No news, general strength across the broader Critical Minerals sector today, rise is consistent with prevailing short and long term uptrends, a regular in ChartWatch ASX Scans Uptrends list 🔎📈
+6.6% ASX (ASX) – Continued positive response to 08-Mar ASX Group Monthly Activity Report - March 2026.
+4.6% Lindian Resources (LIN) – No news, general strength across the broader Critical Minerals sector today.
+4.4% Develop Global (DVP) – Develop achieves steady-state production at Woodlawn, general strength across the broader Critical Minerals sector today.
+4.2% Karoon Energy (KAR) – No news, general strength across the broader Energy sector today.
+4.1% Alkane Resources (ALK) – March 2026 Quarter Production Update, rise is consistent with prevailing short and long term uptrends, added to ChartWatch ASX Scans Uptrends list today 🔎📈
+4.0% Woodside Energy (WDS) – No news, general strength across the broader Energy sector today.
+3.5% Ampol (ALD) – EG Aust Acquisition Revised Remedy Offer Lodged with ACCC, general strength across the broader Energy sector today.
+3.3% Viva Energy (VEA) – No news, general strength across the broader Energy sector today.
+3.0% Iluka Resources (ILU) – No news, general strength across the broader Critical Minerals sector today, rise is consistent with prevailing short and long term uptrends, a recent regular in ChartWatch ASX Scans Uptrends list 🔎📈
+2.5% BetaShares Crude Oil ETF (OOO) – No news (long crude oil ETF), general strength across the broader Energy sector today.
+2.4% Santos (STO) – No news, general strength across the broader Energy sector today.
Trading lower
-18.0% (ORA) – FY26 Trading Update & impact of Middle East conflict, fall is consistent with prevailing short and long term downtrends, a regular in ChartWatch ASX Scans Downtrends list 🔎📉
-11.3% Nuix (NXL) – No news, general weakness across the broader Information Technology sector today, fall is consistent with prevailing short and long term downtrends, one of the most Featured (highest conviction) stocks in ChartWatch ASX Scans Downtrends list 🔎📉
-10.9% Wisetech Global (WTC) – No news, general weakness across the broader Information Technology sector today, fall is consistent with prevailing short and long term downtrends, a regular in ChartWatch ASX Scans Downtrends list 🔎📉
-10.3% Zip (ZIP) – No news, UBS cut target price to $2.85 from $4.50, today's move is consistent with recent volatility.
-9.5% Unico Silver (USL) – No news, general weakness across the broader Silver sector today.
-9.3% Sun Silver (SS1) – No news, general weakness across the broader Silver sector today.
-8.6% Xero (XRO) – No news, general weakness across the broader Information Technology sector today, fall is consistent with prevailing short and long term downtrends, a regular in ChartWatch ASX Scans Downtrends list 🔎📉
-8.3% Catapult Sports (CAT) – No news, general weakness across the broader Information Technology sector today, fall is consistent with prevailing short and long term downtrends, a regular in ChartWatch ASX Scans Downtrends list 🔎📉
-8.0% Andean Silver (ASL) – RRS Gather Round Conference Presentation, general weakness across the broader Silver sector today.
-7.8% Megaport (MP1) – Ceasing to be a substantial holder (The Capital Group Companies, last update 5.2%), general weakness across the broader Information Technology sector today, fall is consistent with prevailing short and long term downtrends, a regular in ChartWatch ASX Scans Downtrends list 🔎📉
-7.0% Life360 (360) – No news, general weakness across the broader Information Technology sector today, fall is consistent with prevailing short and long term downtrends, a regular in ChartWatch ASX Scans Downtrends list 🔎📉
-6.7% Myer (MYR) – No news, general weakness across the broader Consumer Discretionary sector today, fall is consistent with prevailing short and long term downtrends, one of the most Featured (highest conviction) stocks in ChartWatch ASX Scans Downtrends list 🔎📉
-6.7% Siteminder (SDR) – No news, general weakness across the broader Information Technology sector today, fall is consistent with prevailing short and long term downtrends, a regular in ChartWatch ASX Scans Downtrends list 🔎📉
-5.5% Web Travel (WEB) – No news, general weakness across the broader Consumer Discretionary sector today, fall is consistent with prevailing short and long term downtrends, a regular in ChartWatch ASX Scans Downtrends list 🔎📉
Broker Moves
Ama Group (AMA)
Retained at buy at Bell Potter; Price Target: $1.20 from $1.25
Airtasker (ART)
Retained at underweight at Morgan Stanley; Price Target: $0.20
ASX (ASX)
Retained at neutral at Citi; Price Target: $56.80 from $55.50
Retained at neutral at Goldman Sachs; Price Target: $61.00
Retained at overweight at JPMorgan; Price Target: $59.00
Retained at neutral at UBS; Price Target: $58.85 from $58.40
Bendigo and Adelaide Bank (BEN)
Retained at neutral at UBS; Price Target: $10.95
Bellevue Gold (BGL)
Retained at buy at Argonaut Securities; Price Target: $2.60 from $2.40
Retained at overweight at JPMorgan; Price Target: $2.05 from $1.80
Retained at outperform at Macquarie; Price Target: $2.10
CAR Group (CAR)
Retained at overweight at Morgan Stanley; Price Target: $32.00
Catapult Sports (CAT)
Retained at overweight at Morgan Stanley; Price Target: $5.00
Cogstate (CGS)
Retained at buy at Bell Potter; Price Target: $3.20 from $2.90
Charter Hall Group (CHC)
Retained at buy at Citi; Price Target: $26.40
CSL (CSL)
Retained at hold at Bell Potter; Price Target: $155.00 from $175.00
Dalrymple Bay Infrastructure (DBI)
Initiated at buy at UBS; Price Target: $5.75
Deterra Royalties (DRR)
Initiated at buy at Morgans; Price Target: $4.85
Emerald Resources NL (EMR)
Upgraded to buy from hold at Canaccord Genuity; Price Target: $8.20 from $7.35
Evolution Mining (EVN)
Upgraded to buy from hold at Canaccord Genuity; Price Target: $15.55 from $14.20
Greatland Resources (GGP)
Retained at buy at Argonaut Securities; Price Target: $17.30 from $15.45
Retained at buy at Citi; Price Target: $16.00
Downgraded to neutral from outperform at Macquarie; Price Target: $15.00 from $13.50
Retained at sell at Moelis Australia; Price Target: $10.10
Gemlife Communities Group (GLF)
Retained at buy at Citi; Price Target: $5.25 from $6.10
Goodman Group (GMG)
Retained at hold at Ord Minnett; Price Target: $29.15
Guzman Y Gomez (GYG)
Retained at buy at Morgans; Price Target: $26.70 from $24.00
hipages Group Holdings (HPG)
Retained at equal-weight at Morgan Stanley; Price Target: $0.78
Hansen Technologies (HSN)
Retained at overweight at Morgan Stanley; Price Target: $6.00
HUB24 (HUB)
Retained at buy at Citi; Price Target: $104.70
Infratil (IFT)
Retained at buy at Citi; Price Target: $12.34
Ingenia Communities Group (INA)
Retained at buy at Citi; Price Target: $5.00 from $6.10
Kelsian Group (KLS)
Initiated at overweight at Jarden; Price Target: $4.70
Lifestyle Communities (LIC)
Downgraded to neutral from buy at Citi; Price Target: $5.10 from $5.60
Magellan Financial Group (MFG)
Downgraded to underweight from neutral at JPMorgan; Price Target: $8.50
Retained at underperform at Macquarie; Price Target: $8.50 from $8.65
Retained at buy at Morgans; Price Target: $11.99 from $12.43
Mirvac Group (MGR)
Downgraded to neutral from buy at Citi; Price Target: $1.84 from $2.50
Megaport (MP1)
Retained at equal-weight at Morgan Stanley; Price Target: $9.00
Many Peaks Minerals (MPK)
Initiated at speculative buy at Morgans; Price Target: $1.92
Netwealth Group (NWL)
Retained at buy at Citi; Price Target: $27.00
Nuix (NXL)
Retained at overweight at Morgan Stanley; Price Target: $2.50
NEXTDC (NXT)
Retained at hold at Jefferies; Price Target: $16.60 from $18.70
Retained at overweight at JPMorgan; Price Target: $18.00
Retained at outperform at Macquarie; Price Target: $20.80
Retained at outperform at RBC Capital Markets; Price Target: $22.00
Orora (ORA)
Retained at neutral at Citi; Price Target: $2.30
Pro Medicus (PME)
Retained at overweight at Morgan Stanley; Price Target: $200.00
PEXA Group (PXA)
Retained at overweight at Morgan Stanley; Price Target: $15.50
QBE Insurance Group (QBE)
Retained at overweight at Morgan Stanley; Price Target: $25.65
REA Group (REA)
Retained at overweight at Morgan Stanley; Price Target: $230.00
ResMed Inc. (RMD)
Retained at buy at Citi; Price Target: $50.00
Regis Resources (RRL)
Retained at hold at Argonaut Securities; Price Target: $7.80 from $7.50
Upgraded to buy from hold at Canaccord Genuity; Price Target: $8.85 from $8.15
Retained at neutral at JPMorgan; Price Target: $7.00
Retained at outperform at Macquarie; Price Target: $9.70
SEEK (SEK)
Retained at overweight at Morgan Stanley; Price Target: $21.00
Sandfire Resources (SFR)
Retained at buy at Canaccord Genuity; Price Target: $21.00
Stockland (SGP)
Downgraded to neutral from buy at Citi; Price Target: $4.30 from $6.40
Transurban Group (TCL)
Retained at buy at Citi; Price Target: $16.10
Technology One (TNE)
Retained at overweight at Morgan Stanley; Price Target: $32.00
Tyro Payments (TYR)
Retained at underweight at Morgan Stanley; Price Target: $0.70
Vault Minerals (VAU)
Upgraded to buy from neutral at Goldman Sachs; Price Target: $6.30 from $6.60
Wisetech Global (WTC)
Retained at overweight at Morgan Stanley; Price Target: $70.00
Xero (XRO)
Retained at overweight at Morgan Stanley; Price Target: $130.00
Zip Co (ZIP)
Retained at buy at UBS; Price Target: $2.85 from $4.50
Scans
Top Gainers
Code | Company | Last | % Chg |
|---|---|---|---|
| CGR | CGN Resources Ltd | $0.08 | +33.33% |
| SPN | Sparc Technologies Ltd | $0.31 | +31.92% |
| XGL | Xamble Group Ltd | $0.015 | +30.44% |
| FG1 | FLYNN Gold Ltd | $0.025 | +25.00% |
| CND | Condor Energy Ltd | $0.022 | +22.22% |
Top Fallers
Code | Company | Last | % Chg |
|---|---|---|---|
| VFX | Visionflex Group Ltd | $0.056 | -20.00% |
| ORA | Orora Ltd | $1.62 | -17.98% |
| TBN | Tamboran Resources Corporation | $0.26 | -17.46% |
| JNO | Juno Minerals Ltd | $0.024 | -17.24% |
| CMA | Carma Ltd | $0.80 | -15.79% |
52 Week Highs
Code | Company | Last | % Chg |
|---|---|---|---|
| SPN | Sparc Technologies Ltd | $0.31 | +31.92% |
| PRG | PRL Global Ltd | $1.94 | +21.25% |
| OD6 | OD6 Metals Ltd | $0.145 | +16.00% |
| EXR | Elixir Energy Ltd | $0.135 | +12.50% |
| SHE | Stonehorse Energy Ltd | $0.011 | +10.00% |
52 Week Lows
Code | Company | Last | % Chg |
|---|---|---|---|
| ORA | Orora Ltd | $1.62 | -17.98% |
| CMA | Carma Ltd | $0.80 | -15.79% |
| NXL | NUIX Ltd | $1.18 | -11.28% |
| A1N | Arn Media Ltd | $0.18 | -10.00% |
| BTN | Butn Ltd | $0.028 | -9.68% |
Near Highs
Code | Company | Last | % Chg |
|---|---|---|---|
| IHD | iShares S&P/ASX DIV Opportunities Esg Screened ETF | $17.30 | -0.29% |
| OBL | Omni Bridgeway Ltd | $1.695 | +1.19% |
| MVB | Vaneck Australian Banks ETF | $45.88 | +1.06% |
| MI6 | Minerals 260 Ltd | $0.745 | +2.06% |
| HGBL | Betashares Global Shares Currency Hedged ETF | $77.65 | -0.45% |
Relative Strength Index (RSI) Oversold
Code | Company | Last | % Chg |
|---|---|---|---|
| HBRD | Betashares Australian Credit Income Active ETF | $10.04 | 0.00% |
| SGP | Stockland | $4.07 | +0.74% |
| PXA | Pexa Group Ltd | $12.01 | -3.07% |
| ICME | iShares Credit Income Active ETF | $99.40 | -0.38% |
| ORA | Orora Ltd | $1.62 | -17.98% |
