
News | Market Wraps
Evening Wrap: ASX 200 rockets 223 points as investors flood back into technology and gold stocks, WTC and EVN gain 10%
The S&P/ASX 200 closed 223 points higher, up 2.56%.

Mentioned
The S&P/ASX 200 closed 223 points higher, up 2.56%.
The ASX 200 surged on news that the US and Iran agreed to a two-week ceasefire, reopening the Strait of Hormuz and triggering a sharp unwind of the risk premium that had built up in the oil price across the six week conflict.
Bond yields fell sharply on the ceasefire news, unleashing a powerful rotation back into the sectors hardest hit by the crisis — tech, real estate, and consumer stocks — while energy bore the brunt of the collapsing oil price.
In stock specific news:
Bellevue Gold (BGL) (+18.9%) — record cash flow in the March quarter, with the gold price adding further fuel to the rally
Virgin Australia (VGN) (+11.7%) — surged on expectations of sharply lower jet fuel costs following the oil price plunge
Qantas (QAN) (+9.4%) — its best single session since March 2020, driven by the same lower fuel cost tailwind
Pro Medicus (PME) (+8.3%) — signed a five-year, $23 million contract with the University of Maryland Medical System to deploy its Visage 7 imaging platform
Flight Centre (FLT) (+7.3%) — announced the sale of its 47% stake in Pedal Group for $61.7 million
DroneShield (DRO) (-13.5%) — CEO Oleg Vornik resigned and chairman Peter James announced his retirement, five months after both sold down their holdings
Be sure to click/scroll through for the usual reporting of the major sector and stock-specific moves, the broker responses to them, as well as all the key economic data in tonight's Evening Wrap.
Also, I have detailed technical analysis on the Nasdaq Composite and the S&P/ASX 200 in today's ChartWatch.
Let's dive in!
Today in Review
Wed 08 Apr 26, 5:16pm (AEST)
Name | Value | % Chg |
|---|---|---|
Major Indices | ||
| ASX 200 | 8,951.8 | +2.56% |
| All Ords | 9,165.7 | +2.74% |
| Small Ords | 3,512.0 | +4.12% |
| All Tech | 2,778.2 | +6.44% |
| Emerging Companies | 3,162.7 | +5.43% |
Currency | ||
| AUD/USD | 0.7071 | +1.36% |
US Futures | ||
| S&P 500 | 6,824.0 | +2.51% |
| Dow Jones | 47,881.0 | +2.28% |
| Nasdaq | 25,151.5 | +3.20% |
Name | Value | % Chg |
|---|---|---|
Sector | ||
| Information Technology | 1,726.8 | +7.31% |
| Materials | 23,794.8 | +4.47% |
| Real Estate | 3,405.1 | +3.91% |
| Consumer Discretionary | 3,555.7 | +3.53% |
| Industrials | 8,155.6 | +2.88% |
| Financials | 9,911.3 | +2.77% |
| Health Care | 28,354.8 | +2.14% |
| Communication Services | 1,726.0 | +0.85% |
| Consumer Staples | 12,638.1 | -0.84% |
| Utilities | 10,228.5 | -4.18% |
| Energy | 10,719.5 | -7.15% |
Markets
%20intraday%20chart_8%20Apr.png)
ASX 200 Session Chart
The S&P/ASX 200 (XJO) finished 223 points higher at 8,951.8, 2.6% from its session low and 0.4% from its high. In the broader-based S&P/ASX 300 (XKO) advancers beat decliners by an overwhelming 265 to 30.
Some stats from within the ASX 300 today:
31, or just over 1 in 10 stocks rose by 10% or more.
112, or greater than 1 out of 3 stocks rose by 5% or more.
207, or greater than 2 out of 3 stocks rose by 2% or more.
= 🤯
The Gold Sub-Index (XGD) (+8.8%) was the standout sector of the session, surging as benchmark gold futures climbed 3.4% to US$4,482/oz and benchmark silver futures rose 7.1% on COMEX. Gold and bond yields tend to move in opposite directions — when yields fall, the opportunity cost of holding gold drops, making it more attractive — and with Middle East risk premiums unwinding sharply, bond yields fell hard, giving the gold cohort a powerful double-barrelled boost.
Bellevue Gold (BGL) (+18.9%) also reported record cash flow in the March quarter, adding an earnings kicker on top of the macro tailwind. Black Cat Syndicate (BC8) (+16.7%) and Kingsgate Consolidated (KCN) (+15.6%) also surged.
Information Technology (XIJ) (+7.3%) was the second-best performer, with the sector's long-duration characteristics making it particularly sensitive to falling bond yields — when yields drop, the present value of future earnings rises, lifting high-growth stocks disproportionately. WiseTech Global (WTC) (+10.7%) and Siteminder (SDR) (+12.5%) both posted strong gains.
Consumer Discretionary (XDJ) (+3.5%) rebounded as the ceasefire lifted consumer confidence expectations and unwound some of the inflation-risk premium that had weighed on spending-sensitive stocks throughout the conflict. Temple & Webster (TPW) (+13.3%) led the move, with Guzman Y Gomez (GYG) (+12.4%) and Lovisa (LOV) (+12.2%) also posting double-digit gains.
Real Estate (XPJ) (+3.9%) rallied as bond yields retreated. Property stocks tend to be priced like bonds — when yields fall, their income streams look more attractive by comparison, drawing buyers back in. Goodman Group (GMG) (+7.0%) led the sector, also announcing a new venture with DataBank to develop a 32-megawatt data centre in Los Angeles.
Financials (XFJ) (+2.8%) participated in the broad risk-on rally, with the major banks each gaining at least 1.85%.
Resources (XJR) (+2.5%) were broadly stronger, with copper futures up 3.4% to US$5.75/lb. BHP (BHP) (+3.0%) was a notable mover in the sector.
Energy (XEJ) (-7.1%) was the session's clear casualty. Brent crude futures plunged 13.2% to US$94.98/bbl in the Asian session as the ceasefire and Strait of Hormuz reopening removed the supply-disruption premium that had propped up oil prices throughout the conflict.
Karoon Energy (KAR) (-13.1%) and Woodside Energy (WDS) (-10.4%) bore the heaviest losses. Santos (STO) (-4.1%) also fell, though it separately flagged an expected restart of production at its Barossa gas plant around April 18. New Hope Corp. (NHC) (-9.4%) was also sharply lower among several coal casualties.
Utilities (XUJ) (-4.2%) were dumped as the risk-off trade that had sustained defensive flows for the past six weeks went into sharp reverse. Investors rotated out of safe-haven plays and back into cyclicals.
Consumer Staples (XSJ) (-0.8%) saw modest outflows for the same reason — defensive positioning unwound as confidence returned.
Today's best blue chip gainers
Company | Last Price | Change $ | Change % | 1mo % | 1yr % |
|---|---|---|---|---|---|
Greatland Resources (GGP) | $15.23 | +$1.87 | +14.0% | +22.7% | 0% |
Life360 (360) | $21.66 | +$2.3 | +11.9% | -1.0% | +20.3% |
Hub24 (HUB) | $91.00 | +$9.01 | +11.0% | -2.7% | +54.4% |
Wisetech Global (WTC) | $43.35 | +$4.19 | +10.7% | -17.8% | -42.1% |
Westgold Resources (WGX) | $6.79 | +$0.63 | +10.2% | +2.4% | +136.6% |
Evolution Mining (EVN) | $14.09 | +$1.28 | +10.0% | -4.7% | +101.6% |
Sandfire Resources (SFR) | $18.14 | +$1.62 | +9.8% | +6.1% | +105.0% |
Genesis Minerals (GMD) | $6.62 | +$0.59 | +9.8% | -1.6% | +85.4% |
Ramelius Resources (RMS) | $4.10 | +$0.36 | +9.6% | -3.1% | +66.0% |
Qantas Airways (QAN) | $9.29 | +$0.8 | +9.4% | +4.1% | +11.2% |
Capricorn Metals (CMM) | $12.25 | +$1.04 | +9.3% | -8.5% | +44.6% |
Pro Medicus (PME) | $132.08 | +$10.1 | +8.3% | -0.5% | -30.4% |
Seek (SEK) | $15.25 | +$1.09 | +7.7% | -9.9% | -25.2% |
Regis Resources (RRL) | $7.37 | +$0.52 | +7.6% | -13.1% | +81.5% |
Northern Star Resources (NST) | $23.93 | +$1.58 | +7.1% | -11.3% | +27.0% |
ALS (ALQ) | $22.93 | +$1.51 | +7.0% | -4.5% | +47.7% |
Goodman (GMG) | $28.10 | +$1.85 | +7.0% | +1.2% | +2.0% |
Car (CAR) | $24.66 | +$1.58 | +6.8% | -7.4% | -20.3% |
Mineral Resources (MIN) | $58.20 | +$3.71 | +6.8% | +5.4% | +207.1% |
Technology One (TNE) | $29.43 | +$1.87 | +6.8% | +7.7% | +16.5% |
Today's worst blue chip losers
Company | Last Price | Change $ | Change % | 1mo % | 1yr % |
|---|---|---|---|---|---|
Woodside Energy (WDS) | $32.06 | -$3.74 | -10.4% | +4.3% | +56.9% |
Origin Energy (ORG) | $12.06 | -$0.73 | -5.7% | +1.0% | +22.7% |
Whitehaven Coal (WHC) | $8.57 | -$0.48 | -5.3% | +1.1% | +85.5% |
Santos (STO) | $7.76 | -$0.33 | -4.1% | +4.0% | +30.4% |
Ampol (ALD) | $32.12 | -$1.31 | -3.9% | +3.7% | +42.3% |
AGL Energy (AGL) | $9.58 | -$0.26 | -2.6% | -0.7% | -9.1% |
APA (APA) | $9.77 | -$0.23 | -2.3% | +5.9% | +21.2% |
Woolworths (WOW) | $36.78 | -$0.74 | -2.0% | +2.2% | +18.2% |
Coles (COL) | $21.99 | -$0.29 | -1.3% | +4.0% | +4.1% |
Telstra (TLS) | $5.34 | -$0.06 | -1.1% | +1.9% | +23.3% |
Insurance Australia (IAG) | $7.18 | -$0.08 | -1.1% | +9.3% | -7.0% |
Bank of Queensland (BOQ) | $7.22 | -$0.05 | -0.7% | +4.2% | +8.1% |
Medibank Private (MPL) | $4.42 | -$0.02 | -0.5% | +3.0% | -4.5% |
ChartWatch
Nasdaq Composite Index
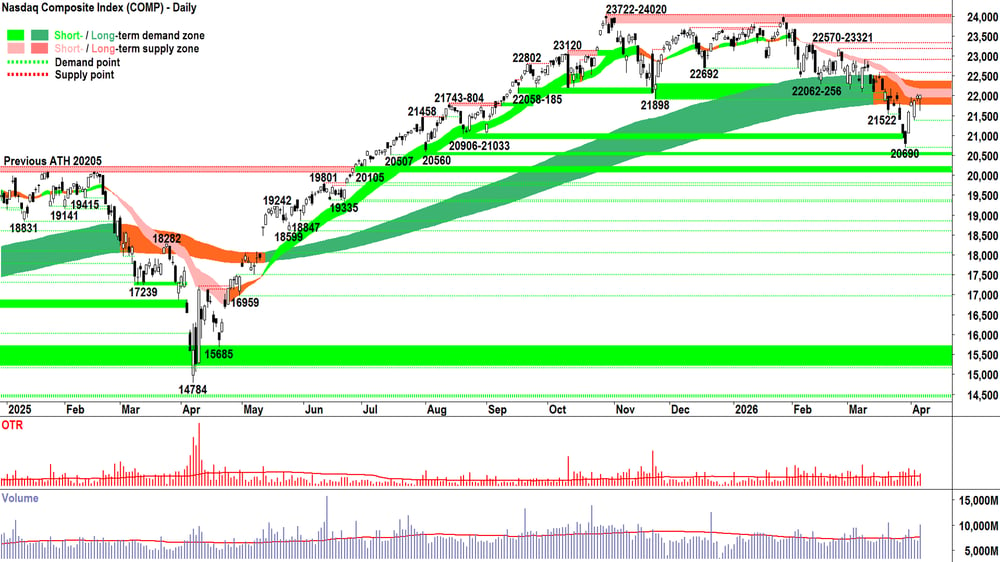
Analysis
What's there to say!? That last candle — while confirmation of the budding reversal in the Comp that was already in place — is largely moot now! 🤷
But the candles have a way of foreshadowing good news that's on the way. 5 white candles in a row, Tuesday's with the typical long downward pointing shadow that's symptomatic of BTD (Buy The Dip) — one of the key 'fingerprints of excess demand' as I like to call them.
I could also call it the work of some 'very smart and very lucky' demand-side participants who happened to buy just before the announcement of one of the biggest risk-on events since April 9 last year (i.e., when You Know Who TACO'd on his reciprocal tariffs — therefore stamping the bottom of the 2025 bear market!).
One day, I aim to be that smart and that lucky. 🤞
In the mean time, I must rely on what little wits I have about me, oh — and of course my technical model. Which more than makes up for my lack of 'smarts' and 'luck'.
I kinda summed it up perfectly (if I say so myself! 😉) in yesterday's Comp analysis when I wrote:
Hence I developed my 1/3RP limit during periods where the long term trend is neutral / transitioning to down like it is now — and even in clear long term downtrends. It says:
Even if you’re trading the plethora of downtrends on offer during the uber-uncertain period — one cannot overload one’s exposure to the downside because it’s in the nature of regulators and politicians to create news that causes investors to gain occasional bouts of hope that the end of the crisis is near — and therefore for stocks to rally violently.
It’s easy for one to believe that bear markets are easy places for traders who can go short to make a killing on the downside. That one should go FRP short.
The reality is that FRP short generally only works in short, sharp patches of downdrafts when the you-know-what is really hitting the rotating cooling device.
Apart from those relatively brief periods, bear markets are volatile, choppy beasts where it’s all too easy for trend traders like us to get chopped up! 🪓🪓🪓
I often talk in probabilities here in ChartWatch — that's because I view markets only as a range of probabilistic outcomes. X% chance of that going up vs Y% chance of it going sideways vs Z% chance of it going down. Whichever is the larger of X, Y, and Z dictates how I allocate my risk.
Tonight is a 100% chance the Comp will open higher. But that's not the important bit. The important bit will be where it closes.
Does the demand side maintain its desire to bid up stocks, because of a wall of cash behind them that must cover back shorts, recoup tactical underweight exposures versus the benchmark, and satisfy speculative 'that's the low, time to get back in' buying? In short: Do we see FOMO = Fear Of Missing Out?
Or, do we only see a desperate bout of short covering (may the maker have mercy on their souls! 🙏) before demand quickly evaporates because the news is not to be believed nor trusted? 🤔
Does the supply side let the the demand-side have it — on the basis that they believe tonight's open is the best they're going to get for quite some time?
Or, do we see a supply-side vacuum because those holding risk (i.e., stocks) believe the return of retaining that risk is again sufficient for them to HOFU = Hold On For Upside? 🤔
I've asked plenty of questions there, so here's my answer: Wednesday's candle will tell us! 🕯️
White body and or downward pointing shadow + close near session high and a long way up from Tuesday's close = Strong demand-side motivation. Add in substantially above average volume = ⬆️ Demand-side interest + ⬆️ Supply removal = ✅
Black body and or upward pointing shadow + close near session low and near or below Tuesday's close = Strong supply-side motivation. Add in substantially above average volume = ⬆️ Supply-side interest + ⬆️ New demand trapped in at higher prices = ⚠️🚨
My job isn't to predict the outcome of tonight's candle (because the future is unknown and prediction is futile! 🔮🚫), it's simply to Analyse the outcome, Accept what it means in terms of impact on the ⬆️% ➡️% ⬇️% matrix — and then to Act by managing my risk accordingly!
View
In yesterday's update I said: "Working within my 1/3RP limit, I'm happy to put a pause on adding new short exposure for the time being and to entertain new long exposure if absolute-top-quality uptrends can be found."
Short of saying "okay everyone, pile in!" — which is impossible given I am a trend follower — that was about as bullish as I could have indicated given the price action I had to analyse at the time.
Tonight's candle will be the key to my moving back to 1/2RP. I need to see it to analyse it — and to believe it. So, I'll officially retain 1/3RP for now, but clearly I'm open to swinging the balance back to a more neutral (i.e., 50% invested vs 50% cash) stance. ⚖️
(RP = Risk Position — it reflects my personal allowable capital allocation limit for my investments in US stocks. So 1/3RP is 33%, 1/2RP is 50%, 2/3RP is 67% and FRP is 100% 🪣).
Key levels
We will likely see the long white-bodied candle closing at above the short- and long-term trend ribbons, indicating the demand-side is back in control of the Comp's price. 22570-23321 is the next key zone of supply from there. Supply-side candles near / in that range are a warning sign that the present rally is faltering.
20690 is the key point of demand. As long as it holds, the bear remains in hibernation! 🐻
S&P/ASX 200 (XJO)
%20chart_8%20Apr.png)
Analysis
What's there to say!? That's quite a candle! 🕯️🤯
As much as some in the media might imply today's move is the news... we know this move started several candles ago — arguably on 23 March's failure to close at its lows (8262) — bolstered by the demand-side showing two sessions later on 25 March — and then confirmed by the powerful full-white-bodied showing on 1 April.
Price action rarely lies. Back to today:
FOMO? Certainly looked that way ✅
HOFU? Certainly looked that way ✅
BTD? Well, that one was already afoot, and it continued today ✅
Even Ron Burgundy was surprised by today's boil over! 😉
Indeed, a stunning turnaround! From oh so close to bear market oblivion (for example, if that 23 Mach candle closed on its low) — to seemingly hooray, there's nothing more to worry about! 🥳
Stunning, but not out of the realms of possibility given how things work in the world at the moment.
So, is that it? Is the worst behind us? 🤔
No idea! You tell me — then we'll both know!
It will be what it will be. My job is simply to do the Analysis, Accept the probabilities that are attached to that analysis, and then to Act by managing my risk accordingly.
One risk now is that markets recover, putting cash holdings in a substantially inferior position. Another is that the bad stuff returns (in the next 5-minutes, 5-days, or 5-weeks) to plunge us back into chaos again.
Given those competing possibilities... 1/2RP doesn't sound like a crazy place to be! ⚖️
View
Ironically, our tentative move between 1/3RP and 1/2RP was underway — triggered by last Thursday's candle. Clearly, now, 1/2RP is my target exposure for my ASX portfolio. If I see the trend ribbons return to acting as zones of dynamic demand — or a strong demand-side candle closing within the near proximity of the 9201 all time high — I will enact the move to 2/3RP.
Key levels
9201, the all time high, is the key point of supply. Below it there likely remains a degree of trepidation among market participants.
Demand now moves back to the dynamic short- and long-term trend ribbons (presently 8655-8737). A test and hold of that range would really confirm this newfound semblance of demand-side control.
**NEW VIDEO DROPPED — Forget Trump, forget the Middle East, this is how to trade ASX stocks!**
ChartWatch *LIVE* Webinar
ChartWatch *LIVE* Webinars – WEEKLY Wednesday's @ 12pm AEDT
Learn more about technical analysis and trend following through real case studies on ASX stocks. Australia's premier technical analyst, Carl Capolingua, shares his unique insights on stocks as requested by viewers. Ask about a company in your portfolio or anything related to trading and investing and get Carl's expert opinion.
Places are limited so >REGISTER NOW!<
Economy
Today
There weren't any major economic data releases in our time zone today.
Later this week
Thursday
04:00 USA FOMC Meeting Minutes
22:30 USA March Personal Consumption Expenditures (PCE)
Core PCE Price Index: +0.4% m/m forecast vs +0.4% m/m in February
Personal Income: +0.3% m/m forecast vs +0.4% m/m in February
Personal Spending: +0.6% m/m forecast vs +0.4% m/m in February
Friday
11:30 CHN March Consumer Price Index (CPI) (+1.2% p.a. forecast vs +1.3% p.a. in February)
11:30 CHN March Producer Price Index (PPI) (+0.4% p.a. forecast vs -0.9% p.a. in February)
22:30 USA Core CPI (+1.0% m/m forecast vs +0.3% m/m in February)
Saturday
00:00 USA Prelim April UoM Consumer Sentiment (51.6 forecast vs 53.3 in February)
Latest News
Interesting Movers
Trading higher
+75.0% Resolution Minerals (RML) – Resolution Secures White House FAST-41 Status.
+19.5% Zip (ZIP) – No news, general strength across the broader Financials sector today.
+18.9% Bellevue Gold (BGL) – March 2026 Quarterly Production Update, general strength across the broader Precious Metals sector today.
+18.4% Firefly Metals (FFM) – Green Bay drilling establishes continuity of high-grade core, general strength across the broader Precious Metals sector today.
+17.8% Larvotto Resources (LRV) – No news, general strength across the broader Precious Metals sector today.
+16.7% Black Cat Syndicate (BC8) – No news, general strength across the broader Precious Metals sector today.
+15.6% Kingsgate Consolidated (KCN) – No news, general strength across the broader Precious Metals sector today.
+15.1% Unico Silver (USL) – No news, general strength across the broader Precious Metals sector today.
+14.7% Ora Banda Mining (OBM) – No news, general strength across the broader Precious Metals sector today.
+14.1% L1 (L1G) – No news, general strength across the broader Financials sector today.
+14.0% Greatland Resources (GGP) – March 2026 Quarter Production Update, general strength across the broader Precious Metals sector today.
+13.9% Andean Silver (ASL) – No news, general strength across the broader Precious Metals sector today.
+13.8% Sun Silver (SS1) – No news, general strength across the broader Precious Metals sector today.
+13.3% Temple & Webster (TPW) – No news, general strength across the broader Consumer Discretionary sector today.
+12.6% Brazilian Rare Earths (BRE) – No news, general strength across the broader Critical Minerals sector today.
+12.5% Siteminder (SDR) – No news, general strength across the broader Information Technology sector today.
+12.4% Guzman Y Gomez (GYG) – Continued positive response to 07-Apr Q3 FY26 Quarterly Sales Update, general strength across the broader Consumer Discretionary sector today.
+12.2% Lovisa (LOV) – No news, upgraded to buy from neutral at UBS, general strength across the broader Consumer Discretionary sector today.
+11.9% Life360 (360) – No news, general strength across the broader Information Technology sector today.
+11.7% Virgin Australia (VGN) – No news, general strength across the broader Consumer Discretionary sector today.
Trading lower
-17.0% (OOO) – No news, general weakness across the broader Energy sector today (long crude oil ETF).
-13.5% Droneshield (DRO) – CEO and Chairman Transitions & Trading Update, general weakness across the broader Defence sector today.
-13.1% Karoon Energy (KAR) – No news, general weakness across the broader Energy sector today.
-10.4% Woodside Energy (WDS) – No news, general weakness across the broader Energy sector today.
-9.4% New Hope Corp. (NHC) – No news, general weakness across the broader Energy sector today.
-9.2% Yancoal Australia (YAL) – No news, general weakness across the broader Energy sector today.
-8.3% Viva Energy (VEA) – No news, general weakness across the broader Energy sector today.
-7.3% Beach Energy (BPT) – No news, general weakness across the broader Energy sector today.
-7.0% BetaShares US EQY Strong Bear ETF (BBUS) – No news (short US stocks ETF).
-6.5% BetaShares Aus Equities Strong Bear ETF (BBOZ) – No news (short ASX stocks ETF).
-5.7% Origin Energy (ORG) – No news, general weakness across the broader Utilities sector today.
-5.3% Whitehaven Coal (WHC) – No news, general weakness across the broader Energy sector today.
-4.1% Santos (STO) – Alaska appraisal success and major projects update, general weakness across the broader Energy sector today.
-3.9% Ampol (ALD) – No news, general weakness across the broader Energy sector today.
-3.2% Amplitude Energy (AEL) – No news, general weakness across the broader Energy sector today.
Broker Moves
Ampol (ALD)
Retained at overweight at Morgan Stanley; Price Target: $35.00 from $31.00
Amcor Plc (AMC)
Upgraded to buy from accumulate at Ord Minnett; Price Target: $66.00 from $70.00
AMP (AMP)
Retained at buy at UBS; Price Target: $1.65 from $1.75
Amotiv (AOV)
Retained at outperform at Macquarie; Price Target: $11.90
Eagers Automotive (APE)
Retained at outperform at Macquarie; Price Target: $30.70
ARB Corporation (ARB)
Retained at neutral at Citi; Price Target: $22.05
Retained at outperform at Macquarie; Price Target: $29.95
Retained at buy at Ord Minnett; Price Target: $31.00
Autosports Group (ASG)
Retained at outperform at Macquarie; Price Target: $5.19
Boss Energy (BOE)
Retained at neutral at Citi; Price Target: $1.60 from $1.25
Bank of Queensland (BOQ)
Retained at hold at CLSA; Price Target: $6.50 from $6.40
Retained at underperform at Jefferies; Price Target: $5.76 from $5.75
Retained at neutral at JPMorgan; Price Target: $6.40
Retained at neutral at Macquarie; Price Target: $6.25 from $6.50
Downgraded to lighten from hold at Ord Minnett; Price Target: $6.00
Retained at buy at UBS; Price Target: $7.50
Domino's Pizza Enterprises (DMP)
Upgraded to neutral from sell at Citi; Price Target: $17.50 from $17.45
Dexus (DXS)
Retained at underweight at Morgan Stanley; Price Target: $6.37 from $7.15
Elevra Lithium (ELV)
Retained at outperform at Macquarie; Price Target: $10.30
FleetPartners Group (FPR)
Retained at outperform at Macquarie; Price Target: $3.36
Gorilla Gold Mines (GG8)
Retained at speculative buy at Canaccord Genuity; Price Target: $1.00
GQG Partners Inc. (GQG)
Retained at buy at UBS; Price Target: $2.00
Gentrack Group (GTK)
Initiated at hold at Ord Minnett; Price Target: $5.63
Guzman Y Gomez (GYG)
Retained at neutral at Jarden; Price Target: $17.30 from $17.10
Upgraded to overweight from neutral at JPMorgan; Price Target: $22.50 from $21.00
Retained at outperform at Macquarie; Price Target: $26.50
Retained at overweight at Morgan Stanley; Price Target: $26.30
Retained at buy at Ord Minnett; Price Target: $32.00 from $31.00
Retained at sector perform at RBC Capital Markets; Price Target: $20.00 from $19.00
Retained at buy at UBS; Price Target: $22.00 from $21.00
HUB24 (HUB)
Retained at neutral at UBS; Price Target: $86.00 from $100.00
IGO (IGO)
Retained at outperform at Macquarie; Price Target: $9.75
Retained at buy at UBS; Price Target: $9.05
Kinatico (KYP)
Retained at buy at Bell Potter; Price Target: $0.38 from $0.40
L1 Group (L1G)
Retained at neutral at UBS; Price Target: $1.28
Lovisa Holdings (LOV)
Upgraded to buy from neutral at UBS; Price Target: $26.00 from $29.00
Liontown (LTR)
Retained at neutral at Macquarie; Price Target: $1.80
Retained at buy at UBS; Price Target: $2.20
MA Financial Group (MAF)
Retained at buy at UBS; Price Target: $10.40 from $12.10
Magellan Financial Group (MFG)
Retained at neutral at UBS; Price Target: $9.90
McMillan Shakespeare (MMS)
Retained at neutral at Macquarie; Price Target: $16.40
Navigator Global Investments (NGI)
Retained at buy at UBS; Price Target: $3.45
Netwealth Group (NWL)
Retained at neutral at UBS; Price Target: $24.15 from $28.35
NEXTDC (NXT)
Retained at buy at UBS; Price Target: $22.55
PLS Group (PLS)
Retained at outperform at Macquarie; Price Target: $5.50
Retained at neutral at UBS; Price Target: $5.20
PMET Resources Inc (PMT)
Retained at buy at UBS; Price Target: $0.80
Pinnacle Investment Management Group (PNI)
Retained at neutral at UBS; Price Target: $18.65
PWR Holdings (PWH)
Initiated at outperform at CLSA; Price Target: $10.25
PEXA Group (PXA)
Retained at outperform at Macquarie; Price Target: $18.35 from $19.60
Ramelius Resources (RMS)
Retained at buy at Argonaut Securities; Price Target: $6.60 from $6.40
Retained at buy at Euroz Hartleys; Price Target: $6.21
Retained at overweight at JPMorgan; Price Target: $5.60
Retained at outperform at Macquarie; Price Target: $4.60
Retained at buy at Shaw and Partners; Price Target: $6.50
Smartgroup Corporation (SIQ)
Retained at outperform at Macquarie; Price Target: $9.20
Washington H. Soul Pattinson and Co. (SOL)
Retained at hold at Morgans; Price Target: $41.85 from $43.15
Saturn Metals (STN)
Retained at speculative buy at Canaccord Genuity; Price Target: $1.00
Telix Pharmaceuticals (TLX)
Retained at outperform at CLSA; Price Target: $20.50
Retained at buy at Jefferies; Price Target: $24.30 from $23.40
Retained at overweight at Morgan Stanley; Price Target: $24.60
Retained at outperform at RBC Capital Markets; Price Target: $18.00
Retained at buy at UBS; Price Target: $31.00
Torque Metals (TOR)
Retained at speculative buy at Canaccord Genuity; Price Target: $0.55
Viva Energy Group (VEA)
Retained at equal-weight at Morgan Stanley; Price Target: $2.59 from $2.18
Ventia Services Group (VNT)
Retained at outperform at Macquarie; Price Target: $6.45 from $6.55
Wildcat Resources (WC8)
Retained at buy at Shaw and Partners; Price Target: $1.20
Scans
Top Gainers
Code | Company | Last | % Chg |
|---|---|---|---|
| RML | Resolution Minerals Ltd | $0.077 | +75.00% |
| DAF | Discovery Alaska Ltd | $0.018 | +38.46% |
| ACS | Accent Resources NL | $0.065 | +30.00% |
| AVM | Advance Metals Ltd | $0.105 | +29.63% |
| C1X | Cosmos Exploration Ltd | $0.24 | +26.32% |
Top Fallers
Code | Company | Last | % Chg |
|---|---|---|---|
| BTN | Butn Ltd | $0.031 | -22.50% |
| OOO | Betashares Crude Oil INDEX Currncy HDG Complex ETF | $8.75 | -16.98% |
| REC | Recharge Metals Ltd | $0.025 | -16.67% |
| CMB | Cambium Bio Ltd | $0.345 | -15.85% |
| A1N | Arn Media Ltd | $0.20 | -14.89% |
52 Week Highs
Code | Company | Last | % Chg |
|---|---|---|---|
| ACS | Accent Resources NL | $0.065 | +30.00% |
| FTI | Fortifai Ltd | $0.565 | +17.71% |
| PC2 | PC Gold Ltd | $1.10 | +15.18% |
| CR9 | Corella Resources Ltd | $0.016 | +14.29% |
| GGP | Greatland Resources Ltd | $15.23 | +14.00% |
52 Week Lows
Code | Company | Last | % Chg |
|---|---|---|---|
| BTN | Butn Ltd | $0.031 | -22.50% |
| A1N | Arn Media Ltd | $0.20 | -14.89% |
| IRD | Iron Road Ltd | $0.016 | -11.11% |
| PAR | Paradigm Biopharmaceuticals Ltd | $0.225 | -10.00% |
| DME | Dome Gold Mines Ltd | $0.054 | -8.48% |
Near Highs
Code | Company | Last | % Chg |
|---|---|---|---|
| IHD | iShares S&P/ASX DIV Opportunities Esg Screened ETF | $17.35 | +2.00% |
| OBL | Omni Bridgeway Ltd | $1.675 | +2.13% |
| BILL | iShares Core Cash ETF | $100.78 | -0.01% |
| MVB | Vaneck Australian Banks ETF | $45.40 | +3.44% |
| HGBL | Betashares Global Shares Currency Hedged ETF | $78.00 | +3.07% |
Relative Strength Index (RSI) Oversold
Code | Company | Last | % Chg |
|---|---|---|---|
| HBRD | Betashares Australian Credit Income Active ETF | $10.04 | 0.00% |
| SGP | Stockland | $4.04 | +1.51% |
| UNI | Universal Store Holdings Ltd | $7.32 | +2.24% |
| FSI | Flagship Investments Ltd | $1.36 | -3.89% |
| PXA | Pexa Group Ltd | $12.39 | +1.31% |
