News | Market Wraps
Evening Wrap: ASX 200 slides on tech wreck as golden run continues, LYC +5% vs A2M -12%
The S&P/ASX 200 closed 29.4 points lower, down 0.33%.

Mentioned
The S&P/ASX 200 closed 29.4 points lower, down 0.33%.
Life360 (360) (-7.5%), Wisetech Global (WTC) (-4.4%), Megaport (MP1) (-3.5%), Xero (XRO) (-2.6%), Siteminder (SDR) (-2.6%), Car Group (CAR) (-2.6%)… tech and communications services stocks were under extreme pressure today...
But, whilst tech stocks threw us the blue screen of death... Gold stocks continued their merry run, with Capricorn Metals (CMM) (+4.1%), Genesis Minerals (GMD) (+3.7%) and Perseus Mining (PRU) (+3.6%) sector standouts. Goldies were joined today by major rare earths and base metals producers like Lynas Rare Earths (LYC) (+5.2%) and South32 (S32) (+1.4%).
Be sure to click/scroll through for the usual reporting of the major sector and stock-specific moves, the broker responses to them, as well as all the key economic data in tonight's Evening Wrap.
Also, I have detailed technical analysis on the Nasdaq composite and the S&P/ASX 200 in today's ChartWatch.
Let's dive in!
Today in Review
Mon 19 Jan 26, 5:05pm (AEST)
Name | Value | % Chg |
|---|---|---|
Major Indices | ||
| ASX 200 | 8,874.7 | -0.33% |
| All Ords | 9,195.1 | -0.34% |
| Small Ords | 3,960.9 | +0.10% |
| All Tech | 3,292.3 | -2.28% |
| Emerging Companies | 3,397.1 | +1.28% |
Currency | ||
| AUD/USD | 0.6697 | +0.20% |
US Futures | ||
| S&P 500 | 6,919.5 | -0.82% |
| Dow Jones | 49,195.0 | -0.71% |
| Nasdaq | 25,405.5 | -1.10% |
Name | Value | % Chg |
|---|---|---|
Sector | ||
| Utilities | 9,312.6 | +0.99% |
| Materials | 22,959.4 | +0.42% |
| Energy | 8,653.9 | +0.20% |
| Industrials | 8,579.5 | -0.24% |
| Real Estate | 3,949.1 | -0.42% |
| Consumer Staples | 11,758.3 | -0.48% |
| Financials | 9,226.9 | -0.57% |
| Health Care | 34,071.9 | -0.61% |
| Consumer Discretionary | 4,036.1 | -0.76% |
| Communication Services | 1,714.8 | -1.11% |
| Information Technology | 2,060.1 | -2.49% |
Markets
%20intraday%20chart_19%20Jan.png)
ASX 200 Session Chart
The S&P/ASX 200 (XJO) finished 29.4 points lower at 8,874.5, roughly mid-range, 0.33% from its session high and 0.21% from its low. In the broader-based S&P/ASX 300 (XKO) advancers lagged decliners by 115 to 164.
Fund flows: A tiny cork... bobbing on the surface... 🌊
It looks like I got a bit ahead of myself last week. Sorry, clearly, I gave the ASX 200 a.k.a. the Old Tin Pot too much credit when I said in Friday’s edition of ChartWatch:
“Next week, I could be doing technical analysis on the Golden Le Creuset! 💪”
No golden performance for us so far this week — just the all too familiar tune:
There are Winner Sectors…
Gold Sub-Index (XGD) (+2.9%)
Resources (XJR) (+0.6%)
There are Loser Sectors…
Health Care (XHJ) (-0.6%)
Consumer Discretionary (XDJ) (-0.8%)
Communication Services (XTJ) (-1.1%)
Information Technology (XIJ) (-2.5%)
And there’s a Swinger Sector…
Financials (XFJ) (-0.6%)
As much as we strung together a few sessions last week, where for the most part, everything was pulling in the right direction — today is a stark reminder that GLOBAL fund flows rarely turn on a dime.
It’s also a reminder that the OTP is a mere cork bobbing on the surface of those global flows. 🌊
We have too many sectors that are weak points — too few that are strong points (e.g., no AI or growth-tech sectors to speak of), and if the banks don’t swing the right way on a particular day — then as we saw today, the ASX 200 is vulnerable to a slide.
%20chart_19%20Jan.png)
%20chart_19%20Jan.png)
Top: S&P/ASX 200 Resources Index chart vs Bottom: S&P/ASX 200 Information Technology Sector Index
I’ve noticed the “sector rotation” theme is finally working its way into broader media markets commentary (as it's becoming blatantly obvious to the regular “XXX was up and YYY was down today” finance journo’s!). But my long suffering Evening Wrap connoisseurs — you know that I’ve been writing about this rotation for just about as long as it’s been going on… and it’s been going on for a very long time now!
The XJR vs XIJ chart comparison above is a telling one: fund flows play a vital part in which sectors (and which stocks within them) sink or swim against the global tide of money. If you're smart enough to work at one of the big funds or big investment banks, then you'll be well across all the macroeconomic and liquidity factors driving these flows.
If you're not, then I suggest you either better get really good at monitoring, analysing, and understanding those flows... or you better improve your proficiency at reading a chart.
I know that I'm preaching to the converted on that last point in most cases... as in... Think back to a time when you did stuff without consulting a chart first (hopefully with my trend ribbons attached! 😉)? I trust you now agree it was/is akin to flying blind! 🙈
Stock Specific: How the mighty are falling 🌠
Life360 (360) (-7.5%), Wisetech Global (WTC) (-4.4%), Megaport (MP1) (-3.5%), Xero (XRO) (-2.6%), Siteminder (SDR) (-2.6%), Car Group (CAR) (-2.6%)… tech and communications services stocks were under extreme pressure today. Each of these stocks has featured heavily in ChartWatch ASX Scans Downtrends List over the last 3-months — well, since the dark green ribbon in the XIJ chart above turned amber. ⚠️🚨
Perhaps my favourite / most pleasing call in this regard, however, is that of Pro Medicus (PME) (-6.8%). I just love the fact that prior to October’s break down, it was such a market darling. It’s was / still is a top pick with most institutional investors, and similarly highly rated among the big brokers.
%20chart%2019%20Jan%202026.png)
Pro Medicus chart: First run as a ChartWatch ASX Scans Feature Downtrend Chart (i.e., highest conviction) on 29-Oct 2025 @ $269.31. It has made 23 subsequent Downtrends List appearances, including 17 as Feature.
Make no mistake: I get it wrong plenty of times and they get it right plenty of times — and look at that false signal in March during the Trump Tariff War shenanigans! Simply, this is such a beautiful chart… such a perfect template for trend reversal, that I would be remiss not to share it with you today! 😍
The other thing I want to stress with this chart is this: Most investors are desperate to find out when to buy. This is why this entire industry is devoted to servicing this need. This chart demonstrates that it’s just as important to understand / have a system for when to sell — after all, it’s at the selling that we determine our profit or loss.
Today's best blue chip gainers
Company | Last Price | Change $ | Change % | 1mo % | 1yr % |
|---|---|---|---|---|---|
Lynas Rare Earths (LYC) | $16.28 | +$0.8 | +5.2% | +30.3% | +125.8% |
Capricorn Metals (CMM) | $15.37 | +$0.61 | +4.1% | +11.4% | +120.5% |
Genesis Minerals (GMD) | $7.57 | +$0.27 | +3.7% | +17.4% | +176.3% |
Perseus Mining (PRU) | $6.04 | +$0.21 | +3.6% | +12.1% | +122.9% |
Northern Star Resources (NST) | $27.68 | +$0.85 | +3.2% | +5.9% | +60.2% |
Evolution Mining (EVN) | $13.53 | +$0.41 | +3.1% | +11.7% | +148.7% |
Bluescope Steel (BSL) | $31.63 | +$0.62 | +2.0% | +33.0% | +59.7% |
ASX (ASX) | $53.30 | +$0.81 | +1.5% | +2.3% | -17.3% |
South32 (S32) | $4.22 | +$0.06 | +1.4% | +22.7% | +23.4% |
Newmont Corp. (NEM) | $171.64 | +$2.39 | +1.4% | +16.1% | +164.3% |
Nextdc (NXT) | $13.15 | +$0.15 | +1.2% | +1.5% | -12.3% |
Ramelius Resources (RMS) | $4.59 | +$0.05 | +1.1% | +25.8% | +107.7% |
APA Group (APA) | $8.80 | +$0.09 | +1.0% | -3.5% | +28.3% |
Origin Energy (ORG) | $11.05 | +$0.11 | +1.0% | -4.3% | -1.3% |
Mirvac Group (MGR) | $2.04 | +$0.02 | +1.0% | -0.5% | +7.9% |
AGL Energy (AGL) | $8.73 | +$0.07 | +0.8% | -7.2% | -23.5% |
Rio Tinto (RIO) | $149.38 | +$1.13 | +0.8% | +6.5% | +25.0% |
Washington H. Soul Pattinson (SOL) | $38.42 | +$0.28 | +0.7% | +8.5% | +15.3% |
Treasury Wine Estates (TWE) | $5.53 | +$0.04 | +0.7% | +0.7% | -47.5% |
GPT Group (GPT) | $5.56 | +$0.04 | +0.7% | +2.0% | +23.8% |
Today's worst blue chip losers
Company | Last Price | Change $ | Change % | 1mo % | 1yr % |
|---|---|---|---|---|---|
The A2 Milk Company (A2M) | $8.30 | -$1.1 | -11.7% | -9.8% | +46.1% |
Life360 (360) | $27.04 | -$2.19 | -7.5% | -17.3% | +27.5% |
Pro Medicus (PME) | $189.10 | -$13.8 | -6.8% | -16.3% | -25.5% |
Wisetech Global (WTC) | $64.07 | -$2.95 | -4.4% | -6.3% | -47.1% |
James Hardie (JHX) | $34.35 | -$1.35 | -3.8% | +13.8% | -33.3% |
Amcor PLC (AMC) | $64.10 | -$2.13 | -3.2% | +2.1% | -17.0% |
Xero (XRO) | $100.89 | -$2.74 | -2.6% | -9.3% | -38.9% |
Car Group (CAR) | $29.55 | -$0.78 | -2.6% | -3.9% | -21.8% |
Orica (ORI) | $25.53 | -$0.51 | -2.0% | +4.8% | +52.2% |
Fortescue (FMG) | $22.39 | -$0.43 | -1.9% | +1.3% | +18.8% |
REA Group (REA) | $185.18 | -$3.32 | -1.8% | -0.3% | -20.6% |
Telix Pharmaceuticals (TLX) | $11.28 | -$0.2 | -1.7% | -10.2% | -55.1% |
Resmed Inc (RMD) | $38.40 | -$0.63 | -1.6% | +0.6% | +3.6% |
Netwealth Group (NWL) | $25.24 | -$0.41 | -1.6% | -6.2% | -5.0% |
Aristocrat Leisure (ALL) | $56.86 | -$0.89 | -1.5% | -0.5% | -19.7% |
Dyno Nobel (DNL) | $3.38 | -$0.05 | -1.5% | +5.3% | +13.4% |
Santos (STO) | $6.14 | -$0.09 | -1.4% | +0.5% | -14.0% |
Technology One (TNE) | $26.87 | -$0.39 | -1.4% | -1.1% | -5.4% |
Insurance Australia Group (IAG) | $7.53 | -$0.09 | -1.2% | -4.7% | -11.8% |
Goodman Group (GMG) | $31.24 | -$0.37 | -1.2% | +6.1% | -15.0% |
ChartWatch
Nasdaq Composite Index
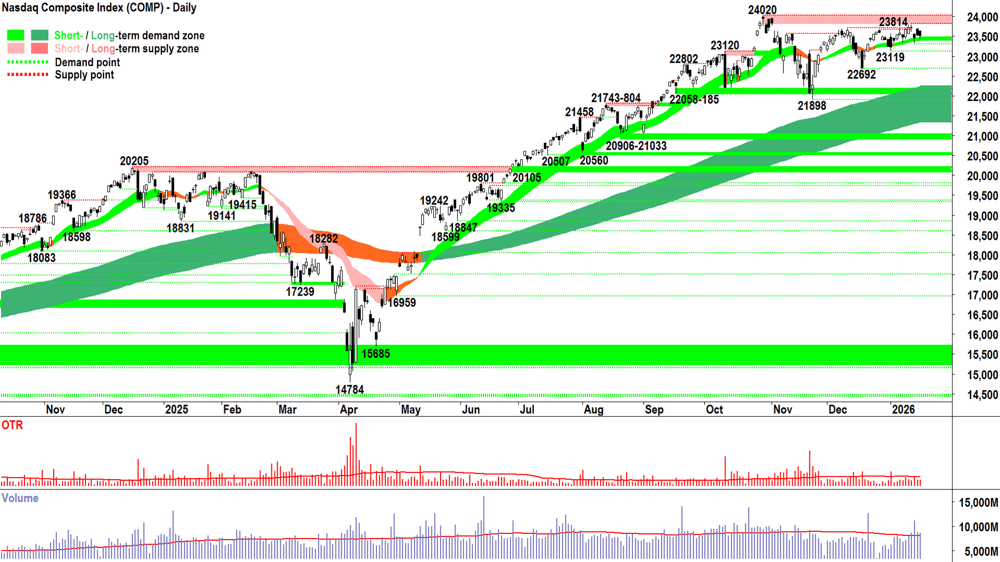
Analysis
On Friday, I noted that the Comp was stuck between “the rock”: i.e., the dynamic demand afforded by the short term uptrend ribbon (plus the general demand-side controlled nature of the technicals) and “the hard place”: i.e., the proving increasingly difficult to break wall of latent supply between 23814-24020.
Friday’s candle:
Black bodied
Small downward pointing shadow dipping nearly-perfectly into the short term uptrend ribbon
Above average volume
Fits perfectly within this narrative. More specifically that:
The market is INDECISIVE = there’s a decent whack of demand hitting up against a decent whack of supply; prices are largely unchanged over the last few weeks… neither party has definitive control. 👎
There are roughly as many market participants that believe stocks are good value around current prices as those who believe that they aren’t…
As trend followers, we love CONSENSUS.
It is our HOLY GRAIL. 🏆
The greater the consensus… the greater will be the imbalance between demand and supply.
For example:
Consensus: This stock/commodity/index/currency/cyrpto/stamp/piece of art/pair of sneakers/Pokémon card etc. is the absolute best thing i can do with my money right now taking into account all of the other things i could be doing with my money right now = D 💪💪💪
Consensus: I already own that thing mentioned above, hanging onto it is worth more than the money i could get for it right now — or anything else i could possibly buy with that money = S 🚫🚫🚫
When D = 💪💪💪 and S = 🚫🚫🚫 — you tell me what’s going to happen to price? 🤔
Of course, how P moves will help us understand more than just the fact there’s a consensus… it will speak to the size of the imbalance between D and S. It will speak to the motivation of the demand- and supply-sides.
And, really, that’s all I’m trying to do with my charts. You can see that I’ve pared back all of the tools in my toolbox to only those that try to understand the balance or imbalance between D and S.
I don’t use any fandangled indicators — because the vast majority of them obfuscate D vs S by bastardising P using mathematics. The people who created these indicators wanted to distil D vs P down to a number. 👎
Trends, price action, candles, volume. D isn’t a number… It’s a picture. And as they say in the classics: A picture tells a thousand words! 😉
Anyways, my point is this:
The last few Comp candles smack far more of INDECISION than CONSENSUS. So, if the market is undecided, how can we as trend followers, be drawing any strong conclusions? We can’t.
But bigger picture, I’m happy to back the broader trend: which is up. 📈
What I would like to see:
A strong demand-side candle (i.e., one with a long white-body and or long downward pointing shadow)
High session close (indicating sustained excess demand into the close = likely to continue next session)
In the current scenario where we’re trying to crack a known, stubborn supply zone = substantially above average volume = increased demand-side participation consuming and removing deadwood supply!
What I wouldn’t like to see:
The opposite of the above on the first two points, nor either of those first two points occurring a big whack of volume = consuming and removing of demand! ⚠️
View
No change: I remain comfortable at my 2/3RP portfolio risk limit 🪣 (RP = Risk Position — it reflects my personal allowable capital allocation limit for my investments in US stocks. So 1/2RP is 50%, 2/3RP is 67% and FRP is 100%).
Key levels
The trough at 23119 is the closest point of demand — a close below it would signal the demand-side is under pressure again — but I propose that it's not until a close below the next, lower point of demand at 22692 that we can assume they've lost control of the Comp's price. On a close below 21898 the short term trend is unequivocally down and the long term uptrend is likely under significant pressure = ⚠️. 23814-24020 is the nearest critical zone of supply — the Comp must close within this zone with a strong demand-side candle to confirm the demand-side is unequivocally back in control of the Comp's price.
S&P/ASX 200 (XJO)
%20chart_19%20Jan.png)
Analysis
Today’s candle wasn’t a complete disaster, but it could have been one if we didn’t get that last 75-minute recovery. The lack of volume suggests a demand-side strike for whatever reason — rather than an emphatic supply-side showing.
Conclusion: Let’s give the OTP the benefit of the doubt for now. As I said Friday, prior to today, 7 of the last 8 candles were white-bodied — and the last 5 of those were decent demand-side showings. ✅
Still, we both know that the OTP is far from covering itself in glory from a technical perspective! So, we’ll continue to take a “cautiously optimistic” approach.
The short term uptrend ribbon (presently 8736-8757) is now the critical level of dynamic excess demand — a close below there ends the present short term uptrend. Beyond it, a close below the last static point of demand at 8675 is a major no-no.
Ideally, we see a quick snap back, moving and closing above Friday’s 8916 high with an emphatic demand-side candle with a high close. If I see that, I’m going to grow far more confident that this recent tentative swing higher is the real deal. 🧐
View
I remain comfortable at 2/3RP 🪣 (i.e., my personal allowable capital allocation limit for my investments in Australian stocks is now 67%).
Key levels
The short term trend ribbon is the closest zone of (dynamic) demand (presently 8736-8757). 8675 is the closest static point of demand. A close below the short term uptrend ribbon would neutralise the present short term uptrend, while a close below 8675 almost certainly would end it. The October all-time highs around 9110-9116 is the next key zone of supply.
ChartWatch *LIVE* Webinar
ChartWatch *LIVE* Webinars – WEEKLY Wednesday's @ 12pm AEDT
Learn more about technical analysis and trend following through real case studies on ASX stocks. Australia's premier technical analyst, Carl Capolingua, shares his unique insights on stocks as requested by viewers. Ask about a company in your portfolio or anything related to trading and investing and get Carl's expert opinion.
Places are limited so >REGISTER NOW!<
Economy
Today
AUS MI Inflation Gauge m/m
Result: +1.0% m/m vs +0.3% m/m in December
CHN January "Data Dump"
Fixed Asset Investment: -3.8% ytd/y vs -3.1% ytd/y forecast and -2.6% ytd/y in December
GDP q/y: +4.5% q/y vs +4.5% q/y forecast and +4.8% q/y in December
Industrial Production y/y: +5.2% y/y vs +5.1% y/y forecast and +4.8% y/y in December
Retail Sales y/y: +0.9% y/y vs +1.1% y/y forecast and +1.3% y/y in December
Unemployment Rate: +5.1% vs +5.2% forecast and +5.1% in December
Later this week
Tuesday
12:00 CHN 1-year and 5-year Loan Prime Rate (no change forecast)
Wednesday
10:30 AUD MI Leading Index m/m (0% m/m in December)
Thursday
00:30 USA President Trump speaks at World Economic Forum
11:30 AUD December Unemployment Data
Employment change: +4.4% m/m forecast vs +4.3% p.a. in November
Rate: 4.4% forecast vs 4.3% in November
Friday
00:30 USA September Final Gross Domestic Product (GDP) (+4.3% q/q forecast vs +4.3% q/q previous)
00:30 USA Core Personal Consumption Expenditures (PCE) Price Index (+0.2% m/m forecast)
09:00 AUD January Flash Purchasing Managers Index (PMI) (51.6 m/m in December)
Manufacturing: previous 51.6
Services: previous 51.1
Saturday
01:15 USA January Flash PMI
Manufacturing: previous 51.6
Services: previous 51.1
Latest News
Interesting Movers
Trading higher
+16.1% Energy Transition Minerals (ETM) – No news, general strength across the broader Critical Minerals sector today, rise is consistent with prevailing short and long term uptrends, a recent regular in ChartWatch ASX Scans Uptrends list 🔎📈
+15.9% Amaero (3DA) – Quarterly Activities Report and Appendix 4C.
+15.1% Calix (CXL) – No news, general strength across the broader Critical Minerals sector today, rise is consistent with prevailing short and long term uptrends, a recent regular in ChartWatch ASX Scans Uptrends list 🔎📈
+13.8% Viridis Mining and Minerals (VMM) – No news, general strength across the broader Critical Minerals sector today, rise is consistent with prevailing short and long term uptrends, a recent regular in ChartWatch ASX Scans Uptrends list 🔎📈
+13.6% Boss Energy (BOE) – No news, general strength across the broader Uranium sector today, upgraded to overweight from underweight at Morgan Stanley (price target retained at $2.05).
+9.8% Antipa Minerals (AZY) – Change in substantial holding (Copia Investment Management 12.95% from 11.82%).
+9.8% Lotus Resources (LOT) – No news, general strength across the broader Uranium sector today.
+9.8% Silver Mines (SVL) – No news, general strength across the broader Silver sector today, rise is consistent with prevailing short and long term uptrends, a regular in ChartWatch ASX Scans Uptrends list 🔎📈
+9.7% Marmota (MEU) – No news, general strength across the broader Precious Metals sector today, rise is consistent with prevailing short and long term uptrends, a regular in ChartWatch ASX Scans Uptrends list 🔎📈
+9.5% Silex Systems (SLX) – No news, general strength across the broader Uranium sector today.
+9.4% Sun Silver (SS1) – Maverick Springs land position doubled, general strength across the broader Silver sector today, rise is consistent with prevailing short and long term uptrends, a regular in ChartWatch ASX Scans Uptrends list 🔎📈
+9.3% Meteoric Resources (MEI) – No news, general strength across the broader Critical Minerals sector today, rise is consistent with prevailing short and long term uptrends, a recent regular in ChartWatch ASX Scans Uptrends list 🔎📈
+8.1% Sunrise Energy Metals (SRL) – No news, general strength across the broader Critical Minerals sector today, rise is consistent with prevailing short and long term uptrends, a regular in ChartWatch ASX Scans Uptrends list 🔎📈
+8.0% Polymetals Resources (POL) – Notice of Extraordinary General Meeting, general strength across the broader Silver sector today, rise is consistent with prevailing short and long term uptrends, a regular in ChartWatch ASX Scans Uptrends list 🔎📈
+5.2% Lynas Rare Earths (LYC) - No news, upgraded to overweight from equal-weight at Morgan Stanley (price target retained at $17.55), rise is consistent with prevailing short and long term uptrends, a recent regular in ChartWatch ASX Scans Uptrends list 🔎📈
Trading lower
-11.7% The A2 Milk Company (A2M) – 1H26 Results Announcement Date and Webcast Notification and Response to ASX Price Query.
-8.8% Lumos Diagnostics Holdings (LDX) – Lumos secures follow on contract with Aptatek.
-7.5% Life360 (360) – No news, general weakness across the broader Information Technology sector today, fall is consistent with prevailing short and long term downtrends, a regular in ChartWatch ASX Scans Downtrends list 🔎📉
-6.8% Pro Medicus (PME) – No news, general weakness across the broader HealthCare sector today, fall is consistent with prevailing short and long term downtrends, a regular in ChartWatch ASX Scans Downtrends list 🔎📉
-4.4% Wisetech Global (WTC) – No news, general weakness across the broader Information Technology sector today, fall is consistent with prevailing short and long term downtrends, a regular in ChartWatch ASX Scans Downtrends list 🔎📉
-2.6% Xero (XRO) – No news, general weakness across the broader Information Technology sector today, fall is consistent with prevailing short and long term downtrends, a regular in ChartWatch ASX Scans Downtrends list 🔎📉
-2.6% Car Group (CAR) – No news, general weakness across the broader Communication Services sector today, fall is consistent with prevailing short and long term downtrends, a regular in ChartWatch ASX Scans Downtrends list 🔎📉
Broker Moves
29Metals (29M)
Retained at underweight at Jarden; Price Target: $0.41
Retained at sector perform at RBC Capital Markets; Price Target: $0.55 from $0.50
4DMedical (4DX)
Downgraded to sell from accumulate at Ord Minnett; Price Target: $3.20 from $1.90
AIC Mines (A1M)
Retained at speculative buy at Ord Minnett; Price Target: $0.75 from $0.56
Australian Clinical Labs (ACL)
Retained at sector perform at RBC Capital Markets; Price Target: $2.80 from $3.00
Amplitude Energy (AEL)
Retained at outperform at Macquarie; Price Target: $4.00
Aeris Resources (AIS)
Retained at speculative buy at Ord Minnett; Price Target: $0.85 from $0.62
Alkane Resources (ALK)
Retained at accumulate at Ord Minnett; Price Target: $1.70 from $1.40
Amcor Plc (AMC)
Retained at buy at Morgans; Price Target: $76.00 from $15.20
Aurelia Metals (AMI)
Retained at buy at Ord Minnett; Price Target: $0.45 from $0.37
Ansell (ANN)
Retained at outperform at RBC Capital Markets; Price Target: $41.00 from $39.00
Austral Resources Australia (AR1)
Retained at buy at Shaw and Partners; Price Target: $0.20
ASX (ASX)
Retained at neutral at UBS; Price Target: $52.38
Bellevue Gold (BGL)
Retained at neutral at Jarden; Price Target: $1.05 from $1.00
Retained at outperform at RBC Capital Markets; Price Target: $2.10 from $2.00
BHP Group (BHP)
Retained at overweight at Morgan Stanley; Price Target: $56.50
Retained at sector perform at RBC Capital Markets; Price Target: $49.00
Boss Energy (BOE)
Upgraded to overweight from underweight at Morgan Stanley; Price Target: $2.05
Retained at hold at Ord Minnett; Price Target: $1.15
Beach Energy (BPT)
Retained at underperform at Macquarie; Price Target: $0.76
Bathurst Resources (BRL)
Retained at speculative buy at Ord Minnett; Price Target: $0.90 from $0.80
Champion Iron (CIA)
Downgraded to overweight from buy at Jarden; Price Target: $5.70
Cochlear (COH)
Upgraded to outperform from sector perform at RBC Capital Markets; Price Target: $325.00 from $295.00
Coronado Global Resources Inc (CRN)
Retained at hold at Ord Minnett; Price Target: $0.48 from $0.38
Capstone Copper Corp. (CSC)
Retained at hold at Ord Minnett; Price Target: $14.50
CSL (CSL)
Upgraded to outperform from sector perform at RBC Capital Markets; Price Target: $230.00 from $226.00
Endeavour Group (EDV)
Retained at equal-weight at Morgan Stanley; Price Target: $4.10 from $4.30
Evolution Mining (EVN)
Retained at underweight at Jarden; Price Target: $7.10 from $6.70
Retained at hold at Ord Minnett; Price Target: $12.45 from $10.50
Retained at underperform at RBC Capital Markets; Price Target: $10.00 from $10.10
FireFly Metals (FFM)
Retained at outperform at RBC Capital Markets; Price Target: $2.50 from $2.45
Flight Centre Travel Group (FLT)
Retained at overweight at Morgan Stanley; Price Target: $16.50 from $15.40
Fortescue (FMG)
Retained at underweight at Jarden; Price Target: $17.00
Downgraded to underweight from overweight at Morgan Stanley; Price Target: $19.75
Retained at sector perform at RBC Capital Markets; Price Target: $23.00 from $22.00
Greatland Resources (GGP)
Retained at neutral at Jarden; Price Target: $5.20 from $5.00
Retained at sector perform at RBC Capital Markets; Price Target: $11.10 from $10.00
Gemlife Communities Group (GLF)
Retained at accumulate at Morgans; Price Target: $5.70 from $5.40
Genesis Minerals (GMD)
Upgraded to hold from sell at Bell Potter; Price Target: $8.65 from $4.45
Retained at accumulate at Ord Minnett; Price Target: $8.40 from $7.30
Healius (HLS)
Retained at sector perform at RBC Capital Markets; Price Target: $0.95 from $1.05
Insurance Australia Group (IAG)
Retained at buy at UBS; Price Target: $7.57
Integral Diagnostics (IDX)
Retained at outperform at RBC Capital Markets; Price Target: $3.50 from $3.45
IGO (IGO)
Retained at neutral at Citi; Price Target: $9.30 from $5.60
Retained at neutral at Jarden; Price Target: $5.15
Retained at underweight at Morgan Stanley; Price Target: $8.40
Retained at sector perform at RBC Capital Markets; Price Target: $7.50 from $6.50
Iluka Resources (ILU)
Retained at overweight at Morgan Stanley; Price Target: $7.30
Retained at sell at Ord Minnett; Price Target: $6.00
ioneer (INR)
Retained at speculative buy at Ord Minnett; Price Target: $0.35
Karoon Energy (KAR)
Retained at neutral at Macquarie; Price Target: $1.65
L1 Group (L1G)
Retained at neutral at UBS; Price Target: $1.08
Lunnon Metals (LM8)
Retained at buy at Shaw and Partners; Price Target: $0.80
Lotus Resources (LOT)
Retained at speculative buy at Ord Minnett; Price Target: $0.38
Liontown (LTR)
Retained at sell at Citi; Price Target: $1.70 from $0.50
Retained at underweight at Jarden; Price Target: $0.58
Lynas Rare Earths (LYC)
Upgraded to overweight from equal-weight at Morgan Stanley; Price Target: $17.55
Retained at sell at Ord Minnett; Price Target: $10.50
Mader Group (MAD)
Upgraded to buy from hold at Bell Potter; Price Target: $9.00
Mineral Resources (MIN)
Retained at sell at Jarden; Price Target: $20.00
Retained at outperform at RBC Capital Markets; Price Target: $65.00 from $55.00
Metals X (MLX)
Retained at buy at Ord Minnett; Price Target: $1.05
Medibank Private (MPL)
Retained at neutral at UBS; Price Target: $4.71
Monash IVF Group (MVF)
Retained at sector perform at RBC Capital Markets; Price Target: $0.75
Nanosonics (NAN)
Upgraded to sector perform from underperform at RBC Capital Markets; Price Target: $4.00
Navigator Global Investments (NGI)
Retained at buy at Ord Minnett; Price Target: $3.70 from $3.50
NIB Holdings (NHF)
Retained at neutral at UBS; Price Target: $6.68
Northern Star Resources (NST)
Retained at underweight at Jarden; Price Target: $17.20 from $18.00
Retained at accumulate at Ord Minnett; Price Target: $28.20 from $27.00
Retained at sector perform at RBC Capital Markets; Price Target: $28.00
Oneview Healthcare Plc (ONE)
Retained at speculative buy at Bell Potter; Price Target: $0.50 from $0.25
Paladin Energy (PDN)
Retained at overweight at Morgan Stanley; Price Target: $12.05
Retained at sell at Ord Minnett; Price Target: $7.50
PLS Group (PLS)
Upgraded to hold from sell at Bell Potter; Price Target: $4.55 from $2.65
Retained at neutral at Citi; Price Target: $5.25 from $3.25
Retained at neutral at Jarden; Price Target: $2.40
Retained at overweight at Morgan Stanley; Price Target: $5.25
Retained at outperform at RBC Capital Markets; Price Target: $5.00 from $4.30
Pantoro Gold (PNR)
Retained at buy at Ord Minnett; Price Target: $7.30 from $6.40
Polymetals Resources (POL)
Retained at speculative buy at Ord Minnett; Price Target: $1.75 from $1.35
QBE Insurance Group (QBE)
Retained at buy at UBS; Price Target: $19.74
Regis Healthcare (REG)
Downgraded to sector perform from outperform at RBC Capital Markets; Price Target: $7.75 from $8.00
Rio Tinto (RIO)
Retained at equal-weight at Morgan Stanley; Price Target: $138.00
Retained at sector perform at RBC Capital Markets; Price Target: $134.00 from $132.00
ResMed Inc. (RMD)
Retained at outperform at RBC Capital Markets; Price Target: $311.00 from $303.00
Ramelius Resources (RMS)
Retained at buy at Ord Minnett; Price Target: $5.10 from $4.40
Retained at sector perform at RBC Capital Markets; Price Target: $3.90 from $3.50
Regis Resources (RRL)
Retained at outperform at RBC Capital Markets; Price Target: $9.70 from $9.60
Reliance Worldwide Corporation (RWC)
Downgraded to neutral from buy at Citi; Price Target: $4.25
South32 (S32)
Retained at overweight at Morgan Stanley; Price Target: $4.70
Retained at outperform at RBC Capital Markets; Price Target: $4.20 from $3.90
St Barbara (SBM)
Retained at hold at Ord Minnett; Price Target: $0.65 from $0.58
Retained at outperform at RBC Capital Markets; Price Target: $1.45
Sandfire Resources (SFR)
Retained at underweight at Jarden; Price Target: $14.70
Retained at underweight at Morgan Stanley; Price Target: $16.15
Retained at accumulate at Ord Minnett; Price Target: $20.50 from $17.30
Retained at outperform at RBC Capital Markets; Price Target: $20.00 from $18.00
Sheffield Resources (SFX)
Retained at hold at Ord Minnett; Price Target: $0.11
Sonic Healthcare (SHL)
Downgraded to hold from outperform at CLSA; Price Target: $24.35 from $28.00
Retained at sector perform at RBC Capital Markets; Price Target: $23.00 from $27.00
Santana Minerals (SMI)
Retained at outperform at RBC Capital Markets; Price Target: $1.20 from $1.15
Stanmore Resources (SMR)
Retained at buy at Ord Minnett; Price Target: $3.70 from $2.60
Service Stream (SSM)
Retained at buy at Citi; Price Target: $2.65
Santos (STO)
Retained at outperform at Macquarie; Price Target: $7.75
Super Retail Group (SUL)
Retained at underweight at Morgan Stanley; Price Target: $14.00 from $14.40
Southern Cross Gold Consolidated (SX2)
Retained at sector perform at RBC Capital Markets; Price Target: $8.00 from $7.60
Syrah Resources (SYR)
Retained at overweight at Jarden; Price Target: $0.34
Telix Pharmaceuticals (TLX)
Upgraded to outperform from sector perform at RBC Capital Markets; Price Target: $17.00
Vault Minerals (VAU)
Retained at neutral at Jarden; Price Target: $3.75 from $3.70
Retained at buy at Ord Minnett; Price Target: $7.10 from $6.00
Retained at outperform at RBC Capital Markets; Price Target: $6.55
Woodside Energy Group (WDS)
Retained at neutral at Macquarie; Price Target: $25.00
Westgold Resources (WGX)
Retained at buy at Ord Minnett; Price Target: $7.65 from $6.60
Retained at outperform at RBC Capital Markets; Price Target: $7.70 from $7.80
Whitehaven Coal (WHC)
Downgraded to equal-weight from overweight at Morgan Stanley; Price Target: $8.75
Retained at accumulate at Ord Minnett; Price Target: $9.50 from $7.60
Zip Co (ZIP)
Retained at buy at UBS; Price Target: $5.20 from $5.40
Scans
Top Gainers
Code | Company | Last | % Chg |
|---|---|---|---|
| RVT | Richmond Vanadium Technology Ltd | $0.19 | +46.15% |
| PET | Phoslock Environmental Technologies Ltd | $0.02 | +42.86% |
| DAL | Dalaroo Metals Ltd | $0.099 | +33.78% |
| AAU | Antilles Gold Ltd | $0.013 | +30.00% |
| ENX | Enegex Ltd | $0.29 | +28.89% |
Top Fallers
Code | Company | Last | % Chg |
|---|---|---|---|
| TOU | Tlou Energy Ltd | $0.015 | -16.67% |
| EPN | Epsilon Healthcare Ltd | $0.028 | -15.15% |
| AEG | Aland Equity Group Ltd | $0.031 | -13.89% |
| AGN | Argenica Therapeutics Ltd | $0.26 | -13.33% |
| CTO | Citigold Corporation Ltd | $0.02 | -13.04% |
52 Week Highs
Code | Company | Last | % Chg |
|---|---|---|---|
| RVT | Richmond Vanadium Technology Ltd | $0.19 | +46.15% |
| DAL | Dalaroo Metals Ltd | $0.099 | +33.78% |
| AAU | Antilles Gold Ltd | $0.013 | +30.00% |
| 1AE | Aurora Energy Metals Ltd | $0.145 | +23.40% |
| LNQ | LINQ Minerals Ltd | $0.725 | +22.88% |
52 Week Lows
Code | Company | Last | % Chg |
|---|---|---|---|
| JPR | Jupiter Energy Ltd | $0.022 | -12.00% |
| 3PL | 3P Learning Ltd | $0.565 | -9.60% |
| FOS | FOS Capital Ltd | $0.205 | -4.65% |
| TD1 | Tali Digital Ltd | $0.05 | -3.85% |
| AMCDD | Amcor Plc | $64.10 | -3.22% |
Near Highs
Code | Company | Last | % Chg |
|---|---|---|---|
| SMLL | Betashares Australian Small Companies Select ETF | $4.92 | +0.82% |
| DYM | Dynamic Metals Ltd | $0.60 | +8.11% |
| GLPR | iShares Ftse GBL Property Ex Aus (Aud Hedged) ETF | $27.44 | +0.55% |
| DFND | Vaneck Global Defence ETF | $45.07 | +1.85% |
| WVOL | iShares MSCI World Ex Aust Minimum Volatility ETF | $45.52 | -0.26% |
Top Gainers
Code | Company | Last | % Chg |
|---|---|---|---|
| RVT | Richmond Vanadium Technology Ltd | $0.19 | +46.15% |
| PET | Phoslock Environmental Technologies Ltd | $0.02 | +42.86% |
| DAL | Dalaroo Metals Ltd | $0.099 | +33.78% |
| AAU | Antilles Gold Ltd | $0.013 | +30.00% |
| ENX | Enegex Ltd | $0.29 | +28.89% |
