News | Market Wraps
Evening Wrap: ASX 200 logs sixth loss as mining, tech and healthcare stocks sag on rising crude price, energy and lithium soar
The S&P/ASX 200 closed 55.7 points lower, down 0.64%.

Mentioned
The S&P/ASX 200 closed 55.7 points lower, down 0.64%.
The ASX 200 made it six down days in a row as oil's seventh straight daily gain pushed Brent crude above US$110 a barrel and forced a broad repricing of risk across rate-sensitive and growth-oriented sectors. With CPI data due Wednesday and the RBA meeting next week, investors were in no mood to take chances.
In stock specific news:
European Lithium (EUR) (+45.6%) — struck a US$835 million merger deal with Nasdaq-listed Critical Metals Corp, valuing the miner at 58¢ per share — a 137% premium to the undisturbed price
Elsight (ELS) (+4.3%) — its Halo connectivity platform was added to the US Department of Defense's Defense Contract Management Agency Blue List
Whitehaven Coal (WHC) (+3.9%) — beat analyst expectations in the March quarter, with stronger-than-expected saleable coal production
Reliance Worldwide (RWC) (+3.6%) — reaffirmed its full-year earnings outlook and reported stable trading conditions
Pilbara Minerals (PLS) (+3.0%) — lifted alongside sector peers after UBS upgraded its spodumene price forecasts by up to 23% near-term and 17% longer-term, citing stronger EV demand, accelerating energy storage build-out, and emerging supply constraints linked to the Iran conflict
Pantoro Gold (PNR) (-11.3%) — March quarter gold production of 17,757 ounces fell sharply from 22,071 ounces in the prior quarter due to the impact of Cyclone Mitchell
Domino's Pizza Enterprises (DMP) (-10.7%) — tracked a near-9% overnight plunge in its US-listed namesake following a disappointing first-quarter result that missed expectations
Origin Energy (ORG) (-3.9%) — UBS downgraded its price target and earnings forecasts following a disappointing trading update released Monday
Be sure to click/scroll through for the usual reporting of the major sector and stock-specific moves, the broker responses to them, as well as all the key economic data in tonight's Evening Wrap.
Also, I have detailed technical analysis on the Nasdaq Composite and the S&P/ASX 200 in today's ChartWatch.
Let's dive in!
Today in Review
Tue 28 Apr 26, 4:57pm (AEST)
Name | Value | % Chg |
|---|---|---|
Major Indices | ||
| ASX 200 | 8,710.7 | -0.64% |
| All Ords | 8,935.0 | -0.62% |
| Small Ords | 3,468.3 | -0.78% |
| All Tech | 2,783.9 | -1.58% |
| Emerging Companies | 3,103.4 | -1.03% |
Currency | ||
| AUD/USD | 0.7174 | -0.17% |
US Futures | ||
| S&P 500 | 7,198.75 | -0.10% |
| Dow Jones | 49,372.0 | +0.06% |
| Nasdaq | 27,361.75 | -0.29% |
Name | Value | % Chg |
|---|---|---|
Sector | ||
| Energy | 10,777.8 | +1.20% |
| Financials | 9,522.8 | +0.06% |
| Consumer Staples | 12,713.7 | -0.61% |
| Industrials | 7,903.2 | -0.85% |
| Materials | 23,406.8 | -0.89% |
| Communication Services | 1,708.6 | -1.11% |
| Health Care | 25,829.5 | -1.24% |
| Real Estate | 3,482.9 | -1.24% |
| Information Technology | 1,745.8 | -1.61% |
| Utilities | 10,122.7 | -2.28% |
| Consumer Discretionary | 3,377.7 | -2.31% |
Markets
%20intraday%20chart_28%20Apr.png)
ASX 200 Session Chart
The S&P/ASX 200 (XJO) finished 55.7 points lower at 8,710.7, 0.64% from its session high and just 0.2% from its low. Perhaps indicating a worse performance than shown at benchmark level, in the broader-based S&P/ASX 300 (XKO) advancers lagged decliners by a dismal 79 to 202. 👎
Energy (XEJ) (+1.2%) was the only sector to finish in the green on a day when oil did the heavy lifting alone. Brent crude rose for a seventh consecutive session, reaching US$110.92/bbl — its longest winning streak since January and its first sustained run above US$100 since early April. Surprise, surprise: US-Iran talks stalled and shipping through the Strait of Hormuz remains at a near-standstill.
Coal stocks were particularly strong, with Newcastle coal futures gaining 1.6% to US$135.15/t and SGX Australian Premium Coking Coal adding 0.3% to US$229.75/t — Whitehaven Coal (WHC) (+3.9%) and Yancoal Australia (YAL) (+3.6%) were the standout movers.
Downstream energy also found buyers — Viva Energy (VEA) (+3.5%) continued its post-refinery-fire recovery. Woodside Energy (WDS) (+0.8%) and Santos (STO) (+1.2%) both edged higher. Among uranium names, Deep Yellow (DYL) (+3.9%) advanced despite broader sector volatility.
Financials (XFJ) (+0.1%) scraped into the green — the only other sector to avoid a loss — with Commonwealth Bank (CBA) (+0.9%) acting as a safe-haven anchor for investors seeking mega-cap shelter. Perpetual (PPT) (+1.9%), GQG Partners (GQG) (+1.8%), and Judo Capital (JDO) (+1.7%) were also firmer. ANZ (ANZ) (+0.3%) edged up, though the other major banks were flat to marginally lower.
The Gold Sub-Index (XGD) (-2.7%) was the worst performer of the session. The reason is straightforward: rising oil prices stoke inflation expectations, which push up bond yields, which raises the opportunity cost of holding gold — an asset with no income. COMEX gold futures fell 0.9% to US$4,650/oz and silver futures dropped 2.2% to US$73.90/oz. Among stocks, Pantoro Gold (PNR) (-11.3%) was the hardest hit, compounded by its weak quarterly result. West African Resources (WAF) (-6.9%), Black Cat Syndicate (BC8) (-6.5%), and Newmont (NEM) (-4.5%) also fell sharply.
Consumer Discretionary (XDJ) (-2.3%) was hit hard as higher benchmark bond yields pointed to tightening mortgage conditions and greater pressure on consumer spending. The sector's most persistently weak names absorbed the bulk of the selling — Domino's Pizza Enterprises (DMP) (-10.7%) was the session's most dramatic mover, with Bapcor (BAP) (-4.4%), IDP Education (IEL) (-3.7%), and Myer (MYR) (-3.6%) all lower.
Utilities (XUJ) (-2.3%) matched Consumer Discretionary as the day's second-worst sector. As a bond-proxy sector — rising risk-free yields make these stocks comparatively less attractive. The sector's pain was compounded by a continuation of the Origin Energy (ORG) (-3.9%) selldown following Monday's poorly received trading update and a UBS downgrade. AGL Energy (AGL) (-1.5%) was also lower.
Real Estate (XPJ) (-1.3%) was caught in the same bond-proxy crossfire as utilities, with Stockland (SGP) (-2.2%) and Goodman Group (GMG) (-1.8%) both declining.
Information Technology (XIJ) (-1.6%) extended its recent losing run as higher yields weighed on long-duration growth stocks. Life360 (360) (-4.5%) and Megaport (MP1) (-4.4%) were both sharply lower.
Another long duration sector, Health Care (XHJ) (-1.2%), also came under under pressure, Higher-risk biotech and growth names bore the brunt with 4DMEDICAL (4DX) (-5.2%), Clarity Pharmaceuticals (CU6) and Nanosonics (NAN) (-4.9%) sharply lower.
Communication Services (XTJ) (-1.1%) was dragged lower by its advertising and media-exposed constituents, which tend to suffer when consumer sentiment deteriorates and discretionary ad budgets come under pressure.
Materials (XMJ) (-0.9%) were broadly weaker as COMEX copper fell 0.3% to US$6.00/lb and SGX iron ore futures eased 0.1% to US$106.35/t. BHP (BHP) (-1.3%), South32 (S32) (-1.8%), and Sandfire Resources (SFR) (-2.9%) all declined.
The notable exceptions were in lithium and rare earths, where a UBS sector upgrade and ongoing geopolitical supply-security concerns drove sharp gains. UBS lifted its near-term spodumene forecasts by up to 23% and long-term estimates by 17%, citing stronger EV demand, accelerating energy storage build-out, and the impact of the Iran conflict on EV-versus-petrol total cost of ownership economics.
Elevra Lithium (ELV) (+6.3%), PMET Resources (PMT) (+6.0%), Mineral Resources (MIN) (+4.0%), Liontown Resources (LTR) (+3.9%), and Pilbara Minerals (PLS) (+3.0%) were all stronger.
Rare earths stocks also found buyers despite NdPr prices in China holding flat at 765,000 CNY/t — Arafura Rare Earths (ARU) (+7.2%), Lynas Rare Earths (LYC) (+3.5%), and Iluka Resources (ILU) (+3.3%) all advanced, likely reflecting growing investor focus on supply security for critical materials as the geopolitical backdrop remains unstable.
Today's best blue chip gainers
Company | Last Price | Change $ | Change % | 1mo % | 1yr % |
|---|---|---|---|---|---|
Mineral Resources (MIN) | $61.37 | +$2.36 | +4.0% | +10.9% | +198.3% |
Whitehaven Coal (WHC) | $8.00 | +$0.3 | +3.9% | -9.1% | +57.5% |
Lynas Rare Earths (LYC) | $18.71 | +$0.63 | +3.5% | -6.5% | +118.6% |
PLS Group (PLS) | $6.11 | +$0.18 | +3.0% | +22.9% | +296.8% |
IGO (IGO) | $7.49 | +$0.17 | +2.3% | -1.8% | +97.6% |
Fortescue (FMG) | $20.11 | +$0.34 | +1.7% | +1.3% | +22.8% |
Bluescope Steel (BSL) | $30.00 | +$0.4 | +1.4% | +11.8% | +33.6% |
Ampol (ALD) | $34.26 | +$0.43 | +1.3% | +3.4% | +47.4% |
Santos (STO) | $7.74 | +$0.09 | +1.2% | -1.4% | +26.5% |
Commonwealth Bank of Australia (CBA) | $174.61 | +$1.53 | +0.9% | +0.8% | +7.1% |
Woodside Energy (WDS) | $32.40 | +$0.27 | +0.8% | -5.8% | +56.8% |
Resmed (RMD) | $30.69 | +$0.21 | +0.7% | -5.6% | -16.5% |
F&P Healthcare (FPH) | $29.39 | +$0.16 | +0.5% | -5.6% | -8.6% |
Bendigo and Adelaide Bank (BEN) | $10.61 | +$0.04 | +0.4% | +4.1% | -4.8% |
Capricorn Metals (CMM) | $11.49 | +$0.04 | +0.3% | +8.8% | +23.4% |
Telix Pharmaceuticals (TLX) | $14.74 | +$0.05 | +0.3% | +14.1% | -45.3% |
ANZ (ANZ) | $36.03 | +$0.09 | +0.3% | -1.7% | +21.9% |
JB HI-FI (JBH) | $76.12 | +$0.17 | +0.2% | +1.9% | -25.4% |
Hub24 (HUB) | $83.85 | +$0.14 | +0.2% | +0.6% | +18.3% |
Coles (COL) | $22.97 | +$0.02 | +0.1% | +5.0% | +7.4% |
Today's worst blue chip losers
Company | Last Price | Change $ | Change % | 1mo % | 1yr % |
|---|---|---|---|---|---|
Newmont (NEM) | $158.69 | -$7.47 | -4.5% | +9.5% | +90.0% |
Life360 (360) | $20.15 | -$0.94 | -4.5% | +6.2% | -5.7% |
Aristocrat Leisure (ALL) | $46.20 | -$2.03 | -4.2% | -1.0% | -29.6% |
Cleanaway Waste (CWY) | $2.21 | -$0.09 | -3.9% | -5.2% | -16.0% |
Origin Energy (ORG) | $11.66 | -$0.47 | -3.9% | -5.7% | +8.1% |
Light & Wonder (LNW) | $116.32 | -$3.93 | -3.3% | -6.5% | -12.5% |
Evolution Mining (EVN) | $12.69 | -$0.39 | -3.0% | +0.4% | +58.8% |
Seek (SEK) | $14.06 | -$0.43 | -3.0% | +1.5% | -34.1% |
Sandfire Resources (SFR) | $16.72 | -$0.5 | -2.9% | +5.0% | +63.3% |
Northern Star Resources (NST) | $21.50 | -$0.64 | -2.9% | +14.6% | +8.1% |
Regis Resources (RRL) | $7.20 | -$0.21 | -2.8% | +13.4% | +60.4% |
Treasury Wine Estates (TWE) | $4.36 | -$0.11 | -2.5% | +29.4% | -50.5% |
Cochlear (COH) | $93.00 | -$2.25 | -2.4% | -43.9% | -65.7% |
Genesis Minerals (GMD) | $6.27 | -$0.15 | -2.3% | +7.2% | +59.1% |
CSL (CSL) | $128.90 | -$2.92 | -2.2% | -10.7% | -47.5% |
Stockland (SGP) | $4.07 | -$0.09 | -2.2% | -4.9% | -24.9% |
Steadfast (SDF) | $4.19 | -$0.09 | -2.1% | +1.0% | -28.1% |
Wesfarmers (WES) | $72.31 | -$1.55 | -2.1% | -1.5% | -4.5% |
Xero (XRO) | $79.44 | -$1.58 | -2.0% | +9.7% | -50.2% |
ChartWatch
Nasdaq Composite Index
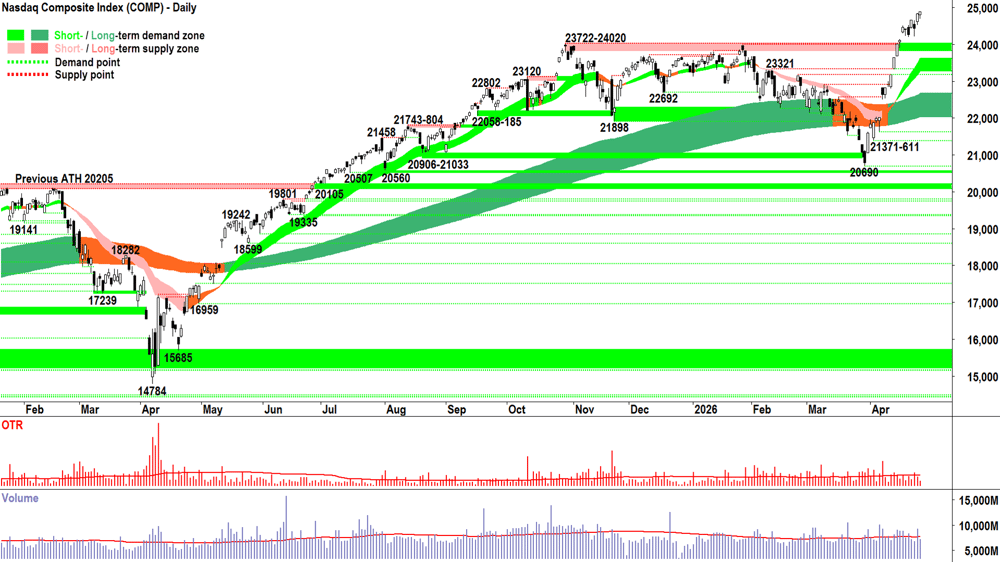
Analysis
It’s been a couple of candles since we last chatted, but in true the trend MOTN just does it’s thing form, the Comp has logged another couple of decent demand side showings:
2 x white bodies with 2 x downward pointing shadows + 2 x close at session high = FOMO ✅ + HOFU ✅ + BTD ✅
Equals demand side control. Equals MOTN the Comp’s price should continue to rise under that demand side control. 📈
My dear long-suffering ChartWatch readers: Anything else anyone ever told you about markets is noise… Pure fluff! 🐩
“It’s gone up too much”
“It’s sure to crash”
“It’s too expensive here”
“The market has gone crazy”
“But don’t they care about the risks?”
“I can’t buy here… as soon as I do — it’s guaranteed to crash!!!” 💥
I concede that you’ve been indoctrinated by your wonderful mum to believe that what you think matters. “Johnny, Cindy, you’re a delicate little snowflake, you will have an immeasurable impact on the world! Off you go… tell the world what you think… show it what you can do!” 💪
Well Johnny and Cindy, Uncle Carl ain’t so kind! 🧐
Because when it comes to markets: You and your opinions don’t stand for squat (oh yes, of course you are a delicate little snowflake everywhere else in life!!! ❄️😉).
The market doesn’t care whether you think the Comp, or any other thing that trades, is about to go up or down. It doesn’t care whether you think stuff is cheap or expensive, and it definitely doesn’t care whether you think Company XYZ is a good investment or not…
And this might be a relief to some. No, the market doesn’t care whether you buy or sell. Nope, not even you 🫵
The market isn’t waiting for you to buy so it can crash… or for you to finally give up and sell in disgust so it can immediately reverse course and board a rocket ship to the moon! 🚀
The market is going to do whatever the market is going to do. And there’s nothing you can say, think, or do to prevent it.
So, now that I’ve completely decimated your view of your standing in the market… What can you do about your complete and utter irrelevance within it? 🤔
Answer: Embrace it! Wrap yourself in it — for it is your greatest weapon!
🛑 Stop trying to control the market with your opinions — instead, don’t have any opinions. Simply defer to the market’s will = i.e., The Trend!
Concede: I don’t need to know why something is happening to take advantage of the fact that it’s happening. I won’t get it right all the time. I won’t buy at the bottom, and I won’t sell at the top. And that’s okay. 🧘
I only have to get it right MOTN. And when I do, I just have to make more on my winners than I must inevitably lose on my losers.
Folllow the trend. Manage risk. Never assume I know what’s going to happen next (because that’s impossible). Be consistent and disciplined in the process…
And the rest will take care of itself! ✅
View
What does all the above mean? FRP (RP = Risk Position — it reflects my personal allowable capital allocation limit for my investments in US stocks. So 1/2RP is 50%, 2/3RP is 67% and FRP is 100% 🪣). I don't know what's going to happen next, only that right now, the chart above is a picture of excess demand.
Key levels
There are no key supply zones to contend with. The old all-time high supply zone of 23722-24020 will likely act as a short term zone of demand, however the short-term trend ribbon (presently 23264-23612) is now the key zone of demand. If the price closes back below this range, the supply-side is very likely back in control of the Comp's price.
S&P/ASX 200 (XJO)
%20chart_28%20Apr.png)
Analysis
If the Comp's chart is a "picture of excess demand", then how would we describe the chart of the ASX 200, aka "The Old Tin Pot"? 🤔
We could say that with:
ST Trend = ➡️ + price is BELOW the short term trend ribbon + short term trend ribbon is NOT acting as a zone of dynamic demand ⚠️
LT Trend = ⬆️ + price is NOT ABOVE the long term uptrend ribbon + long term uptrend ribbon is NOT yet acting as a zone of dynamic demand ⚠️
Price action = falling peaks and falling troughs (i.e., 🚫BTD + 🚫FOMO + 🚫HOFU) ⚠️
Candles = predominantly supply side in nature (i.e. black-bodied and or with upward pointing shadows) = programmed sell orders dominant ⚠️
= ⚠️⚠️⚠️⚠️ = MOTN ➡️ or ⬇️
It’s a chart of total indecision. Neither the demand or supply sides of the market are committed enough in terms of motivation (i.e., 📈 price action and long demand side candles) or size (i.e., above-average volume) to control the OTP's price.
This is result is a soggy equilibrium that is trapping the OTP's price roughly smack-bang in the middle of the 8262-9201 trading range it’s been stuck in since August last year. 😭
It’s not a total write off — the last push from 8262-9022 was strong and convincing, versus the recent pullback is only relatively mild. But the OTP must put up or shut up soon — or it risks being written off as an insignificant backwater of occasional fund manager interest (i.e., when mining stocks or high yielding big banks are in vogue! 🤦).
View
I propose 1/2RP 🪣 has been totally vindicated here (i.e., my personal allowable capital allocation limit for my investments in Australian stocks is 50%).
Key levels
9201, the all time high, is the key point of supply. Below it there likely remains a degree of trepidation among market participants. A close above the last peak at 9022 would be constructive.
The OTP is below the short-term trend ribbon (presently 8796-8808) — definitely not a good look! The long term uptrend (presently 8686-8864) must hold to stave off a retracement back to the 8262-8379 lows.
(Glossary of acronyms! MOTN: More Often Than Not | FOMO: Fear Of Missing Out | HOFU: Holding On For Upside | BTD: Buy The Dip | STR: Sell The Rally | RP: Risk Position)
ChartWatch *LIVE* Webinar
ChartWatch *LIVE* Webinars – WEEKLY Wednesday's @ 12pm AEDT
Learn more about technical analysis and trend following through real case studies on ASX stocks. Australia's premier technical analyst, Carl Capolingua, shares his unique insights on stocks as requested by viewers. Ask about a company in your portfolio or anything related to trading and investing and get Carl's expert opinion.
Places are limited so >REGISTER NOW!<
Economy
Today
Bank of Japan ("BOJ") Monetary Policy Meeting
BOJ Policy Rate: No change, remains <0.75%
Later this week
Wednesday
11:30 AUS March Consumer Price Index (CPI)
Headline: +1.3% m/m forecast vs +0.0% m/m in February & +4.8% p.a. forecast vs +3.7% p.a. in February
Trimmed Mean: +0.3% m/m forecast vs +0.2% m/m in February
22:30 USA March Core Durable Goods Orders (+0.4% m/m forecast vs +0.9% m/m in February)
Thursday
04:00 USA Federal Reserve FOMC Meeting & Statement of Monetary Policy
Fed Funds Rate: 3.75% p.a. forecast, unchanged
FOMC Press Conference with Chairman Powell @ 04:30
11:30 CHN April Purchasing Managers Index ("PMI")
Manufacturing: 50.1 forecast vs 50.4 in March
Non-manufacturing: 49.9 forecast vs 50.1 in March
22:30 USA March Core Personal Consumption Expenditures ("PCE") Data
PCE Index: +0.3% m/m forecast vs +0.4% m/m in February
Personal Income: +0.3% m/m forecast vs -0.1% m/m in February
Personal Spending: +0.9% m/m forecast vs +0.5% m/m in February
Friday
ALL DAY CHN Labor Day Holiday
Saturday
11:30 USA April Institute for Supply Management ("ISM") PMI
Manufacturing: 53.1 forecast vs 52.7 in March
Manufacturing prices: 80.0 forecast vs 78.3 in March
Latest News
Interesting Movers
Trading higher
+45.6% European Lithium (EUR) – EUR to combine with CRML implied valuation $0.58 per share, general strength across the broader Lithium sector today.
+7.2% Arafura Rare Earths (ARU) – No news, general strength across the broader Rare Earths & Critical Minerals sector today, rise is consistent with prevailing short and long term uptrends, a regular in ChartWatch ASX Scans Uptrends list 🔎📈
+6.3% Elevra Lithium (ELV) – Becoming a substantial holder (Citigroup Global Markets +5.3%), general strength across the broader Lithium sector today, rise is consistent with prevailing short and long term uptrends, a regular in ChartWatch ASX Scans Uptrends list 🔎📈
+5.6% Amplitude Energy (AEL) – No news, general strength across the broader Energy sector today.
+4.3% Elsight (ELS) – Elsight's Platform Granted US Blue List Status.
+4.0% Mineral Resources (MIN) – No news, general strength across the broader Lithium sector today, rise is consistent with prevailing short and long term uptrends, a regular in ChartWatch ASX Scans Uptrends list 🔎📈
+3.9% Liontown (LTR) – No news, general strength across the broader Lithium sector today, rise is consistent with prevailing short and long term uptrends, a regular in ChartWatch ASX Scans Uptrends list 🔎📈
+3.9% Whitehaven Coal (WHC) – March 2026 Quarterly Report, general strength across the broader Energy sector today.
+3.9% Deep Yellow (DYL) – March 2026 Quarterly Activities Report, general strength across the broader Energy sector today.
+3.8% Galan Lithium (GLN) – Quarterly Activities and Cashflow Report, general strength across the broader Lithium sector today, rise is consistent with prevailing short and long term uptrends, a regular in ChartWatch ASX Scans Uptrends list 🔎📈
+3.6% Yancoal Australia (YAL) – No news, general strength across the broader Energy sector today.
+3.5% Iperionx (IPX) – Company Presentation and IperionX Webinar - Investor Update, general strength across the broader Rare Earths & Critical Minerals sector today.
+3.5% Lynas Rare Earths (LYC) – No news, general strength across the broader Rare Earths & Critical Minerals sector today.
+3.5% Viva Energy (VEA) – No news, general strength across the broader Energy sector today.
+3.3% Iluka Resources (ILU) – No news, general strength across the broader Rare Earths & Critical Minerals sector today, rise is consistent with prevailing short and long term uptrends, a regular in ChartWatch ASX Scans Uptrends list 🔎📈
+3.0% PLS Group (PLS) – No news, general strength across the broader Lithium sector today, rise is consistent with prevailing short and long term uptrends, a regular in ChartWatch ASX Scans Uptrends list 🔎📈
Trading lower
-24.5% Adisyn (AI1) – No news, pulled back in the wake of recent sharp rally following 23-Apr Adisyn Secures A$14m Placement Led by Regal and Meitav.
-14.0% Echoiq (EIQ) – EchoSolv AS deployed into Mount Sinai Health System.
-11.3% Pantoro Gold (PNR) – Quarterly Results Presentation, fall is consistent with prevailing short term downtrend and long term trend is transitioning from up to down, a recent regular in ChartWatch ASX Scans Downtrends list 🔎📉
-10.7% Domino's Pizza Enterprises (DMP) – No news, general weakness across the broader Consumer Discretionary sector today, fall is consistent with prevailing short and long term downtrends, a regular in ChartWatch ASX Scans Downtrends list 🔎📉
-7.8% Dateline Resources (DTR) – No news, fall is consistent with prevailing short term downtrend and long term trend is transitioning from up to down, a recent regular in ChartWatch ASX Scans Downtrends list 🔎📉
-6.9% West African Resources (WAF) – No news, general weakness across the broader Precious Metals sector today.
-6.5% Black Cat Syndicate (BC8) – Investor Presentation - 3Q26 Quarterly Update, general weakness across the broader Precious Metals sector today.
-6.3% Weebit Nano (WBT) – Weebit Nano Extends the Share Purchase Plan Closing Date, general weakness across the broader Information Technology sector today.
-6.2% Unico Silver (USL) – No news, general weakness across the broader Precious Metals sector today.
-5.8% Resolute Mining (RSG) – Mali Security Update, general weakness across the broader Precious Metals sector today.
-5.3% Andean Silver (ASL) – No news, general weakness across the broader Precious Metals sector today.
-5.3% Electro Optic Systems (EOS) – No news, general weakness across the broader Defence sector today.
-5.2% 4DMEDICAL (4DX) – No news, general weakness across the broader HealthCare sector today.
-5.1% Clarity Pharmaceuticals (CU6) – No news, general weakness across the broader HealthCare sector today, fall is consistent with prevailing short and long term downtrends, a regular in ChartWatch ASX Scans Downtrends list 🔎📉
Broker Moves
AML3D (AL3)
Retained at speculative buy at Bell Potter; Price Target: $0.40
Retained at buy at Shaw and Partners; Price Target: $0.40
Ampol (ALD)
Retained at overweight at Morgan Stanley; Price Target: $37.13
Retained at buy at Ord Minnett; Price Target: $36.00 from $35.50
Alkane Resources (ALK)
Retained at buy at Bell Potter; Price Target: $2.10 from $1.95
Aristocrat Leisure (ALL)
Retained at buy at UBS; Price Target: $68.90 from $69.00
Atlas Arteria (ALX)
Retained at neutral at Citi; Price Target: $4.80
Downgraded to negative from neutral at E&P; Price Target: $4.96
Retained at outperform at Macquarie; Price Target: $5.02
Downgraded to hold from accumulate at Ord Minnett; Price Target: $4.75
AMP (AMP)
Retained at buy at UBS; Price Target: $1.65
ANZ Group Holdings (ANZ)
Retained at sell at UBS; Price Target: $36.50
ASX (ASX)
Retained at neutral at UBS; Price Target: $58.85
AUB Group (AUB)
Retained at buy at UBS; Price Target: $34.00
Baby Bunting Group (BBN)
Upgraded to accumulate from hold at Morgans; Price Target: $1.79 from $2.60
Commonwealth Bank of Australia (CBA)
Retained at sell at UBS; Price Target: $130.00
Cuscal (CCL)
Retained at buy at Ord Minnett; Price Target: $5.45
Charter Hall Group (CHC)
Retained at buy at Citi; Price Target: $23.00 from $26.40
Charter Hall Long Wale REIT (CLW)
Retained at buy at Citi; Price Target: $4.10 from $4.40
Computershare (CPU)
Retained at neutral at UBS; Price Target: $32.75
EVT (EVT)
Retained at buy at Ord Minnett; Price Target: $16.41 from $17.31
FINEOS Corporation Holdings PLC (FCL)
Retained at outperform at Macquarie; Price Target: $3.50
Fortescue (FMG)
Retained at accumulate at Ord Minnett; Price Target: $20.00 from $22.50
Retained at neutral at UBS; Price Target: $19.40 from $20.40
Gorilla Gold Mines (GG8)
Retained at speculative buy at Canaccord Genuity; Price Target: $1.00
Graincorp (GNC)
Downgraded to accumulate from buy at Ord Minnett; Price Target: $7.25 from $8.60
GQG Partners Inc. (GQG)
Retained at buy at UBS; Price Target: $2.00
HUB24 (HUB)
Retained at neutral at UBS; Price Target: $91.00
Insurance Australia Group (IAG)
Retained at buy at UBS; Price Target: $8.70
IGO (IGO)
Retained at neutral at Citi; Price Target: $9.30
Retained at buy at UBS; Price Target: $9.75 from $9.05
IperionX (IPX)
Retained at speculative buy at Bell Potter; Price Target: $8.25 from $9.25
JB Hi-Fi (JBH)
Upgraded to accumulate from hold at Morgans; Price Target: $83.50 from $87.00
Judo Capital Holdings (JDO)
Retained at buy at UBS; Price Target: $2.25
Light & Wonder Inc. (LNW)
Retained at buy at UBS; Price Target: $215.00
Lovisa Holdings (LOV)
Retained at outperform at Macquarie; Price Target: $30.50
Magellan Financial Group (MFG)
Retained at neutral at UBS; Price Target: $9.90
Mirvac Group (MGR)
Retained at outperform at Macquarie; Price Target: $2.22
Mineral Resources (MIN)
Retained at buy at UBS; Price Target: $73.00 from $66.00
Megaport (MP1)
Retained at buy at Citi; Price Target: $15.00 from $14.65
Retained at buy at UBS; Price Target: $14.65
Medibank Private (MPL)
Retained at neutral at UBS; Price Target: $4.85
Medical Developments International (MVP)
Retained at buy at Bell Potter; Price Target: $0.85
Newmont Corporation (NEM)
Retained at buy at Citi; Price Target: $215.00
NIB Holdings (NHF)
Retained at neutral at UBS; Price Target: $7.05
Netwealth Group (NWL)
Retained at neutral at UBS; Price Target: $27.00
Oneview Healthcare Plc (ONE)
Retained at speculative buy at Bell Potter; Price Target: $0.45
Orezone Gold Corporation (ORE)
Retained at buy at Canaccord Genuity; Price Target: $4.25
Origin Energy (ORG)
Retained at overweight at Jarden; Price Target: $12.75 from $13.00
Retained at sector perform at RBC Capital Markets; Price Target: $14.00
Retained at buy at UBS; Price Target: $14.10 from $14.30
PLS Group (PLS)
Retained at neutral at Citi; Price Target: $5.25
Polymetals Resources (POL)
Initiated at buy at Shaw and Partners; Price Target: $1.62
PEXA Group (PXA)
Retained at neutral at UBS; Price Target: $15.70
QBE Insurance Group (QBE)
Retained at buy at UBS; Price Target: $23.95
Regis Resources (RRL)
Retained at outperform at Macquarie; Price Target: $9.50 from $9.70
Resolute Mining (RSG)
Retained at outperform at Macquarie; Price Target: $1.80
Reliance Worldwide Corporation (RWC)
Retained at neutral at Citi; Price Target: $3.90
Steadfast Group (SDF)
Retained at buy at UBS; Price Target: $6.00
Sandfire Resources (SFR)
Retained at outperform at Macquarie; Price Target: $19.30 from $19.20
Stockland (SGP)
Retained at outperform at Macquarie; Price Target: $4.42
SenSen Networks (SNS)
Retained at buy at Bell Potter; Price Target: $0.10 from $0.12
Santos (STO)
Retained at outperform at Macquarie; Price Target: $8.60
Suncorp Group (SUN)
Retained at hold at Ord Minnett; Price Target: $19.50 from $18.00
Viva Energy Group (VEA)
Retained at equal-weight at Morgan Stanley; Price Target: $2.56
West African Resources (WAF)
Retained at outperform at Macquarie; Price Target: $4.00
Westpac Banking Corporation (WBC)
Retained at neutral at UBS; Price Target: $40.00
Webjet Group (WJL)
Downgraded to neutral from buy at Goldman Sachs; Price Target: $0.62 from $0.72
Worley (WOR)
Retained at buy at Citi; Price Target: $14.00 from $17.00
wrkr (WRK)
Retained at speculative buy at Bell Potter; Price Target: $0.17 from $0.18
Scans
Top Gainers
Code | Company | Last | % Chg |
|---|---|---|---|
| 14D | 1414 Degrees Ltd | $0.042 | +133.33% |
| EUR | European Lithium Ltd | $0.415 | +45.61% |
| PPY | Papyrus Australia Ltd | $0.016 | +45.46% |
| VR8 | Vanadium Resources Ltd | $0.024 | +41.18% |
| AUZ | Australian Mines Ltd | $0.026 | +40.54% |
Top Fallers
Code | Company | Last | % Chg |
|---|---|---|---|
| DXB | Dimerix Ltd | $0.24 | -38.46% |
| MOV | Move Logistics Group Ltd | $0.14 | -28.21% |
| AI1 | Adisyn Ltd | $0.185 | -24.49% |
| CPO | Culpeo Minerals Ltd | $0.011 | -21.43% |
| TMB | Tambourah Metals Ltd | $0.038 | -19.15% |
52 Week Highs
Code | Company | Last | % Chg |
|---|---|---|---|
| AUZ | Australian Mines Ltd | $0.026 | +40.54% |
| OCN | Oceana Metals Ltd | $0.605 | +39.08% |
| CTQ | Careteq Ltd | $0.014 | +27.27% |
| FTI | Fortifai Ltd | $0.855 | +19.58% |
| ORP | Orpheus Uranium Ltd | $0.075 | +15.39% |
52 Week Lows
Code | Company | Last | % Chg |
|---|---|---|---|
| DXB | Dimerix Ltd | $0.24 | -38.46% |
| MOV | Move Logistics Group Ltd | $0.14 | -28.21% |
| SDV | Scidev Ltd | $0.099 | -17.50% |
| TWL | Trade Window Holdings Ltd | $0.16 | -15.79% |
| AVD | Avada Group Ltd | $0.09 | -14.29% |
Near Highs
Code | Company | Last | % Chg |
|---|---|---|---|
| GLN | Galan Lithium Ltd | $0.54 | +3.85% |
| HGBL | Betashares Global Shares Currency Hedged ETF | $80.74 | 0.00% |
| AHL | Adrad Holdings Ltd | $1.33 | +2.31% |
| ASIA | Betashares Asia Technology Tigers ETF | $17.63 | -0.56% |
| DGVA | Dimensional Global Value Trust - Active ETF | $28.11 | +0.07% |
Relative Strength Index (RSI) Oversold
Code | Company | Last | % Chg |
|---|---|---|---|
| DGL | DGL Group Ltd | $0.395 | 0.00% |
| OML | Ooh!Media Ltd | $0.85 | -5.03% |
| LDX | Lumos Diagnostics Holdings Ltd | $0.15 | -6.25% |
| HVN | Harvey Norman Holdings Ltd | $4.46 | -1.76% |
| JEGA | JPM Global Equity Premium Income Complex ETF | $44.50 | -0.98% |
