
News | Market Wraps
Evening Wrap: ASX 200 edges higher as tech recovery extends into second day, RHC +10%, QAN -9% on results
The S&P/ASX 200 closed 47 points higher, up 0.52%.

Mentioned
The S&P/ASX 200 closed 47 points higher, up 0.52%.
The ASX 200 extended its record run — touching an intraday record of 9202.9 — as Nvidia’s blockbuster overnight result lifted tech sentiment and a string of better-than-expected earnings kept investors in risk-on mode.
Information Technology (XIJ) (+5.1%) led the market for a second straight session on the global AI relief rally, with WiseTech Global (WTC) (+2.6%), Technology One (TNE) (+6.4%), Xero (XRO) (+8.6%) and Megaport (MP1) (+12.6%) all pushing higher.
Energy (XEJ) (-1.4%) and Utilities (XUJ) (-0.8%) lagged as investors rotated away from the prior session’s defensives and digested stock-specific weakness, led by Woodside Energy (WDS) (-1.0%) and Yancoal Australia (YAL) (-8.4%).
In stock specific news:
Ramsay Health Care (RHC) (+10.4%) — surged after underlying profit beat expectations and investors leaned into the turnaround narrative.
Qantas (QAN) (-9.2%) — fell as a profit beat was overshadowed by weaker international performance and dividend disappointment.
Worley (WOR) (-10.2%) — sold off on cost concerns, including material restructuring charges that weighed on profit.
IDP Education (IEL) (+7.6%) — jumped after its half-year beat and FY guidance upgrade helped offset a softer profit backdrop.
Cettire (CTT) (-25.6%) — plunged after swinging to a first-half loss and flagging near-term trading challenges.
Super Retail Group (SUL) (+8.4%) — rallied as sales momentum outweighed margin pressure from heavier discounting.
Perpetual (PPT) (+8.3%) — climbed after a first-half earnings beat, despite ongoing uncertainty around its wealth business sale.
In commodities, spot gold in Asia traded 0.26% lower to US$5,212/oz and spot silver was down 2% to US$89.96/oz, dragging on precious metals stocks like Northern Star Resources (NST) (-2.5%).
China-traded lithium carbonate futures extended their rebound, rising 6% to 178,020 CNY/mt, helping PLS Group (PLS) (+8.2%) and Mineral Resources (MIN) (+4.0%) outperform among lithium names.
Be sure to click/scroll through for the usual reporting of the major sector and stock-specific moves, the broker responses to them, as well as all the key economic data in tonight's Evening Wrap.
Also, I have detailed technical analysis on the Nasdaq Composite and the S&P/ASX 200 in today's ChartWatch.
Let's dive in!
Today in Review
Thu 26 Feb 26, 4:59pm (AEST)
Name | Value | % Chg |
|---|---|---|
Major Indices | ||
| ASX 200 | 9,175.3 | +0.52% |
| All Ords | 9,408.7 | +0.53% |
| Small Ords | 3,753.9 | +0.71% |
| All Tech | 2,798.3 | +3.85% |
| Emerging Companies | 3,262.7 | +0.77% |
Currency | ||
| AUD/USD | 0.713 | +0.09% |
US Futures | ||
| S&P 500 | 6,945.0 | -0.21% |
| Dow Jones | 49,415.0 | -0.24% |
| Nasdaq | 25,295.0 | -0.34% |
Name | Value | % Chg |
|---|---|---|
Sector | ||
| Information Technology | 1,787.0 | +5.19% |
| Consumer Staples | 12,857.2 | +1.61% |
| Communication Services | 1,692.0 | +1.61% |
| Health Care | 29,827.6 | +1.58% |
| Real Estate | 3,672.2 | +1.11% |
| Materials | 25,091.0 | +1.00% |
| Consumer Discretionary | 3,695.8 | +0.55% |
| Financials | 9,981.5 | -0.05% |
| Utilities | 9,981.4 | -0.75% |
| Industrials | 8,577.8 | -0.83% |
| Energy | 9,502.2 | -1.48% |
Markets
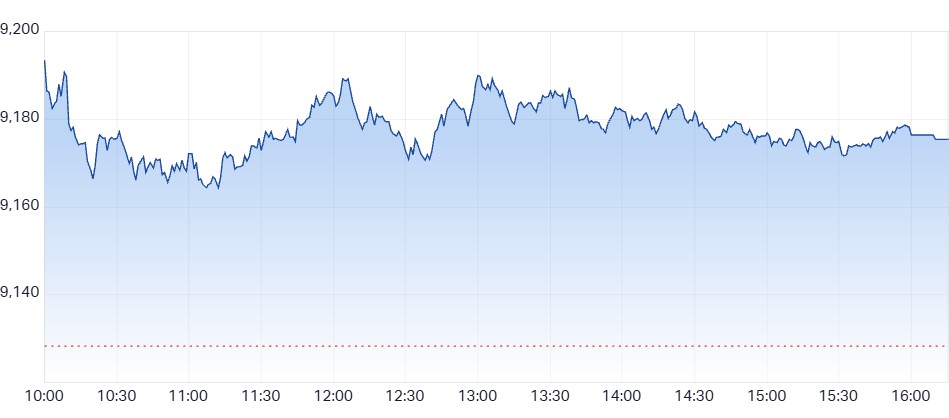
ASX 200 Session Chart
The S&P/ASX 200 (XJO) finished 47 points higher at 9,175.3, 0.51% from its session low and just 0.3% from its high. In the broader-based S&P/ASX 300 (XKO) advancers beat decliners by 182 to 101.
Fund flows: Equal opportunity for ASX stocks! ✊
Today I thought I’d take slightly different look at the elephant in the ASX 200’s (aka the Golden Le Creuset’s), room — its appalling market breadth.
Last week, I gave you some stats on how many stocks in the ASX 200 were close to their 12-month lows (lots), and conversely, how few were near their 12-month highs (not many). At the same time, in ChartWatch, I pointed out that none of this mattered — we were destined to print new highs anyway!
These divergences can play out for weeks and months before they resolve themselves, and there’s every chance the broader market catches up to the big banks and resources… But here’s a practical, and wonderfully visual tool that you can track to monitor the situation in the meantime: the S&P/ASX 200 Equal Weight Index (XEW).
If you click on that XEW ticker link, you’ll be taken to our page on the XEW where you can play around with the various chart options, including the “Advanced Chart” feature. To save you the effort this time, see the chart below…
%20chart_26%20Feb.png)
S&P/ASX 200 Equal Weight Index (XEW) chart
I should explain what the XEW is, right? 🤔
Where the traditional ASX 200 is dominated by its largest constituents — the banks, BHP & RIO, CSL & WES — the equal weight version gives every stock the same influence. In other words, it reflects the experience of the average stock.
I’ll let you do the flick up and down from this chart to the regular ASX 200 chart in ChartWatch, below. But it’s clear that the average ASX 200 stock hasn’t come along for this week’s record breaking ride.

Source: Reddit.com
I'm glad you asked! MOTN, it means this:
A rising ASX 200 alongside a weaker XEW implies the rally is being driven by fewer, larger names — a dynamic often seen in more fragile market phases.
When the XEW is performing at least as well as the ASX 200, it suggests wide participation of index constituents in performance — a dynamic often seen in lower volatility, and more durable uptrends.
These are widely held views on market breadth, and to be fair, I feel it’s also my experience. But, rest assured, I'll do some further digging into whether these concepts are indeed valid for the local market — in the data. I’ll share my findings in a dedicated article soon! 🧐
Today's best blue chip gainers
Company | Last Price | Change $ | Change % | 1mo % | 1yr % |
|---|---|---|---|---|---|
Telix Pharmaceuticals (TLX) | $10.20 | +$1. | +10.9% | -12.4% | -67.1% |
Ramsay Health Care (RHC) | $42.12 | +$3.95 | +10.3% | +16.9% | +24.4% |
Pro Medicus (PME) | $127.60 | +$11.37 | +9.8% | -31.5% | -53.3% |
Xero (XRO) | $82.30 | +$6.54 | +8.6% | -15.9% | -53.9% |
PLS Group (PLS) | $5.25 | +$0.4 | +8.2% | +9.1% | +161.2% |
Cleanaway Waste Management (CWY) | $2.58 | +$0.18 | +7.5% | +2.8% | +0.4% |
Technology One (TNE) | $24.93 | +$1.5 | +6.4% | -5.8% | -19.4% |
Steadfast Group (SDF) | $4.47 | +$0.18 | +4.2% | -14.7% | -21.6% |
Life360 (360) | $24.01 | +$0.95 | +4.1% | -15.8% | +7.6% |
Mineral Resources (MIN) | $60.46 | +$2.33 | +4.0% | -4.7% | +144.5% |
AMP (AMP) | $1.320 | +$0.05 | +3.9% | -23.5% | -3.7% |
Rio Tinto (RIO) | $168.63 | +$5.96 | +3.7% | +8.9% | +46.6% |
Seek (SEK) | $16.64 | +$0.57 | +3.5% | -25.1% | -30.2% |
REA Group (REA) | $160.56 | +$4.88 | +3.1% | -15.8% | -31.5% |
Car Group (CAR) | $25.32 | +$0.73 | +3.0% | -13.4% | -31.6% |
Pinnacle Investment (PNI) | $15.92 | +$0.44 | +2.8% | -8.1% | -31.9% |
Wisetech Global (WTC) | $49.00 | +$1.26 | +2.6% | -19.3% | -49.2% |
Sonic Healthcare (SHL) | $23.75 | +$0.61 | +2.6% | +4.2% | -15.6% |
Nextdc (NXT) | $14.34 | +$0.34 | +2.4% | +7.5% | +4.7% |
IGO (IGO) | $8.93 | +$0.21 | +2.4% | -1.9% | +117.3% |
Today's worst blue chip losers
Company | Last Price | Change $ | Change % | 1mo % | 1yr % |
|---|---|---|---|---|---|
Worley (WOR) | $11.71 | -$1.33 | -10.2% | -11.2% | -24.3% |
Qantas Airways (QAN) | $9.67 | -$0.98 | -9.2% | -6.8% | +10.9% |
Perseus Mining (PRU) | $5.81 | -$0.24 | -4.0% | -9.6% | +95.0% |
Ramelius Resources (RMS) | $4.60 | -$0.16 | -3.4% | -7.4% | +70.4% |
James Hardie Industries (JHX) | $34.51 | -$1.19 | -3.3% | +1.8% | -33.0% |
SGH (SGH) | $46.48 | -$1.31 | -2.7% | -1.1% | -11.2% |
Northern Star Resources (NST) | $29.62 | -$0.77 | -2.5% | +3.6% | +70.9% |
JB HI-FI (JBH) | $81.94 | -$2.12 | -2.5% | -1.3% | -10.3% |
Amcor PLC (AMC) | $68.26 | -$1.63 | -2.3% | +6.9% | -15.6% |
Bluescope Steel (BSL) | $27.71 | -$0.66 | -2.3% | -10.6% | +17.5% |
AGL Energy (AGL) | $9.81 | -$0.17 | -1.7% | +9.4% | -6.9% |
Sigma Healthcare (SIG) | $2.94 | -$0.05 | -1.7% | -4.9% | -1.3% |
Whitehaven Coal (WHC) | $7.75 | -$0.13 | -1.7% | -15.7% | +35.0% |
Fortescue (FMG) | $20.85 | -$0.29 | -1.4% | -3.6% | +23.7% |
Medibank Private (MPL) | $4.38 | -$0.05 | -1.1% | -5.4% | +9.0% |
Genesis Minerals (GMD) | $7.21 | -$0.08 | -1.1% | -11.3% | +126.7% |
Woodside Energy Group (WDS) | $27.94 | -$0.3 | -1.1% | +11.8% | +12.4% |
QBE Insurance Group (QBE) | $21.67 | -$0.22 | -1.0% | +10.3% | +0.5% |
Lendlease Group (LLC) | $4.12 | -$0.04 | -1.0% | -17.1% | -33.2% |
Origin Energy (ORG) | $11.97 | -$0.11 | -0.9% | +1.3% | +9.3% |
ChartWatch
Nasdaq Composite Index
Analysis
Remember that quote I shared a while back about TV chef Rick Stein?
For those who didn’t catch it, Stein once recalled a lawsuit against one of his restaurants after a diner chipped a tooth on an olive pit. The customer claimed negligence, arguing the pit should have been removed. The judge dismissed the case with a simple line: “It is in the nature of olives to have pits”. 🫒
That line has always stuck with me through my trading career!
The ruling captured a common-sense truth: some risks are inherent — some simply occur because they’re in the nature of the beast!
It’s a useful reminder for markets, too. The Comp rally overnight should not surprise any trend following technical analyst. Yes, uncertainty remains — and we’ve seen a meaningful unravelling across parts of the tech complex, reminiscent at times of the Dot-com crash: but the long-term trend in the Comp is still up.
It’s a bull market, silly! And, just like olives have pits, “It is in the nature of bull markets to rise”. 😉
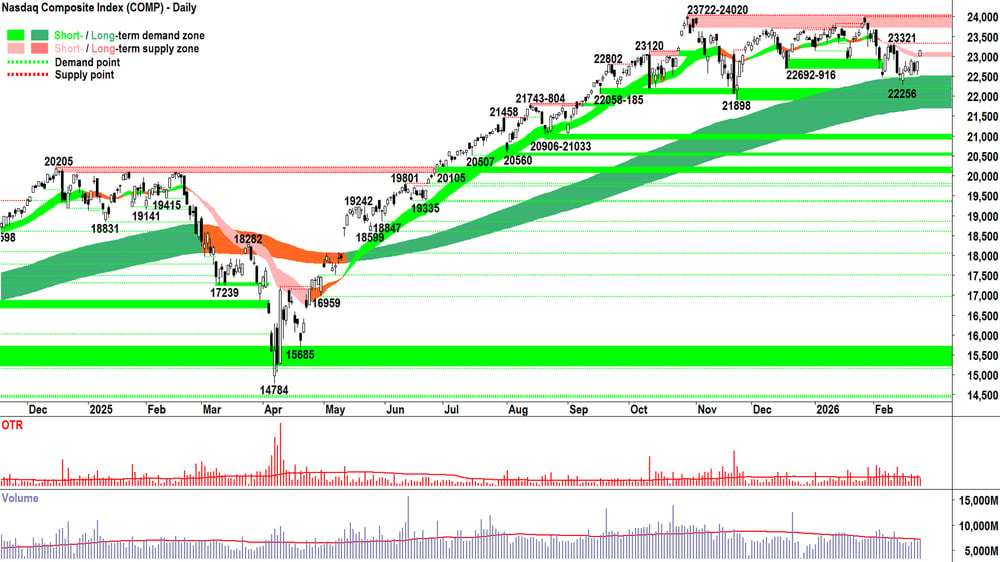
Wednesday’s rise appears to have knocked out the latent supply at the short term trend ribbon. The gap and run white-bodied candle — closing smack-bang at the high of the session — speaks of a modest but positive step-change in investor thinking (D > S) plus unquenched excess demand into the close.
And so, it appears that the long term uptrend has shielded the Comp from another supply-side raid… All hail the long term uptrend ribbon! 🙌
Volume was average… no major indications there… decent demand-side interaction meeting decent supply-side opposition. Clearly though, from the price action, the demand-side was far more motivated.
The supply that’s been removed is important — for is now, by definition, latent demand!
23321 is the next obvious point of supply to watch for. A close above there, and this fledgling rebound from the long term uptrend ribbon has legs.
22256 is the critical point of demand. A convincing long, full-black-bodied candle that closes below there = end of the Comp bull market. I put to you it’s that simple now.
In the meantime, we’re now 6 of the last 7 candles = white-bodied = this recovery should be little surprise to anyone who regularly reads ChartWatch! After all, it’s in the nature of bull markets to stop looking shaky, and very quickly, to start looking strong again…
View
1/2RP still feels right with respect to my US portfolio risk limit (RP = Risk Position — it reflects my personal allowable capital allocation limit for my investments in US stocks. So 1/2RP is 50%, 2/3RP is 67% and FRP is 100% 🪣).
I would however, as a result of yesterday's positive development, happily run at the max limit here, and I suggest that an emphatic close above 23321 would facilitate the careful and measured addition of further RP!
Key levels
22256 is the critical point of demand — a close below 22256 implies the supply-side is in control of the Comp's short term price, and that the long term uptrend is likely under significant pressure = ⚠️. 23321 is the nearest critical static point supply, and 23722-24020 is not far beyond that.
S&P/ASX 200 (XJO)
%20chart_26%20Feb.png)
Analysis
Welcome to the "other side".
This is what it looks like ex-post 9110-9116 — a barrier that impeded the GLC for 4 months. 🧱
Technical analysis theory goes like this:
Old zones of excess supply, once consumed, tend to act as future zones of excess demand.
Here’s my take on why this happens:
9110–9116 was an area where many — in this case, many, many — investors believed the GLC was great value to sell. They didn’t think it could go higher given the prevailing fundamentals.
For those participants, 9110–9116 marks their approximate exit price — where a substantial amount of stock changed hands and a substantial amount of cash was raised.
That same zone represents zero opportunity cost. Every point the GLC rises above it doesn’t hurt in outright dollar terms — but it does increase the cost of being out.
And for many, if they had the chance… they’d love to buy back at their exit price — eliminating that opportunity cost entirely.
That’s the key.
This latent desire to buy — from a large cohort of investors, holding significant cash from prior sales — creates a deep pool of demand at the old supply zone.
For us, it means that MOTN (More Often Than Not), the old supply zone acts as a future demand zone.
Whether it does or not… you know the drill… can’t tell the future + prediction is futile! 🔮
What we can / will do, is watch the price action around 9110-9116 closely. If we see a build up of demand-side candles here (i.e., white-bodied and or downward pointing shadows) — it is latent demand manifesting itself in the price action = 👍.
If we don’t, i.e., we see the supply-side alternatives of black-bodied candles and or those with upward pointing shadows — then something is very wrong with this break to new highs = 👎.
For now, today’s candle fits the “yep, so far so good” narrative. The rally is credible, all the boxes (i.e., trends, price action, and candles) are checked. ✅
All that’s left to do, is to set risk levels accordingly. In all the excitement yesterday, I complete forgot to do this most important bit! 🤦
FRP. If you can find the risk, that is. My scans are showing an improving number of +R opportunities (see ChartWatch ASX Scans), but they remain from a very narrow range of sectors.
One could easily argue that perhaps the XEW is the better benchmark for our portfolio risk model… 🤔
What do you think? 👇
View
I am FRP 🪣 (i.e., my personal allowable capital allocation limit for my investments in Australian stocks is 100%).
Key levels
9110-9116 is the closest zone of demand, but far more important, is the dynamic demand we'd typically associate with the short term trend ribbon (presently 8927-8982). A close below 8987 would neutralise the present short term uptrend.
***NEW VIDEO DROPPED — LITHIUM + URANIUM REVIEWS! 📺***
ChartWatch *LIVE* Webinar
ChartWatch *LIVE* Webinars – WEEKLY Wednesday's @ 12pm AEDT
Learn more about technical analysis and trend following through real case studies on ASX stocks. Australia's premier technical analyst, Carl Capolingua, shares his unique insights on stocks as requested by viewers. Ask about a company in your portfolio or anything related to trading and investing and get Carl's expert opinion.
Places are limited so >REGISTER NOW!<
Economy
Today
11:30 AUS Private Capital Expenditure
Result: +0.4% q/q actual vs -0.1% q/q forecast vs +6.4% q/q in November
Later this week
Friday
11:30 AUS January Private Sector Credit (+0.7% m/m forecast vs +0.8% m/m previous)
Saturday
12:30 USA January Core Producer Price Index (PPI) (+0.3% m/m forecast vs +0.7% m/m previous)
Latest News
Interesting Movers
Trading higher
+17.1% Accent Group (AX1) – Continued positive response to 25-Feb FY26 Half Year Results Investor Presentation.
+12.6% Megaport (MP1) – No news, general strength across the broader Information Technology sector today.
+11.5% Nuix (NXL) – No news, general strength across the broader Information Technology sector today.
+10.9% Telix Pharmaceuticals (TLX) – No news, general strength across the broader HealthCare sector today.
+10.5% Elsight (ELS) – Continued positive response to 25-Feb Appendix 4E and Annual Report, general strength across the broader Defence sector today, rise is consistent with prevailing short and long term uptrends 🔎📈
+10.3% Ramsay Health Care (RHC) – 2026 Half Year Results Presentation, general strength across the broader HealthCare sector today, rise is consistent with prevailing short term uptrend and long term trend is transitioning from down to up, a recent regular in ChartWatch ASX Scans Uptrends list 🔎📈
+10.1% Generation Development Group (GDG) – No news since 25-Feb HY26 Results pack, bounced in the wake of the recent sharp selloff.
+9.9% Amplitude Energy (AEL) – Continued positive response to 25-Feb 1H FY26 Results Presentation.
+9.8% Pro Medicus (PME) – Change of Director's Interest Notice - Anthony Hall and Change of Director's Interest Notice - Anthony Hall, general strength across the broader Information Technology sector today, (A Hall, approx. $2 million purchased on market).
+9.3% Maas Group Holdings (MGH) – Becoming a substantial holder from PPT.
+8.9% Droneshield (DRO) – $21.7m Western Military Contracts, general strength across the broader Defence sector today.
+8.6% Xero (XRO) – No news, general strength across the broader Information Technology sector today.
+8.4% Super Retail Group (SUL) – Half Year Results Presentation.
+8.3% Perpetual (PPT) – Operating and Financial Review.
+8.2% PLS Group (PLS) – No news, general strength across the broader Lithium sector today.
+8.2% Core Lithium (CXO) – Sale of Spodumene Concentrate Stockpile, general strength across the broader Lithium sector today.
+8.1% Domino's Pizza Enterprises (DMP) – Change in substantial holding (Ausbil Investment 9.1% from 7.5%).
Trading lower
-10.2% (WOR) – ASX presentation - Half year results 2026.
-9.2% Qantas Airways (QAN) – Qantas Group HY26 Results Investor Presentations.
-8.6% Liontown (LTR) – Ceasing to be a substantial holder (LG Energy Solution — previous update 6-Feb showed +7.5%).
-8.4% Yancoal Australia (YAL) – FY 2025 Financial Results Presentation and Coal Resources and Coal Reserves Statement, general weakness across the broader Coal sector today.
-6.9% Stanmore Resources (SMR) – No news, general weakness across the broader Coal sector today.
-5.1% Silex Systems (SLX) – No news, general weakness across the broader Uranium sector today.
-4.3% Deep Yellow (DYL) – Ceasing to be a substantial holder from SOL and Change in substantial holding (Paradice Investment Management 8.5% from 11.8%), general weakness across the broader Uranium sector today.
-4.2% Paladin Energy (PDN) – No news, general weakness across the broader Uranium sector today.
Broker Moves
Alfabs Australia (AAL)
Downgraded to hold from buy at Bell Potter; Price Target: $0.36 from $0.55
Adore Beauty Group (ABY)
Retained at buy at Bell Potter; Price Target: $1.00 from $1.25
Acrow (ACF)
Retained at buy at Morgans; Price Target: $1.28 from $1.29
Retained at buy at Ord Minnett; Price Target: $1.25
Retained at buy at Shaw and Partners; Price Target: $1.25
Adairs (ADH)
Retained at hold at Ord Minnett; Price Target: $2.30 from $2.60
Amplitude Energy (AEL)
Retained at buy at Bell Potter; Price Target: $3.40
Retained at outperform at Macquarie; Price Target: $3.50
Retained at buy at Morgans; Price Target: $3.50 from $3.60
Aeris Resources (AIS)
Retained at buy at Bell Potter; Price Target: $0.90
Retained at speculative buy at Ord Minnett; Price Target: $0.85
Atlas Arteria (ALX)
Retained at neutral at Citi; Price Target: $4.80
Ama Group (AMA)
Upgraded to buy from accumulate at Morgans; Price Target: $0.99 from $0.91
AUB Group (AUB)
Retained at buy at Ord Minnett; Price Target: $33.25
Accent Group (AX1)
Upgraded to outperform from hold at CLSA; Price Target: $1.05
Retained at buy at Goldman Sachs; Price Target: $1.30 from $1.20
Retained at overweight at Jarden; Price Target: $1.20
Retained at underweight at Morgan Stanley; Price Target: $0.95
Upgraded to buy from hold at Morgans; Price Target: $1.30 from $1.10
Retained at sector perform at RBC Capital Markets; Price Target: $1.30 from $1.20
Bapcor (BAP)
Retained at neutral at Citi; Price Target: $2.28
Boab Metals (BML)
Retained at buy at Shaw and Partners; Price Target: $1.70
Big River Industries (BRI)
Retained at buy at Ord Minnett; Price Target: $1.70 from $1.65
Centuria Capital Group (CNI)
Retained at hold at Bell Potter; Price Target: $2.15 from $2.25
Downgraded to hold from outperform at CLSA; Price Target: $1.96 from $2.39
Retained at neutral at Macquarie; Price Target: $2.02 from $2.10
COSOL (COS)
Retained at buy at Ord Minnett; Price Target: $0.32 from $0.80
Domino's Pizza Enterprises (DMP)
Retained at neutral at JPMorgan; Price Target: $22.00 from $24.00
Upgraded to neutral from underperform at Macquarie; Price Target: $20.40 from $19.40
Retained at underweight at Morgan Stanley; Price Target: $15.20
Retained at buy at Morgans; Price Target: $25.00
Upgraded to sector perform from underperform at RBC Capital Markets; Price Target: $19.00 from $20.00
Retained at buy at UBS; Price Target: $24.00 from $25.50
Duratec (DUR)
Downgraded to accumulate from buy at Ord Minnett; Price Target: $2.15 from $1.95
EBOS Group (EBO)
Upgraded to buy from neutral at Citi; Price Target: $26.00
Retained at buy at Morgans; Price Target: $28.07 from $34.82
Upgraded to buy from accumulate at Ord Minnett; Price Target: $30.00 from $33.00
Eureka Group Holdings (EGH)
Upgraded to outperform from hold at CLSA; Price Target: $0.57 from $0.54
Elevra Lithium (ELV)
Retained at outperform at Macquarie; Price Target: $9.20 from $9.00
Energy One (EOL)
Retained at buy at Canaccord Genuity; Price Target: $20.79 from $21.32
Retained at buy at Jefferies; Price Target: $18.00 from $20.00
Retained at buy at Ord Minnett; Price Target: $21.58 from $24.47
Retained at buy at Unified Capital Partners; Price Target: $21.65 from $21.01
Experience Co (EXP)
Retained at buy at Ord Minnett; Price Target: $0.16 from $0.25
FINEOS Corporation Holdings PLC (FCL)
Retained at buy at Citi; Price Target: $3.25
Fenix Resources (FEX)
Retained at buy at Bell Potter; Price Target: $0.67 from $0.70
Flight Centre Travel Group (FLT)
Retained at outperform at CLSA; Price Target: $18.10 from $18.00
Retained at buy at Jarden; Price Target: $18.00 from $18.50
Retained at outperform at Macquarie; Price Target: $17.95 from $17.85
Retained at overweight at Morgan Stanley; Price Target: $16.50
Retained at buy at Morgans; Price Target: $18.05 from $18.38
Retained at buy at Ord Minnett; Price Target: $16.64 from $16.86
Retained at buy at UBS; Price Target: $16.95 from $16.45
Fortescue (FMG)
Upgraded to hold from trim at Morgans; Price Target: $20.60
Retained at accumulate at Ord Minnett; Price Target: $22.50
Generation Development Group (GDG)
Retained at buy at Bell Potter; Price Target: $7.40 from $7.90
Retained at buy at Citi; Price Target: $6.80 from $7.50
Retained at outperform at Macquarie; Price Target: $6.50 from $6.75
Retained at overweight at Morgan Stanley; Price Target: $7.50
Gemlife Communities Group (GLF)
Upgraded to buy from neutral at Citi; Price Target: $6.10 from $5.60
Retained at overweight at Morgan Stanley; Price Target: $5.95 from $5.40
Growthpoint Properties Australia (GOZ)
Retained at buy at Citi; Price Target: $2.60
Retained at outperform at Macquarie; Price Target: $2.58 from $2.53
Gentrack Group (GTK)
Retained at buy at Shaw and Partners; Price Target: $11.30
Helia Group (HLI)
Retained at underperform at Macquarie; Price Target: $3.70 from $3.95
Helloworld Travel (HLO)
Retained at hold at Ord Minnett; Price Target: $1.63 from $1.90
Retained at buy at Shaw and Partners; Price Target: $2.80 from $2.75
Hazer Group (HZR)
Retained at buy at Shaw and Partners; Price Target: $0.70
Integral Diagnostics (IDX)
Retained at buy at Bell Potter; Price Target: $3.80 from $4.00
IVE Group (IGL)
Retained at buy at Bell Potter; Price Target: $3.25
Imricor Medical Systems Inc (IMR)
Retained at speculative buy at Morgans; Price Target: $2.71
Ingenia Communities Group (INA)
Upgraded to hold from sell at Moelis Australia; Price Target: $4.64 from $4.49
IRESS (IRE)
Upgraded to buy from hold at Jefferies; Price Target: $9.00 from $8.95
Upgraded to buy from accumulate at Morgans; Price Target: $10.95 from $10.50
Jumbo Interactive (JIN)
Retained at overweight at Jarden; Price Target: $12.70 from $12.50
Retained at outperform at Macquarie; Price Target: $14.10 from $14.60
Retained at overweight at Morgan Stanley; Price Target: $14.50 from $15.60
Retained at buy at Morgans; Price Target: $14.90
Kingsgate Consolidated (KCN)
Retained at buy at Canaccord Genuity; Price Target: $9.30
L1 Group (L1G)
Retained at neutral at UBS; Price Target: $1.28 from $1.12
Light & Wonder Inc. (LNW)
Retained at buy at UBS; Price Target: $215.00 from $210.00
Mader Group (MAD)
Retained at hold at Moelis Australia; Price Target: $9.08 from $8.29
Retained at buy at Unified Capital Partners; Price Target: $9.28 from $8.90
Mirvac Group (MGR)
Upgraded to buy from underperform at Bank of America; Price Target: $2.35 from $2.15
Midas Minerals (MM1)
Retained at speculative buy at Canaccord Genuity; Price Target: $1.35
McMillan Shakespeare (MMS)
Retained at overweight at Morgan Stanley; Price Target: $19.00 from $21.50
Monadelphous Group (MND)
Upgraded to neutral from underperform at Bank of America; Price Target: $33.00 from $24.00
Nine Entertainment Co. Holdings (NEC)
Retained at overweight at Morgan Stanley; Price Target: $1.40 from $1.90
Nexted Group (NXD)
Retained at speculative buy at Ord Minnett; Price Target: $0.36 from $0.40
Paragon Care (PGC)
Retained at buy at Bell Potter; Price Target: $0.29 from $0.49
Retained at buy at Ord Minnett; Price Target: $0.35 from $0.50
Perpetual (PPT)
Retained at neutral at Citi; Price Target: $19.70
Qantas Airways (QAN)
Retained at buy at Citi; Price Target: $12.45
Rio Tinto (RIO)
Retained at neutral at Citi; Price Target: $140.00
Resimac Group (RMC)
Downgraded to sell from neutral at Citi; Price Target: $0.98 from $1.00
Retained at neutral at Macquarie; Price Target: $1.05
Regal Partners (RPL)
Retained at buy at Morgans; Price Target: $5.00 from $4.25
Steadfast Group (SDF)
Retained at outperform at CLSA; Price Target: $6.20 from $5.70
Retained at overweight at Jarden; Price Target: $5.75 from $6.30
Upgraded to outperform from neutral at Macquarie; Price Target: $4.80 from $5.50
Retained at overweight at Morgan Stanley; Price Target: $5.59 from $6.74
SiteMinder (SDR)
Upgraded to buy from hold at Canaccord Genuity; Price Target: $4.96 from $7.67
Retained at overweight at Morgan Stanley; Price Target: $7.70
Upgraded to buy from accumulate at Morgans; Price Target: $7.00 from $8.10
Retained at buy at Ord Minnett; Price Target: $6.27 from $7.97
Retained at buy at UBS; Price Target: $7.95 from $8.30
Sea Forest (SEA)
Retained at buy at Ord Minnett; Price Target: $3.15
Sheffield Resources (SFX)
Retained at hold at Ord Minnett; Price Target: $0.07 from $0.06
Sigma Healthcare (SIG)
Retained at neutral at Citi; Price Target: $3.20
Superloop (SLC)
Retained at hold at Morgans; Price Target: $3.00
Silex Systems (SLX)
Retained at buy at Shaw and Partners; Price Target: $12.80
Service Stream (SSM)
Retained at buy at Canaccord Genuity; Price Target: $2.60
Retained at buy at Ord Minnett; Price Target: $2.50 from $2.57
Retained at outperform at RBC Capital Markets; Price Target: $2.20 from $2.50
Retained at buy at UBS; Price Target: $2.85 from $2.80
Super Retail Group (SUL)
Retained at buy at Citi; Price Target: $18.70
Tabcorp Holdings (TAH)
Retained at neutral at JPMorgan; Price Target: $0.90
Retained at neutral at Macquarie; Price Target: $1.10 from $0.95
Retained at underweight at Morgan Stanley; Price Target: $0.93
Retained at accumulate at Morgans; Price Target: $1.20 from $1.07
Downgraded to accumulate from buy at Ord Minnett; Price Target: $1.17 from $1.02
Retained at buy at UBS; Price Target: $1.20 from $1.11
Wagners Holding Company (WGN)
Upgraded to buy from accumulate at Morgans; Price Target: $5.00 from $3.75
Woolworths Group (WOW)
Retained at buy at Bell Potter; Price Target: $38.25 from $30.70
Retained at neutral at Citi; Price Target: $35.00 from $31.00
Downgraded to hold from outperform at CLSA; Price Target: $34.20 from $34.60
Retained at overweight at Jarden; Price Target: $35.30 from $31.00
Downgraded to neutral from overweight at JPMorgan; Price Target: $36.30 from $32.70
Retained at neutral at Macquarie; Price Target: $34.50 from $28.50
Retained at equal-weight at Morgan Stanley; Price Target: $34.40 from $31.30
Retained at hold at Morgans; Price Target: $37.30 from $28.25
Downgraded to accumulate from buy at Ord Minnett; Price Target: $39.00
Retained at sector perform at RBC Capital Markets; Price Target: $34.80 from $29.00
Retained at neutral at UBS; Price Target: $35.35 from $30.75
Wisetech Global (WTC)
Retained at outperform at CLSA; Price Target: $122.00 from $136.00
Downgraded to neutral from positive at E&P; Price Target: $65.00 from $94.00
Upgraded to buy from overweight at Jarden; Price Target: $63.00 from $74.00
Retained at outperform at Macquarie; Price Target: $97.70 from $94.00
Retained at buy at UBS; Price Target: $89.00 from $115.00
Wisr (WZR)
Retained at buy at Shaw and Partners; Price Target: $0.07 from $0.07
Scans
Top Gainers
Code | Company | Last | % Chg |
|---|---|---|---|
| HT8 | Harris Technology Group Ltd | $0.017 | +70.00% |
| KLV | Klevo Rewards Ltd | $0.025 | +38.89% |
| RMY | Rma Global Ltd | $0.06 | +33.33% |
| AON | Apollo Minerals Ltd | $0.067 | +31.37% |
| COS | Cosol Ltd | $0.30 | +25.00% |
Top Fallers
Code | Company | Last | % Chg |
|---|---|---|---|
| AIM | Ai-Media Technologies Ltd | $0.345 | -38.39% |
| RPM | RPM Automotive Group Ltd | $0.037 | -32.73% |
| ANG | Austin Engineering Ltd | $0.185 | -30.19% |
| RDY | Readytech Holdings Ltd | $1.215 | -29.77% |
| AMO | Ambertech Ltd | $0.11 | -26.67% |
52 Week Highs
Code | Company | Last | % Chg |
|---|---|---|---|
| HT8 | Harris Technology Group Ltd | $0.017 | +70.00% |
| RMY | Rma Global Ltd | $0.06 | +33.33% |
| AON | Apollo Minerals Ltd | $0.067 | +31.37% |
| SHO | Sportshero Ltd | $0.13 | +23.81% |
| C1X | Cosmos Exploration Ltd | $0.265 | +20.46% |
52 Week Lows
Code | Company | Last | % Chg |
|---|---|---|---|
| AIM | Ai-Media Technologies Ltd | $0.345 | -38.39% |
| RPM | RPM Automotive Group Ltd | $0.037 | -32.73% |
| ANG | Austin Engineering Ltd | $0.185 | -30.19% |
| RDY | Readytech Holdings Ltd | $1.215 | -29.77% |
| AMO | Ambertech Ltd | $0.11 | -26.67% |
Near Highs
Code | Company | Last | % Chg |
|---|---|---|---|
| DYM | Dynamic Metals Ltd | $0.65 | -2.99% |
| GLPR | iShares Ftse GBL Property Ex Aus (Aud Hedged) ETF | $28.85 | +0.21% |
| RHC | Ramsay Health Care Ltd | $42.12 | +10.35% |
| WVOL | iShares MSCI World Ex Aust Minimum Volatility ETF | $45.16 | -0.31% |
| AII | Almonty Industries Inc | $23.10 | +0.09% |
Relative Strength Index (RSI) Oversold
Code | Company | Last | % Chg |
|---|---|---|---|
| ING | Inghams Group Ltd | $2.07 | -0.48% |
| CSL | CSL Ltd | $146.02 | +0.63% |
| WOR | Worley Ltd | $11.71 | -10.20% |
| AMA | AMA Group Ltd | $0.675 | -4.26% |
| CMA | Carma Ltd | $1.00 | -19.36% |
