News | Market Wraps
Evening Wrap: ASX 200 dumps 252 points as oil shock, yield spike reignite inflation fears — BHP tumbles 5%
The S&P/ASX 200 closed 252 points lower, down 2.85%.

Mentioned
The S&P/ASX 200 closed 252 points lower, down 2.85%.
The ASX 200 slumped to 8,559 points as the Middle East conflict and a surge in crude oil to above US$100/barrel stoked inflation fears and triggered a broad de-risking.
Be sure to click/scroll through for the usual reporting of the major sector and stock-specific moves, the broker responses to them, as well as all the key economic data in tonight's Evening Wrap.
Also, I have detailed technical analysis on the Nasdaq Composite and the S&P/ASX 200 in today's ChartWatch.
Let's dive in!
Today in Review
Mon 09 Mar 26, 4:58pm (AEST)
Name | Value | % Chg |
|---|---|---|
Major Indices | ||
| ASX 200 | 8,599.0 | -2.85% |
| All Ords | 8,823.6 | -2.88% |
| Small Ords | 3,463.2 | -3.66% |
| All Tech | 2,790.5 | -3.74% |
| Emerging Companies | 3,068.5 | -4.47% |
Currency | ||
| AUD/USD | 0.7011 | -0.27% |
US Futures | ||
| S&P 500 | 6,636.0 | -1.60% |
| Dow Jones | 46,699.0 | -1.72% |
| Nasdaq | 24,199.75 | -1.91% |
Name | Value | % Chg |
|---|---|---|
Sector | ||
| Energy | 10,474.2 | +1.65% |
| Utilities | 9,882.7 | -1.19% |
| Communication Services | 1,699.1 | -1.89% |
| Financials | 9,433.8 | -2.06% |
| Consumer Discretionary | 3,461.3 | -2.18% |
| Consumer Staples | 12,303.6 | -2.21% |
| Real Estate | 3,440.0 | -2.39% |
| Health Care | 28,580.7 | -3.24% |
| Industrials | 8,052.8 | -3.65% |
| Information Technology | 1,752.9 | -4.77% |
| Materials | 22,064.3 | -4.83% |
Markets
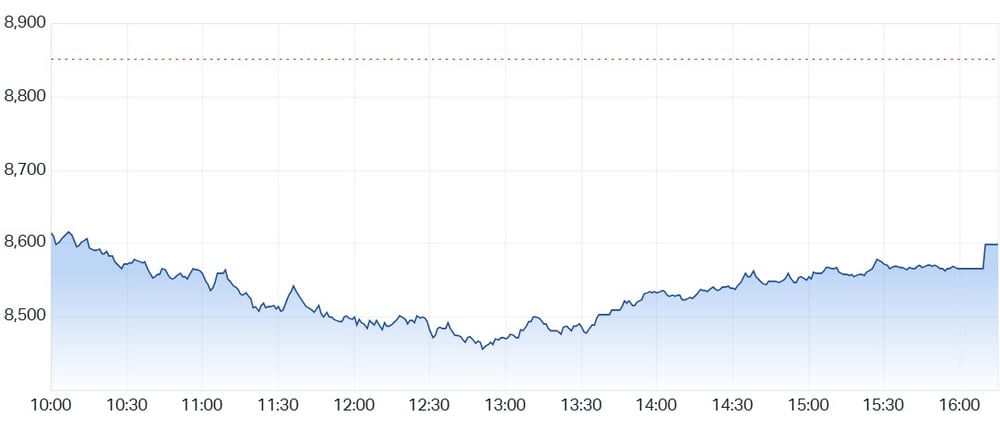
ASX 200 Session Chart
The S&P/ASX 200 (XJO) finished 252 points lower at 8,599, 1.68% from its session low and 2.93% from its session high. In the broader-based S&P/ASX 300 (XKO), decliners beat advancers by a robust 269 to 22.
The Middle East conflict and a surge in crude oil to above US$100/barrel stoked inflation fears and triggered a broad de-risking.
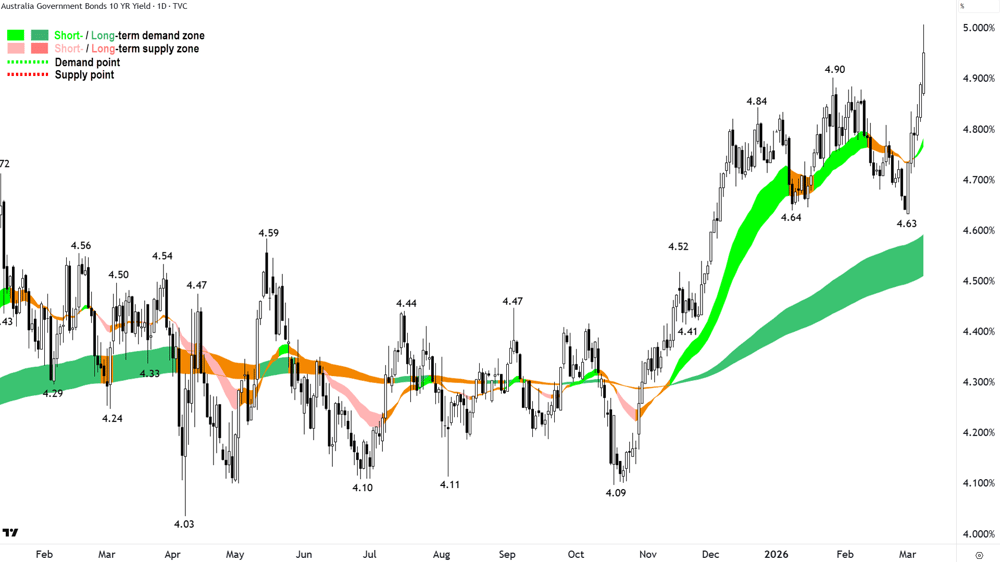
There were two parts to this de-risking. In one arena of risk, the bond market, the yield on the Australian 10-year government bond topped 5%, pushing up the “risk-free” interest rate that underpins everything from mortgage pricing to business borrowing costs.
Australian 10-year Government Bond yield chart
Cash coming out of bonds... 🚨
The other arena of risk that was hit hard today was the stock market. Information Technology (XIJ) (-4.8%) was the hardest of the major ASX sectors today, as Xero (XRO) (-4.8%) and Wisetech Global (WTC) (-3.9%) paced losses.
But the correction also struck the previous beneficiary of the XIJ's prolonged weakness, Resources (XJR) (-3.7%), which extended its pullback into a fifth-straight day. BHP Group (BHP) and South32 (S32) (-5.1%) each lost 5%.
Gold Sub-Index (XGD) (-5.2%) is another sector that had previously seemed invincible. The price of spot gold eased only about 0.8% to US$5,128/oz during Asian trade today, but this didn't prevent a much larger decline in the major gold stocks like Northern Star Resources (NST) (-6.1%) and Evolution Mining (EVN) (-5.8%).
Cash coming out of stocks... 🚨
In other commodity moves, well, "the" commodity move of the day — Brent crude rose as much as 17% to US$109/bbl this morning, sending the Energy (XEJ) (+1.6%) sector higher. It was a lone bright spot, with Woodside Energy (WDS) (+2.0%) and Yancoal (YAL) (+13.2%) among the standout gainers.
Q: If money is flowing out of bonds and stocks... then where is it going? And what does that mean about the big fund managers' appetite for risk!? 🤔
Fund flows: Democracy is the best system! ✊
I can’t recall the Golden Le Creuset reprising the moniker of Old Tin Pot so quickly. But, alas, we are definitely back to using the Old Tin Pot moniker! 🤦
Can we blame the OTP this time? We could argue the present plunge from that glorious fresh record high set just 5 trading sessions ago — Monday last week — was due to circumstances beyond its control.
Middle East conflict. Surging crude oil prices. Headlines spouting impending inflation, interest rates, and plain old a wall of bad stuff that's about to hit the local economy. 😱
It's a rapid turnaround, granted, and as is usually the case — a major top in the Australian share market has been triggered by an exogenous shock. This is the norm, not the exception.
But maybe, just maybe, the answer to our conundrum of correct portfolio risk allocation was floated here just a couple of weeks ago when I asked you what you thought was the better benchmark for our portfolio risk management model — the ASX 200 (XJO) or the ASX 200 Equal Weight (XEW)? 🤔
It was a clear 2:1 win for the XEW.
A big gold star for everyone who voted for the “democratic” benchmark of major Australian shares — as for those who may have forgotten, the XEW gives all 200 of its constituents equal billing. It basically tells us the average performance of the ASX 200’s companies, rather than letting the big four banks, BHP Group (BHP) (-5.1%) and Rio Tinto (RIO) (-3.8%) dominate the index.
Take a look at the chart below of the XEW. Consider that as disciples of the regular OTP, the throttle was firmly jammed at full speed ahead on Monday last week. Then consider what the XEW would have counselled:
%20chart_9%20Mar.png)
S&P-ASX 200 Equal Weight Index (XEW) chart
It's my experience that history conspires to undermine new highs made on narrow market breadth — somehow. Happens... every... bloody... time!
But if we were using the XEW instead of the XJO — we wouldn't have been fooled by the thin veneer of banks / BHP + RIO strength. I suggest we would have been at 1/2RP at best — in synch with the Nasdaq Composite! ⚖️
Max 50% invested. Min 50% cash. 🛡️
These are questions that I will investigate and answer soon, but as we'll see from the analysis in ChartWatch below, it wasn't a total disaster for the regular OTP's technicals today. There was some credible buy the dip action going on, but clearly from the sector performance table below — the usual big fund manager shenanigans of love this / hate that.
Full name | Last Price | 1-day Chg $ | 1-day Chg % | 1-month Chg % | 1-year Chg % |
|---|---|---|---|---|---|
Energy Sector Index | 10474.2 | 17040.04 | 1.7 | 15.104 | 35.301 |
Utilities Sector Index | 9882.7 | -11850 | -1.2 | 6.721 | 14.243 |
Communication Services Sector Index | 1699.1 | -3280.01 | -1.9 | 3.358 | 1.481 |
Financials Sector Index | 9433.8 | -19870 | -2.1 | 1.361 | 13.885 |
Consumer Discretionary Sector Index | 3461.3 | -7720 | -2.2 | -11.315 | -11.103 |
Consumer Staples Sector Index | 12303.6 | -27850 | -2.2 | 4.325 | 6.829 |
Real Estate Sector Index | 3440 | -8430.01 | -2.4 | -6.714 | -4.245 |
Golden Le Creuset (S&P/ASX 200) | 8599 | -25200 | -2.8 | -1.261 | 8.188 |
Health Care Sector Index | 28580.7 | -95630.1 | -3.2 | -15.035 | -32.61 |
Equal Weight Index | 2066 | -7200 | -3.4 | -2.827 | 8.372 |
Industrials Sector Index | 8052.8 | -30530 | -3.7 | -1.718 | 2.544 |
Resources Index | 7197.3 | -28060 | -3.8 | 1.864 | 41.415 |
Information Technology Sector Index (XIJ) | 1752.9 | -8770 | -4.8 | 1.511 | -28.616 |
Also flagged here recently, is the improving technicals of the Energy (XEJ) (+1.7%) sector.
If you managed to +R on some of the numerous recent appearances of BetaShares Crude Oil ETF (OOO) (+42.6%), Santos (STO) (+2.4%), and Woodside Energy Group (WDS) (+2.0%) in my ChartWatch ASX Scans uptrends lists, then today might have been a more bearable affair.
%20chart_9%20Mar.png)
S&P-ASX 200 Energy Sector Index (XEJ) chart
Today's best blue chip gainers
Company | Last Price | Change $ | Change % | 1mo % | 1yr % |
|---|---|---|---|---|---|
Whitehaven Coal (WHC) | $8.85 | +$0.37 | +4.4% | -0.2% | +55.3% |
Santos (STO) | $7.64 | +$0.18 | +2.4% | +10.9% | +26.9% |
Woodside Energy (WDS) | $31.36 | +$0.61 | +2.0% | +23.1% | +39.4% |
Ampol (ALD) | $31.35 | +$0.39 | +1.3% | +9.2% | +28.3% |
JB HI-FI (JBH) | $78.11 | +$0.07 | +0.1% | -3.1% | -13.1% |
Cochlear (COH) | $180.17 | +$0.11 | +0.1% | -28.0% | -32.2% |
Qube (QUB) | $4.95 | -$0.01 | -0.2% | +4.4% | +28.6% |
Coles Group (COL) | $21.09 | -$0.06 | -0.3% | -2.6% | +12.1% |
APA Group (APA) | $9.16 | -$0.07 | -0.8% | +4.9% | +24.8% |
Transurban Group (TCL) | $14.09 | -$0.11 | -0.8% | +3.3% | +8.8% |
Atlas Arteria (ALX) | $4.68 | -$0.04 | -0.8% | +2.2% | -5.6% |
Soul Pattinson (SOL) | $37.79 | -$0.33 | -0.9% | +2.1% | +12.6% |
Vicinity Centres (VCX) | $2.29 | -$0.02 | -0.9% | -8.8% | +7.0% |
Pro Medicus (PME) | $131.50 | -$1.2 | -0.9% | -16.6% | -48.2% |
AGL Energy (AGL) | $9.56 | -$0.09 | -0.9% | +6.8% | -5.1% |
Fortescue (FMG) | $19.05 | -$0.2 | -1.0% | -10.3% | +19.7% |
Stockland (SGP) | $4.74 | -$0.05 | -1.0% | -8.5% | -5.0% |
Telstra Group (TLS) | $5.17 | -$0.07 | -1.3% | +5.9% | +24.6% |
Origin Energy (ORG) | $11.76 | -$0.18 | -1.5% | +7.8% | +15.3% |
Insurance Australia (IAG) | $6.47 | -$0.1 | -1.5% | -16.3% | -15.5% |
Today's worst blue chip losers
Company | Last Price | Change $ | Change % | 1mo % | 1yr % |
|---|---|---|---|---|---|
Dyno Nobel (DNL) | $3.06 | -$0.33 | -9.7% | -4.1% | +12.9% |
Sandfire Resources (SFR) | $15.69 | -$1.4 | -8.2% | -15.4% | +43.2% |
PLS Group (PLS) | $4.44 | -$0.32 | -6.7% | +7.8% | +145.3% |
Life360 (360) | $20.40 | -$1.47 | -6.7% | -18.3% | -8.4% |
James Hardie (JHX) | $29.48 | -$2.12 | -6.7% | -9.2% | -41.9% |
SGH (SGH) | $41.58 | -$2.98 | -6.7% | -9.7% | -17.0% |
Nextdc (NXT) | $12.81 | -$0.88 | -6.4% | +0.8% | -3.8% |
Lynas Rare Earths (LYC) | $17.18 | -$1.15 | -6.3% | +20.4% | +139.6% |
Downer EDI (DOW) | $7.39 | -$0.49 | -6.2% | -2.1% | +37.4% |
Ramsay Health Care (RHC) | $41.76 | -$2.76 | -6.2% | +16.4% | +20.5% |
Orica (ORI) | $21.66 | -$1.43 | -6.2% | -13.9% | +27.2% |
Northern Star Resources (NST) | $25.31 | -$1.67 | -6.2% | -5.5% | +47.0% |
Evolution Mining (EVN) | $13.92 | -$0.87 | -5.9% | -2.9% | +122.0% |
ALS (ALQ) | $22.63 | -$1.37 | -5.7% | -1.4% | +42.7% |
Hub24 (HUB) | $88.47 | -$5.03 | -5.4% | +6.2% | +18.6% |
Fisher & Paykel Healthcare (FPH) | $31.78 | -$1.73 | -5.2% | -3.2% | +2.3% |
BHP Group (BHP) | $50.10 | -$2.71 | -5.1% | +2.7% | +28.5% |
Telix Pharmaceuticals (TLX) | $10.20 | -$0.55 | -5.1% | +3.6% | -63.1% |
South32 (S32) | $4.27 | -$0.23 | -5.1% | -3.2% | +18.9% |
ChartWatch
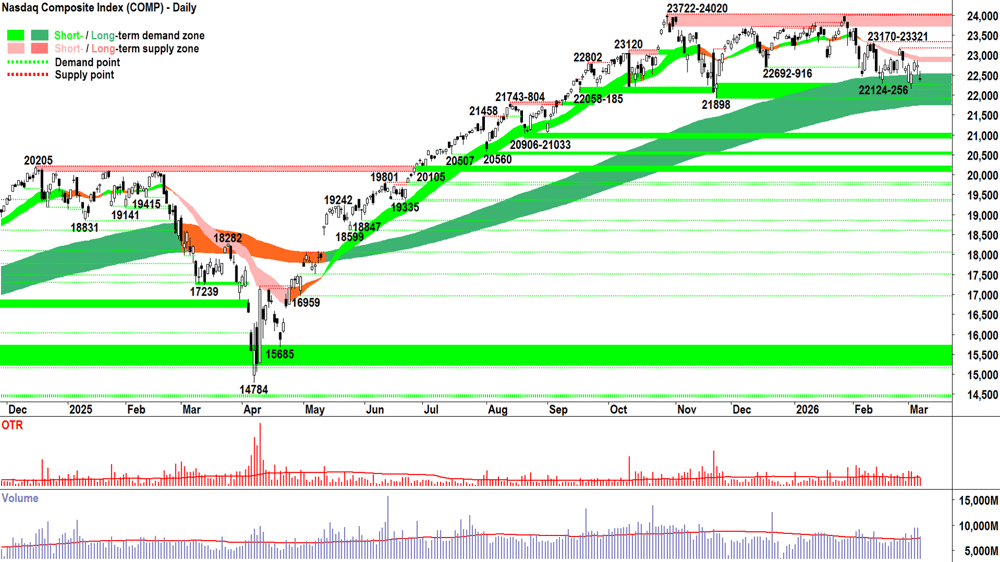
Nasdaq Composite Index
Analysis
At the time of writing, Comp futures are down 550 points / approx. 2.2%. If we were to see a 550 point lower open on the chart above, we’re talking roughly 21,850.
The bottom of the long term uptrend ribbon is 21746 — i.e., a whisker beyond that.
Friday’s candle was not a good one (if you’re cheering this thing up, that is!).
Unlike the 11 out of 13 candles before it that were white, this one is black — and it’s sporting a decent upward pointing shadow which we know all too well signals excess supply.
Friday also formed yet another lower peak — a peak that has solidified the short term downtrend ribbon's grip on the price action: falling peaks and falling troughs… and there’s only one way to get those = supply reinforcement and demand removal.
Sell the rallies hard, don’t buy the dips. ⚠️⚠️⚠️
Can the demand-side controlled pegs of 22124 and 21989 (static) and 21746 (dynamic) hold tonight? 🤔
Based on the technicals I can see, in my experience this would equate to a LOTN proposition! (Less Often Than Not!)
But, given I neutralised my portfolio risk here about a month ago… I’m not too fussed. It will be what it will be! 🧘
My job — as it always is once the Analysis and the Acceptance of the MOTN scenario is conducted — is simply to manage my risk accordingly. I.e., to Act.
I can’t change my portfolio risk limit based on a candle I haven’t seen yet. I’ll take a look tomorrow morning and make a call, but logically, a close below 21746 would send me to 1/3RP — my lowest possible risk allocation setting.
View
I have no choice but to stick with 1/2RP for my US portfolio risk limit today... but clearly, there hasn't been a great need to add any risk here for a while / happy to let existing RP roll off. (RP = Risk Position — it reflects my personal allowable capital allocation limit for my investments in US stocks. So 1/2RP is 50%, 2/3RP is 67% and FRP is 100% 🪣).
Key levels
22124-22256 is the critical zone of demand — a close below it implies the supply-side is in control of the Comp's short term price, and that the long term uptrend ribbon (presently 21746-22510) is likely under significant pressure = ⚠️. The short term downtrend ribbon (presently 22831-22945) is the nearest critical zone of point supply, and 23170-23321 is not far beyond that.
S&P/ASX 200 (XJO)
%20chart_9%20Mar.png)
Analysis
As eluded to above in the Markets section, it could have been far worse today.
Yes, there was plenty of carnage across the OTP, but that downward pointing shadow represents 142 points, or 1.7% of excess demand.
If it was a regular day that happened to start 12:51 pm — then we’d say it was a day where the OTP closed up 142 points = A pretty good day!
(Hey, note the time that miraculous rally started — the magic 1pm witching hour again! 🪄)
Don’t get me wrong, I haven’t forgotten about the 394 point plunge that preceded the 142 point rally, just that it could have been far worse today… 😉
Keeping with the “not good, but not quite terrible theme”, I note the long term uptrend ribbon is cracked — the first close beneath it since 18 November last year.
But! The 8547-8562 and arguably also the 8383 static demand zones held firm. That’s where the big fund managers stepped in en-masse to buy the dip last time — the same dip that eventually led to last week’s all-time high.
Possibly, just possibly, some of them did it again at today’s 12:51 pm low.
I’ll close by calling a spade a spade: plenty of damage has been done to the short and long term trends of the OTP. Damage that is very unlikely to be repaired in a rapid fashion.
More likely, it will take weeks at best to repair… rising troughs, a return to a predominance of demand-side candles, closes back above the trend ribbons, rising peaks…
Deep sigh... 😮💨
Yes… that sounds like a lot of work! Likely to be accompanied by a lot of headaches, and a lot of waiting…
But I wouldn’t complain about the nature of such a recovery — because a recovery would be a very fortunate outcome here! 🤞
Stuff got broken today.
Stuff might well get worse. A lot worse. ⚠️
Regardless of the outcome, our job is simply to manage risk accordingly.
For me, I look at the chart above, and I cannot in good conscience retain FRP. Now that you know my model, I suspect you reached that conclusion well before reading this sentence.
1/2RP for me now. Where it probably should have been with perfect 20-20 Harry Hindsight. 🤦
Balanced. Ready to take advantage of the next big trend — whichever way that might be! ⚖️
View
1/2RP 🪣 (i.e., my personal allowable capital allocation limit for my investments in Australian stocks is 50%) — but as I said on Wednesday last week: "I will stop adding new portfolio risk. I will let existing portfolio risk roll off
Key levels
8547-8562 is the closest zone of demand (static), and beyond this, is 8383. The ASX 200 must at least close back above the long term uptrend ribbon (presently 8674-8785) to reclaim an semblance of demand-side control.
ChartWatch *LIVE* Webinar
ChartWatch *LIVE* Webinars – WEEKLY Wednesday's @ 12pm AEDT
Learn more about technical analysis and trend following through real case studies on ASX stocks. Australia's premier technical analyst, Carl Capolingua, shares his unique insights on stocks as requested by viewers. Ask about a company in your portfolio or anything related to trading and investing and get Carl's expert opinion.
Places are limited so >REGISTER NOW!<
Economy
Today
12:30 CHN CPI y/y
Result: 1.3% y/y actual vs +0.9% y/y forecast vs 0.2% y/y in February
Later this week
Tuesday
10:30 AUS Westpac Consumer Sentiment (-2.6% m/m previous)
11:30 AUS NAB Business Confidence
Wednesday
23:30 USA Core CPI m/m (+0.2% m/m forecast vs +0.3% m/m previous)
Thursday
11:00 AUS MI Inflation Expectations (+5% m/m previous)
23:30 USA Unemployment Claims (+216k w/w forecast vs +213k w/w previous)
Friday
00:30 GB GDP m/m (+0.2% p.a. forecast vs +0.1% p.a. previous)
11:30 USA Core PCE Price Index m/m (+0.4% m/m forecast vs -0.1% m/m previous)
Saturday
01:00 USA JOLTS Job Openings (+6.84 million m/m forecast vs +6.54 million m/m previous)
Latest News
Interesting Movers
Trading higher
+13.3% Yancoal Australia (YAL) – No news, general strength across the broader Energy sector today, rise is consistent with prevailing short and long term uptrends, a regular in ChartWatch ASX Scans Uptrends list 🔎📈
+10.2% Karoon Energy (KAR) – No news, general strength across the broader Energy sector today.
+5.0% Adairs (ADH) – S&P DJI Announces March 2026 Quarterly Rebalance.
+4.6% Elsight (ELS) – Becoming a substantial holder (UBS 5%), rise is consistent with prevailing short and long term uptrends, a regular in ChartWatch ASX Scans Uptrends list 🔎📈
+4.4% Whitehaven Coal (WHC) – No news, general strength across the broader Energy sector today, rise is consistent with prevailing short and long term uptrends, a regular in ChartWatch ASX Scans Uptrends list 🔎📈
+3.8% Nanosonics (NAN) – Nanosonics' CORIS secures first 510k clearance.
+3.1% Amplitude Energy (AEL) – Flow testing to commence at Isabella prospect, general strength across the broader Energy sector today.
+2.8% New Hope Corp. (NHC) – No news, general strength across the broader Energy sector today, rise is consistent with prevailing short and long term uptrends, a regular in ChartWatch ASX Scans Uptrends list 🔎📈
+2.4% Santos (STO) – Santos takes FID on Moomba Central Optimisation project, general strength across the broader Energy sector today, rise is consistent with prevailing short and long term uptrends, a regular in ChartWatch ASX Scans Uptrends list 🔎📈
+2.0% Woodside Energy Group (WDS) – No news, general strength across the broader Energy sector today, rise is consistent with prevailing short and long term uptrends, a regular in ChartWatch ASX Scans Uptrends list 🔎📈
+1.3% Beach Energy (BPT) – FID taken on Moomba Central Optimisation, general strength across the broader Energy sector today.
+1.3% Ampol (ALD) – No news, general strength across the broader Energy sector today.
Trading lower
-15.2% Dateline Resources (DTR) – Half Year Accounts, general weakness across the broader Critical Minerals sector today.
-14.8% Bapcor (BAP) – Change in substantial holding, Change in substantial holding, and Change in substantial holding (all trying to buy the dip… but the dip keeps dipping! 🤦), fall is consistent with prevailing short and long term downtrends, a regular in ChartWatch ASX Scans Downtrends list 🔎📉
-14.7% Tivan (TVN) – Continued negative response to 06-Mar TVN and CLC agree landmark community development initiative, general weakness across the broader Materials sector today.
-13.7% Core Lithium (CXO) – No news, general weakness across the broader Critical Minerals sector today.
-12.7% Lotus Resources (LOT) – Results of Share Purchase Plan, general weakness across the broader Uranium sector today.
-10.1% Firefly Metals (FFM) – No news, general weakness across the broader Resources sector today.
-9.7% Dyno Nobel (DNL) – Fertiliser separation concludes & strong explosives momentum, general weakness across the broader Materials sector today.
-8.8% Droneshield (DRO) – No news, today's move is consistent with recent volatility.
-8.7% Predictive Discovery (PDI) – S&P DJI Announces March 2026 Quarterly Rebalance, general weakness across the broader Precious Metals sector today.
-8.4% Chalice Mining (CHN) – Ceasing to be a substantial holder, general weakness across the broader Critical Minerals sector today.
-8.3% Develop Global (DVP) – No news, general weakness across the broader Critical Minerals sector today.
-8.2% Black Cat Syndicate (BC8) – No news, general weakness across the broader Precious Metals sector today.
-8.2% G8 Education (GEM) – No news, fall is consistent with prevailing short and long term downtrends, a regular in ChartWatch ASX Scans Downtrends list 🔎📉
-8.2% Sandfire Resources (SFR) – No news, general weakness across the broader Resources sector today.
-8.1% Zip Co. (ZIP) – No news, fall is consistent with prevailing short and long term downtrends, a regular in ChartWatch ASX Scans Downtrends list 🔎📉
-8.1% Aeris Resources (AIS) – No news, general weakness across the broader Resources sector today.
-8.0% Silex Systems (SLX) – No news, general weakness across the broader Uranium sector today, fall is consistent with prevailing short term downtrend and long term trend is transitioning from up to down, a recent regular in ChartWatch ASX Scans Downtrends list 🔎📉
-8.0% Capstone Copper Corp. (CSC) – No news, general weakness across the broader Resources sector today.
-8.0% Ora Banda Mining (OBM) – No news, general weakness across the broader Precious Metals sector today.
-7.9% Paladin Energy (PDN) – No news, general weakness across the broader Uranium sector today.
Broker Moves
The a2 Milk Company (A2M)
Retained at buy at Citi; Price Target: $10.55
Audinate Group (AD8)
Retained at equal-weight at Morgan Stanley; Price Target: $3.00 from $5.00
Amplitude Energy (AEL)
Retained at hold at Ord Minnett; Price Target: $2.51
AGL Energy (AGL)
Retained at buy at Ord Minnett; Price Target: $13.25
Ampol (ALD)
Retained at buy at Ord Minnett; Price Target: $35.00
APA Group (APA)
Retained at hold at Ord Minnett; Price Target: $8.30
Anteris Technologies (AVR)
Retained at speculative buy at Bell Potter; Price Target: $13.00 from $10.00
Beach Energy (BPT)
Retained at underperform at Macquarie; Price Target: $0.70 from $0.65
Retained at underweight at Morgan Stanley; Price Target: $1.15 from $1.13
Retained at hold at Ord Minnett; Price Target: $1.16 from $1.18
Cochlear (COH)
Upgraded to buy from neutral at Bank of America; Price Target: $270.00
Coles Group (COL)
Retained at overweight at Morgan Stanley; Price Target: $24.00
Carnarvon Energy (CVN)
Retained at buy at Ord Minnett; Price Target: $0.14 from $0.15
Goodman Group (GMG)
Retained at outperform at Macquarie; Price Target: $32.20
Judo Capital Holdings (JDO)
Retained at buy at Citi; Price Target: $2.20
Karoon Energy (KAR)
Retained at underperform at Macquarie; Price Target: $1.60 from $1.50
Retained at equal-weight at Morgan Stanley; Price Target: $1.77 from $1.70
Retained at buy at Ord Minnett; Price Target: $2.30 from $2.20
Macquarie Group (MQG)
Retained at neutral at Citi; Price Target: $210.00
Metcash (MTS)
Retained at equal-weight at Morgan Stanley; Price Target: $3.30 from $3.50
NEXTDC (NXT)
Retained at buy at Citi; Price Target: $19.00
Origin Energy (ORG)
Retained at underweight at Morgan Stanley; Price Target: $11.01 from $10.88
Retained at hold at Ord Minnett; Price Target: $10.90
Pioneer Credit (PNC)
Retained at buy at Shaw and Partners; Price Target: $1.00
Ramsay Health Care (RHC)
Downgraded to lighten from hold at Ord Minnett; Price Target: $38.25
Rio Tinto (RIO)
Retained at equal-weight at Morgan Stanley; Price Target: $146.00
Rox Resources (RXL)
Retained at speculative buy at Canaccord Genuity; Price Target: $1.15
Service Stream (SSM)
Retained at buy at Citi; Price Target: $2.55 from $2.65
Santos (STO)
Retained at buy at Citi; Price Target: $8.00 from $7.00
Retained at outperform at Macquarie; Price Target: $8.10 from $7.55
Retained at equal-weight at Morgan Stanley; Price Target: $7.10 from $6.66
Retained at buy at Ord Minnett; Price Target: $7.40 from $7.30
Tuas (TUA)
Retained at buy at Citi; Price Target: $9.95
Viva Energy Group (VEA)
Retained at buy at Ord Minnett; Price Target: $2.50
Woodside Energy Group (WDS)
Retained at neutral at Citi; Price Target: $30.00 from $28.00
Retained at neutral at Macquarie; Price Target: $30.00 from $27.00
Retained at lighten at Ord Minnett; Price Target: $24.75 from $24.00
Woolworths Group (WOW)
Retained at equal-weight at Morgan Stanley; Price Target: $34.40
Scans
Top Gainers
Code | Company | Last | % Chg |
|---|---|---|---|
| 88E | 88 Energy Ltd | $0.041 | +86.36% |
| OOO | Betashares Crude Oil INDEX Currncy HDG Complex ETF | $10.17 | +42.64% |
| GAS | State GAS Ltd | $0.037 | +42.31% |
| ATS | Australis Oil & Gas Ltd | $0.029 | +26.09% |
| JNS | Janus Electric Holdings Ltd | $0.13 | +18.18% |
Top Fallers
Code | Company | Last | % Chg |
|---|---|---|---|
| MEL | Metgasco Ltd | $0.014 | -33.33% |
| BEZ | Besra Gold Inc | $0.115 | -23.33% |
| IOD | Iodm Ltd | $0.135 | -22.86% |
| BPM | BPM Minerals Ltd | $0.23 | -22.69% |
| GSM | Golden State Mining Ltd | $0.015 | -21.05% |
52 Week Highs
Code | Company | Last | % Chg |
|---|---|---|---|
| OOO | Betashares Crude Oil INDEX Currncy HDG Complex ETF | $10.17 | +42.64% |
| ATS | Australis Oil & Gas Ltd | $0.029 | +26.09% |
| ERM | Emmerson Resources Ltd | $0.385 | +16.67% |
| ZMI | ZINC of Ireland NL | $0.016 | +14.29% |
| YAL | Yancoal Australia Ltd | $7.17 | +13.27% |
52 Week Lows
Code | Company | Last | % Chg |
|---|---|---|---|
| MEL | Metgasco Ltd | $0.014 | -33.33% |
| NYM | Narryer Metals Ltd | $0.02 | -20.00% |
| KAL | Kalgoorlie Gold Mining Ltd | $0.035 | -14.63% |
| SVG | Savannah Goldfields Ltd | $0.013 | -13.33% |
| CLU | Cluey Ltd | $0.04 | -13.04% |
Near Highs
Code | Company | Last | % Chg |
|---|---|---|---|
| MQGPG | Macquarie Group Ltd | $103.10 | -0.37% |
| COI | Comet Ridge Ltd | $0.15 | +3.45% |
| DCOR | Daintree Core Income Active ETF | $51.77 | -0.12% |
| TLS | Telstra Group Ltd | $5.17 | -1.34% |
| WBCPL | Westpac Banking Corporation | $105.38 | -0.25% |
Relative Strength Index (RSI) Oversold
Code | Company | Last | % Chg |
|---|---|---|---|
| VISM | Vanguard MSCI International Small Companies INDEX ETF | $70.53 | -4.57% |
| IBAL | iShares Balanced Esg ETF | $29.35 | -1.71% |
| MOT | Metrics Income Opportunities Trust | $1.745 | -2.24% |
| ECRD | Betashares Aust Enhanced Credit Income Complex ETF | $25.07 | -0.63% |
| LIC | Lifestyle Communities Ltd | $4.62 | -3.35% |
