News | Market Wraps
Evening Wrap: ASX 200 sinks in triple-digit losing week as miners slump, energy stocks extend gains
The S&P/ASX 200 closed 6.9 points lower, down 0.08%.

Mentioned
The S&P/ASX 200 closed 6.9 points lower, down 0.08%.
The ASX 200 clung to near-flat to close out a fourth straight day of losses and its worst week since March, with the familiar energy-up, everything-else-down playbook still running as oil extended its winning streak to five sessions.
A late financials surge — a distinct sector buy order hitting at precisely 2pm AEST — was the only thing that kept Friday from looking considerably worse.
In stock specific news:
Suncorp (SUN) (+4.5%) — announced a five-year aggregate reinsurance cover and flagged that underlying ITR would land towards the upper end of its guidance range
Pilbara Minerals (PLS) (+1.94%) — delivered a solid March quarter backed by buoyant spodumene prices
Judo Capital (JDO) (+1.81%) — reported a lending pipeline of $2.2 billion and lending margins of 4.2% for the quarter, though lifted cost of risk guidance and flagged profit before tax likely at the lower end of guidance
NextDC (NXT) (+1.36%) — completed a fresh debt raise in the bond market
Newmont (NEM) (+1.07%) — improved grades and a healthy dividend and buyback program provided support on an otherwise weak day for gold stocks
IGO (IGO) (-17.9%) — production and sales volumes both missed analyst expectations by 27%, with a downward revision to guidance at its Greenbushes operation — the world's largest hard-rock lithium mine — with RBC describing the result as "a reset in expectations rather than a one-off shortfall"
EVT (-7.2%) — trading update flagged EBITDA growth in its hotels division — a major source of group earnings — would be only marginally higher than last year's
Fortescue (FMG) (-5.7%) — announced an additional $1 billion investment in green energy infrastructure and revised down Iron Bridge FY26 shipments guidance due to weather-related impacts in the March quarter
Be sure to click/scroll through for the usual reporting of the major sector and stock-specific moves, the broker responses to them, as well as all the key economic data in tonight's Evening Wrap.
Also, I have detailed technical analysis on the Nasdaq Composite and the S&P/ASX 200 in today's ChartWatch.
Let's dive in!
Today in Review
Fri 24 Apr 26, 4:59pm (AEST)
Name | Value | % Chg |
|---|---|---|
Major Indices | ||
| ASX 200 | 8,786.5 | -0.08% |
| All Ords | 9,006.4 | -0.20% |
| Small Ords | 3,501.6 | -0.81% |
| All Tech | 2,850.0 | -0.86% |
| Emerging Companies | 3,114.8 | -0.88% |
Currency | ||
| AUD/USD | 0.7122 | -0.10% |
US Futures | ||
| S&P 500 | 7,148.75 | +0.07% |
| Dow Jones | 49,399.0 | -0.18% |
| Nasdaq | 27,080.75 | +0.54% |
Name | Value | % Chg |
|---|---|---|
Sector | ||
| Utilities | 10,658.2 | +2.17% |
| Energy | 10,853.4 | +1.47% |
| Consumer Staples | 12,868.4 | +0.38% |
| Financials | 9,562.2 | +0.30% |
| Communication Services | 1,748.7 | +0.23% |
| Health Care | 26,135.5 | +0.18% |
| Consumer Discretionary | 3,460.8 | -0.03% |
| Information Technology | 1,791.3 | -0.28% |
| Industrials | 7,976.7 | -0.33% |
| Real Estate | 3,532.1 | -0.34% |
| Materials | 23,468.3 | -1.01% |
Markets
%20intraday%20chart_24%20Apr.png)
ASX 200 Session Chart
The S&P/ASX 200 (XJO) finished 6.9 points lower at 8,786.5, 0.6% from its session low and just 0.1% from its high. Disturbingly, the broader market didn’t really match the comeback at benchmark level, as in the broader-based S&P/ASX 300 (XKO) advancers lagged decliners by 108 to 177. For the week, the XJO finished down 160 points or 1.8% lower, 0.6% from its intraweek low and 2.2% from its intraweek high.
Utilities (XUJ) (+2.2%) was the session's best-performing sector as tight oil supply kept the energy-adjacent theme firmly in play. The sector's dual appeal — defensive income in a volatile market, combined with exposure to energy infrastructure — made it the natural landing spot for risk-averse flows. AGL Energy (AGL) (+2.9%) and Origin Energy (ORG) (+2.6%) led the move, with APA Group (APA) (+1.2%) also higher.
Energy (XEJ) (+1.5%) extended its run as Brent crude rose towards US$105/bbl — a fifth consecutive daily gain and its longest winning streak since January — driven by Trump's weekend social media post ordering the US Navy to "shoot and kill" mine-laying ships in the Strait of Hormuz. Woodside Energy (WDS) (+2.6%), Ampol (ALD) (+2.2%), and Karoon Energy (KAR) (+1.8%) were among the stronger movers. Santos (STO) (+1.0%) also gained.
Consumer Staples (XSJ) (+0.4%) firmed, drawing on both its defensive qualities and a strong performance from key constituents. Endeavour Group (EDV) (+3.6%) and Coles (COL) (+1.0%) led the sector.
Financials (XFJ) (+0.3%) recovered modestly from a bruising week — down 2.92% across five sessions — after what appeared to be a coordinated sector buy order around 2pm AEST lifted the index from negative territory. Suncorp (SUN) (+4.5%) was the standout on the back of its reinsurance announcement. Bank of Queensland (BOQ) (+2.0%) rebounded after Thursday's sharp fall. Commonwealth Bank (CBA) (+0.6%) was the only major bank to finish notably higher.
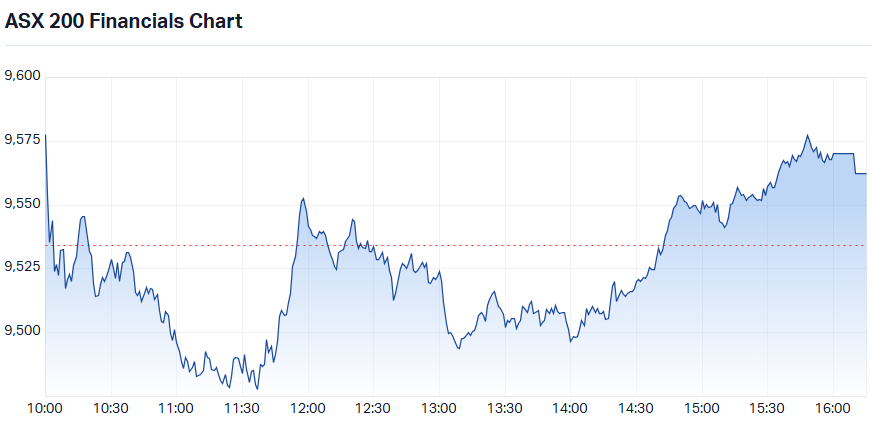
S&P-ASX 200 Financials Sector Index chart — something happened at precisely 2pm! 🧐
Health Care (XHJ) (+0.2%) edged up as Cochlear (COH) (+2.5%) and CSL (CSL) (+0.8%) partially recovered from this week's devastating losses. Telix Pharmaceuticals (TLX) (+3.3%) was also a bright spot. The weekly healthcare damage remains severe — the sector fell 6.5% for the week, its worst performance in years — and today's gains barely registered against that backdrop.
The Gold Sub-Index (XGD) (-2.5%) was the session's worst performer. When energy prices surge, they stoke inflation expectations, which pushes up official interest rate expectations, which raises the cost of holding gold — an asset with no yield.
The rotation between energy and gold has been one of the most consistent themes of the past two months, and Friday was no exception. COMEX gold futures fell 0.5% to US$4,698/oz and silver futures eased 0.6% to US$75.03/oz. Alkane Resources (ALK) (-5.3%), Vault Minerals (VAU) (-5.0%), Ora Banda Mining (OBM) (-4.8%), Emerald Resources (EMR) (-4.1%), and Northern Star Resources (NST) (-3.5%) were all sharply lower.
Materials (XMJ) (-1.0%) was weighed down by a damaging combination of stock-specific quarterly misses and softer base metals prices. COMEX copper futures fell 1.2% to US$6.00/lb, aluminium dropped 0.6%, and zinc fell 0.3% on the LME.
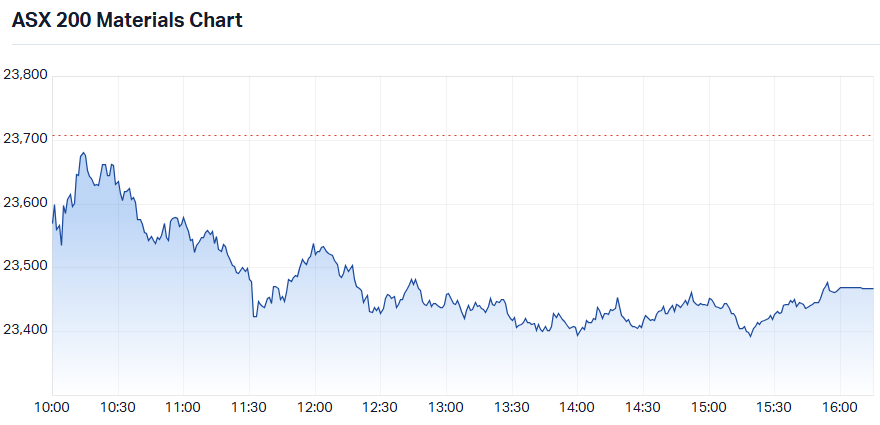
S&P-ASX 200 Materials Sector Index chart — no love in the last couple of hours...
Fortescue (FMG) (-5.7%) was the sector's heaviest drag after cutting Iron Bridge shipments guidance and announcing a further $1 billion green energy investment. Alcoa (AAI) (-3.6%), Capstone Copper (CSC) (-1.6%), South32 (S32) (-1.4%), and Sandfire Resources (SFR) (-0.9%) were all lower. SGX iron ore futures edged up 0.3% to US$106.95/t, but the positive price lead did little to support sentiment.
IGO (IGO) (-17.9%) was the session's standout casualty — covered in stock-specific news above — and dragged on the broader lithium and critical minerals cohort.
Uranium stocks continued their week of extreme volatility, pulling back after Thursday's sharp recovery — Bannerman Energy (BMN) (-5.5%), Deep Yellow (DYL) (-3.6%), and Paladin Energy (PDN) (-2.6%) all declined.
Rare earths stocks were also lower as NdPr prices in China fell 1.8% to 776,000 CNY/t, with Arafura Rare Earths (ARU) (-5.6%) and Chalice Mining (CHN) (-3.9%) both weaker. Australian spodumene concentrate in China edged up 0.2% to US$2,490/t, with Pilbara Minerals (PLS) (+1.94%) the notable beneficiary.
Today's best blue chip gainers
Company | Last Price | Change $ | Change % | 1mo % | 1yr % |
|---|---|---|---|---|---|
Suncorp (SUN) | $17.05 | +$0.73 | +4.5% | +3.5% | -12.2% |
Endeavour (EDV) | $3.50 | +$0.12 | +3.6% | -2.8% | -10.5% |
Telix Pharmaceuticals (TLX) | $14.90 | +$0.47 | +3.3% | +19.2% | -40.8% |
AGL Energy (AGL) | $9.53 | +$0.27 | +2.9% | +0.6% | -5.3% |
Woodside Energy (WDS) | $32.61 | +$0.84 | +2.6% | -6.1% | +65.4% |
Origin Energy (ORG) | $12.77 | +$0.32 | +2.6% | +2.3% | +25.7% |
Cochlear (COH) | $97.35 | +$2.35 | +2.5% | -39.7% | -62.6% |
Ampol (ALD) | $34.20 | +$0.72 | +2.2% | +1.1% | +56.4% |
Challenger (CGF) | $8.50 | +$0.17 | +2.0% | +7.3% | +23.5% |
Bank of Queensland (BOQ) | $6.68 | +$0.13 | +2.0% | -1.2% | -7.9% |
Medibank Private (MPL) | $4.65 | +$0.08 | +1.8% | +5.7% | +3.6% |
PLS Group (PLS) | $5.77 | +$0.09 | +1.6% | +27.1% | +312.1% |
Orica (ORI) | $21.22 | +$0.32 | +1.5% | +13.1% | +37.1% |
Nextdc (NXT) | $14.95 | +$0.2 | +1.4% | +18.1% | +39.0% |
James Hardie (JHX) | $30.88 | +$0.39 | +1.3% | +11.1% | -9.4% |
Worley (WOR) | $11.88 | +$0.15 | +1.3% | +11.8% | +2.0% |
Ramsay Health Care (RHC) | $39.99 | +$0.5 | +1.3% | +1.2% | +21.9% |
Dyno Nobel (DNL) | $3.24 | +$0.04 | +1.3% | +10.6% | +49.3% |
Aurizon (AZJ) | $4.18 | +$0.05 | +1.2% | +7.7% | +36.2% |
APA (APA) | $10.12 | +$0.12 | +1.2% | +6.1% | +22.8% |
Today's worst blue chip losers
Company | Last Price | Change $ | Change % | 1mo % | 1yr % |
|---|---|---|---|---|---|
IGO (IGO) | $7.01 | -$1.53 | -17.9% | -4.2% | +105.0% |
Fortescue (FMG) | $19.78 | -$1.19 | -5.7% | +0.5% | +32.3% |
Life360 (360) | $20.85 | -$0.91 | -4.2% | +7.4% | +7.7% |
Genesis Minerals (GMD) | $6.32 | -$0.26 | -4.0% | +10.5% | +42.7% |
Capricorn Metals (CMM) | $11.45 | -$0.44 | -3.7% | +17.7% | +12.6% |
Ramelius Resources (RMS) | $3.72 | -$0.14 | -3.6% | +8.5% | +26.5% |
Northern Star Resources (NST) | $21.86 | -$0.79 | -3.5% | +24.4% | -5.0% |
Eagers Automotive (APE) | $23.26 | -$0.6 | -2.5% | +7.5% | +37.5% |
Hub24 (HUB) | $83.44 | -$1.99 | -2.3% | +3.8% | +28.2% |
Pro Medicus (PME) | $138.34 | -$3.29 | -2.3% | +15.7% | -32.6% |
Greatland Resources (GGP) | $13.89 | -$0.33 | -2.3% | +47.9% | 0% |
Technology One (TNE) | $29.09 | -$0.69 | -2.3% | +6.1% | +5.4% |
SGH (SGH) | $40.14 | -$0.89 | -2.2% | +1.4% | -16.6% |
Evolution Mining (EVN) | $12.76 | -$0.28 | -2.1% | +7.3% | +43.9% |
Block, (XYZ) | $98.73 | -$1.96 | -1.9% | +14.0% | +21.1% |
Westgold Resources (WGX) | $6.07 | -$0.12 | -1.9% | +17.6% | +86.8% |
Insurance Australia (IAG) | $7.24 | -$0.14 | -1.9% | -1.4% | -8.8% |
Mineral Resources (MIN) | $59.37 | -$1.05 | -1.7% | +12.2% | +252.3% |
F & P Healthcare (FPH) | $29.42 | -$0.52 | -1.7% | -2.6% | -3.8% |
ChartWatch
Nasdaq Composite Index
Analysis
Sometimes that’s the way the cookie crumbles. You hold off, hold off, wait patiently to be absolutely sure the demand side is in total control of the price… move to FRP — and the next session is guaranteed to be a down one! 😅
Oh well, such is the life of a trend follower. Still, I still prefer my method over my prognosticating technical analysis cousins.
I was absolutely certain we’d just completed wave 2 — textbook stuff — right before price did the exact opposite. But now, looking at it again (and squinting just a little), it’s obvious we’re actually in a powerful wave 3… of a larger wave 5… possibly a sub-wave iii of (iii) — which, as everyone knows, is where the magic happens. Ignore that messy overlap — that’s just an extended ABC correction, or maybe a running flat, or a diagonal — I mean, there are a few interpretations here… um, the key point is: I was wrong before, but now I’m doubly sure — this time the count is perfect.
— Unnamed Elliott Wave Technician
Nope. The only tools in my toolbox are:
D > S = P ⬆️
D = S = P ➡️
S > D = P ⬇️
And that’s just the way I like it: Everything I need to know about markets is contained within those three rules! 💪
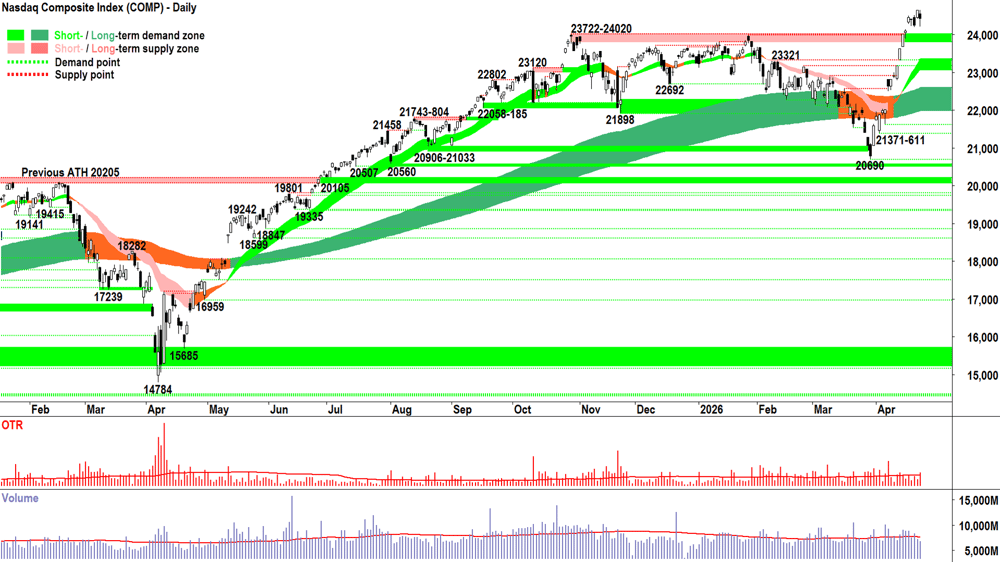
Did anything really change with last night’s black-bodied candle? You already know the answer to that: “Sure, it’s black, Carl, but look at that downward pointing shadow. Yes, we’re seeing some supply manifest up here — heck we’ve had a good run — but so far it really doesn’t look very motivated, nor does it look like it’s hitting in any great size. For now, it seems the demand still has its measure, because that downward pointing shadow speaks to me of BTD activity.”
And I’d say, “Okay, you’re speaking my language, but how can you possibly know the supply side’s motivation and size smarty pants?”
And you’d say: “Well Carl, you’ve taught me that the candle length tells me the motivation of each party, and the volume hints at their size. Look at that OTR, Thursday’s candle was about average in length — so average supply side motivation to kick off the session. Volume was below average — so probably they didn’t hit in any great size. The downward pointing shadow is only possible if the demand side came into BTD — a trait typical of a bull market — but they didn’t quite get the job done by the close. It wasn’t a definitive punch by either party, but you’ve always told me to look past one candle and at the bigger picture, which for me, shows strong short- and long-term uptrends, rising peaks and rising troughs (signalling supply removal and demand reinforcement) and a predominance of demand side candles (you know, the ones with the white bodies and or downward pointing shadows). It all suggests that the demand side is still well and truly in control.”
“Yep, okay, good," I'd say, "That’s that Analyse part, so, what do you do next?”
To which you'd reply, “Well Carl, we must Accept the fact that the evidence points to demand side control, and this means that MOTN, the Comp’s price is likely to rise. Heck, we both know that anything can happen from here — as you keep banging on about ‘The future is uncertain, prediction is futile’ and all that stuff… but I just gotta make my best guess on allocating my risk based on what's likely to occur MOTN”.
To which I’d question: “So, you’re saying, the Act part is actually to do nothing here given you’re at FRP?”
At which point you'd assure me that, "Based on the balance of probabilities, I’d still happy to add risk if we can find top quality long setups." Adding, "Obviously, we’re still looking out for shorts to provide a bit of balance, but only sparingly. We don’t get too excited about things, we just control what we can control — which is ourselves. Because I think we can both agree that based on the events of the last few weeks — we sure as heck can’t control the market! What will be will be, I just gotta keep doing the work, checking how the balance between demand and supply is changing, accept if and when it does, and manage my risk accordingly."
“And the rest will take care of itself...” we'd both say in unison. Snap!
Great chatting, you have a fantastic weekend! 👋
View
FRP (RP = Risk Position — it reflects my personal allowable capital allocation limit for my investments in US stocks. So 1/2RP is 50%, 2/3RP is 67% and FRP is 100% 🪣).
Key levels
There are no key supply zones to contend with. The old all-time high supply zone of 23722-24020 will likely act as a short term zone of demand, however the short-term trend ribbon (presently 23064-23349) is now the key zone of demand. If the price closes back below this range, the supply-side is very likely back in control of the Comp's price.
S&P/ASX 200 (XJO)
%20chart_24%20Apr.png)
Analysis
Not exactly a week where the S&P/ASX 200, aka The Old Tin Pot, covered itself in glory. 🤦
Today was a soggy end to a soggy week where we failed to grasp a very real opportunity to challenge the 9201 all-time high.
Instead, we confirmed 8987-9022 as a lower point of supply, lost the short term uptrend (today it reverted to amber / neutral), and even took a swipe at the long term uptrend ribbon (at least that's still up!).
However, perhaps we shouldn’t be surprised — not simply because “OTP, remember!?"
No, looking back across the price action since the 9055 peak all the way back in September last year, it is fair to say that the OTP hasn’t really gone anywhere. It’s just been stuck in a wide 1000-point range, saw-toothing between the top and the bottom.
This week's move merely returns the OTP’s price to equilibrium — back at the flattening long term trend ribbon — roughly in the middle of the range. Mean reversion.
As a trend follower, when there isn’t a clear and strong trend to trade, you know what I prefer to do: stay out. So, it makes perfect sense that my present portfolio risk setting is 1/2RP. That's still invested, though... I hear you say!
Well, we are considering an index here. It’s often an average of good, bad, and ugly trends.
Our job is to find the ‘good’, i.e., strong uptrends to add long-side risk and strong downtrends to add short-side risk, and to avoid the 'bad' and 'ugly' trends.
You will find that there are always opportunities even in sideways, choppy markets like the one we’re in. The important thing as far as my model is concerned is that overall risk is reduced to account for the choppiness and uncertainty. ⚖️
My Analysis says neutral/equilibrium on the OTP. I Accept that MOTN = ➡️. My Act is do nothing: 1/2RP. Yes, the choice to doing nothing is in fact doing something!
View
Today's downward pointing shadow is encouraging — particularly as it (along with yesterday's similar showing) confirms the long term uptrend ribbon is acting as a zone of dynamic demand. ✅
Still, given the broader technicals, I'm remain comfortable at 1/2RP 🪣 (i.e., my personal allowable capital allocation limit for my investments in Australian stocks is 50%).
Key levels
9201, the all time high, is the key point of supply. Below it there likely remains a degree of trepidation among market participants. A close above the last peak at 9022 would be constructive.
The OTP closed below the short-term trend ribbon (presently 8803-8822) — definitely not a good look! The long term uptrend (presently 8685-8864) must hold to stave off a retracement back to the 8262-8379 lows.
(Glossary of acronyms! MOTN: More Often Than Not | FOMO: Fear Of Missing Out | HOFU: Holding On For Upside | BTD: Buy The Dip | STR: Sell The Rally | RP: Risk Position)
ChartWatch *LIVE* Webinar
ChartWatch *LIVE* Webinars – WEEKLY Wednesday's @ 12pm AEDT
Learn more about technical analysis and trend following through real case studies on ASX stocks. Australia's premier technical analyst, Carl Capolingua, shares his unique insights on stocks as requested by viewers. Ask about a company in your portfolio or anything related to trading and investing and get Carl's expert opinion.
Places are limited so >REGISTER NOW!<
Economy
Today
There weren't any major economic data releases in our time zone today
Later this week
Friday/Saturday
No major economic data scheduled for release on this day
Latest News
Interesting Movers
Trading higher
+15.0% Nuix (NXL) – Federal Court dismisses ASIC disclosure case against Nuix.
+10.6% Elevra Lithium (ELV) – Continued positive response to 23-Apr March 2026 Quarterly Activities Report, general strength across the broader Lithium sector today, rise is consistent with prevailing short and long term uptrends, a regular in ChartWatch ASX Scans Uptrends list 🔎📈
+8.2% Omega Oil & Gas (OMA) – Continued positive response to 23-Apr OMA Raise A$60m to Fund Upgraded 26/27 Taroom Trough Program, general strength across the broader Energy sector today, rise is consistent with prevailing short and long term uptrends, a regular in ChartWatch ASX Scans Uptrends list 🔎📈
+6.9% Digico Infrastructure Reit (DGT) – No news 🤔.
+5.8% Data#3 (DTL) – No news, upgraded to buy from outperform at Taylor Collison.
+5.7% Sunrise Energy Metals (SRL) – No news, rise is consistent with prevailing short and long term uptrends, a regular in ChartWatch ASX Scans Uptrends list 🔎📈
+5.5% Viridis Mining and Minerals (VMM) – No news, rise is consistent with prevailing short and long term uptrends, a regular in ChartWatch ASX Scans Uptrends list 🔎📈
+5.3% Galan Lithium (GLN) – No news, general strength across the broader Lithium sector today.
+5.3% Catapult Sports (CAT) – No news 🤔.
+4.5% Genusplus (GNP) – Genus Awarded Koolunga Battery Energy Storage System Project, rise is consistent with prevailing short and long term uptrends, a regular in ChartWatch ASX Scans Uptrends list 🔎📈
+4.5% Suncorp (SUN) – FY27 Aggregate Reinsurance Cover and FY26 Outlook.
+4.4% Orezone (ORE) – Orezone Reports First Quarter 2026 Gold Production.
+4.3% Amplitude Energy (AEL) – No news, general strength across the broader Energy sector today.
+3.6% Endeavour (EDV) – No news, general strength across the broader Consumer Staples sector today.
+3.4% Reliance Worldwide Corp. (RWC) – No news, upgraded to overweight from neutral at JPMorgan.
+3.3% Telix Pharmaceuticals (TLX) – Continued positive response to 23-Apr Telix Announces Settlement of US$600M Convertible Bonds, rise is consistent with prevailing short term uptrend and long term trend is transitioning from down to up 🔎📈
+3.2% Wildcat Resources (WC8) – No news, general strength across the broader Lithium sector today, rise is consistent with prevailing short and long term uptrends, a regular in ChartWatch ASX Scans Uptrends list 🔎📈
+3.1% Vulcan Energy Resources (VUL) – Vulcan breaks ground at Lionheart lithium chemicals facilityN, general strength across the broader Lithium sector today.
+3.1% Southern Cross Electrical Engineering (SXE) – No news, rise is consistent with prevailing short and long term uptrends, a regular in ChartWatch ASX Scans Uptrends list 🔎📈
+2.9% AGL Energy (AGL) – No news, general strength across the broader Utilities sector today.
+2.7% Global X Semiconductor ETF (SEMI) – No news, rise is consistent with prevailing short and long term uptrends, a regular in ChartWatch ASX Scans Uptrends list 🔎📈
+2.6% Woodside Energy (WDS) – Continued positive response to 23-Apr AGM Addresses, general strength across the broader Energy sector today.
+2.6% Origin Energy (ORG) – No news, general strength across the broader Utilities sector today, rise is consistent with prevailing short and long term uptrends, a regular in ChartWatch ASX Scans Uptrends list 🔎📈
+2.5% Cochlear (COH) – No news, rebounded after last two days' sharp sell-off due to Trading update and reduction to FY26 earnings guidance.
Trading lower
-17.9% IGO (IGO) – March 2026 Quarterly Presentation and March 2026 Quarterly Activities Report.
-9.7% 4DMEDICAL (4DX) – No news, today’s move is consistent with recent volatility.
-9.1% Dateline Resources (DTR) – No news, fall is consistent with prevailing short term downtrend and long term trend is transitioning from up to down 🔎📉
-7.3% EVT (EVT) – EVT provides FY26 update.
-6.6% Unico Silver (USL) – March 2026 Quarterly Activities & Cashflow Report, general weakness across the broader Precious Metals sector today.
-5.8% Iperionx (IPX) – No news, fall is consistent with prevailing short term downtrend and long term trend is transitioning from up to down 🔎📉
-5.7% Fortescue (FMG) – March 2026 Quarterly Production Report and Fortescue Invests US$680m To Expand Pilbara Green Energy.
-5.6% Arafura Rare Earths (ARU) – No news, general weakness across the broader Rare Earths & Critical Minerals sector today, fall is consistent with prevailing short and long term downtrends.
-5.5% Bannerman Energy (BMN) – No news, general weakness across the broader Uranium sector today.
-5.3% Alkane Resources (ALK) – Change in substantial holding (GMT Capital Corp, 5.1% from 6.1%), general weakness across the broader Precious Metals sector today.
-5.0% Vault Minerals (VAU) – No news, general weakness across the broader Precious Metals sector today.
Broker Moves
Ai-Media Technologies (AIM)
Retained at hold at Morgans; Price Target: $0.25
Alkane Resources (ALK)
Retained at buy at Ord Minnett; Price Target: $2.10 from $2.05
Aristocrat Leisure (ALL)
Retained at buy at Morgans; Price Target: $63.00
Amcor Plc (AMC)
Retained at buy at Morgans; Price Target: $68.20 from $75.80
Atturra (ATA)
Retained at buy at Morgans; Price Target: $0.75
BHP Group (BHP)
Retained at hold at Morgans; Price Target: $53.80
Bank of Queensland (BOQ)
Upgraded to accumulate from hold at Morgans; Price Target: $7.39
Brambles (BXB)
Retained at accumulate at Morgans; Price Target: $25.50 from $27.00
CAR Group (CAR)
Retained at buy at Morgans; Price Target: $33.50
Catapult Sports (CAT)
Retained at buy at Morgans; Price Target: $5.55
Cobre (CBE)
Initiated at speculative buy at Canaccord Genuity; Price Target: $0.25
Charter Hall Group (CHC)
Downgraded to accumulate from buy at Ord Minnett; Price Target: $22.70 from $25.10
Centuria Industrial REIT (CIP)
Retained at accumulate at Ord Minnett; Price Target: $3.35
Centuria Capital Group (CNI)
Retained at buy at Ord Minnett; Price Target: $2.10 from $2.15
Data3 (DTL)
Retained at hold at Morgans; Price Target: $7.50
Upgraded to buy from outperform at Taylor Collison; Price Target: $8.50 from $7.00
Develop Global (DVP)
Retained at buy at Bell Potter; Price Target: $6.60 from $6.50
Elevra Lithium (ELV)
Retained at buy at Canaccord Genuity; Price Target: $16.50
Emerald Resources NL (EMR)
Retained at underweight at Barrenjoey; Price Target: $6.20 from $6.50
EVT (EVT)
Retained at buy at Citi; Price Target: $16.85
Fenix Resources (FEX)
Retained at buy at Bell Potter; Price Target: $0.63
Insurance Australia Group (IAG)
Retained at outperform at Macquarie; Price Target: $9.00
ikeGPS Group (IKE)
Retained at buy at Bell Potter; Price Target: $1.21 from $1.17
Ingenia Communities Group (INA)
Retained at buy at Ord Minnett; Price Target: $4.95 from $5.00
Light & Wonder Inc. (LNW)
Retained at buy at Morgans; Price Target: $183.00
Mirvac Group (MGR)
Retained at neutral at Citi; Price Target: $1.84
Retained at hold at CLSA; Price Target: $1.80 from $2.13
Retained at overweight at Jarden; Price Target: $2.24
Retained at equal-weight at Morgan Stanley; Price Target: $2.10
Downgraded to accumulate from buy at Ord Minnett; Price Target: $1.85 from $1.95
Retained at neutral at UBS; Price Target: $1.97
Megaport (MP1)
Retained at buy at Morgans; Price Target: $13.50
Medibank Private (MPL)
Retained at neutral at Macquarie; Price Target: $4.80
Newmont Corporation (NEM)
Retained at buy at UBS; Price Target: $195.00
NIB Holdings (NHF)
Retained at underperform at Macquarie; Price Target: $6.10
News Corporation (NWS)
Downgraded to overweight from buy at Jarden; Price Target: $46.30 from $46.80
NEXTDC (NXT)
Retained at buy at Morgans; Price Target: $18.00
Retained at buy at Ord Minnett; Price Target: $21.50 from $20.00
Objective Corporation (OCL)
Retained at buy at Morgans; Price Target: $14.60
Paladin Energy (PDN)
Retained at buy at Citi; Price Target: $15.00 from $12.80
Perseus Mining (PRU)
Retained at overweight at Barrenjoey; Price Target: $6.85 from $6.70
Retained at buy at Canaccord Genuity; Price Target: $8.80
Retained at buy at Citi; Price Target: $7.00
Retained at buy at Euroz Hartleys; Price Target: $6.85 from $6.60
Retained at overweight at JPMorgan; Price Target: $7.40
Retained at outperform at Macquarie; Price Target: $6.50
Retained at buy at UBS; Price Target: $6.75
QBE Insurance Group (QBE)
Retained at neutral at Macquarie; Price Target: $25.10
ReadyTech Holdings (RDY)
Retained at speculative buy at Morgans; Price Target: $2.15
REA Group (REA)
Retained at buy at Morgans; Price Target: $220.00
Reece (REH)
Downgraded to hold from accumulate at Morgans; Price Target: $14.10 from $17.70
Region Group (RGN)
Upgraded to accumulate from hold at Ord Minnett; Price Target: $2.55 from $2.35
Ramsay Health Care (RHC)
Retained at underweight at Morgan Stanley; Price Target: $35.60
Regis Resources (RRL)
Upgraded to buy from hold at Argonaut Securities; Price Target: $10.50 from $8.30
Retained at underweight at Barrenjoey; Price Target: $7.00
Retained at buy at Bell Potter; Price Target: $9.45 from $9.35
Retained at neutral at JPMorgan; Price Target: $7.00
Retained at outperform at RBC Capital Markets; Price Target: $11.10 from $11.00
Retained at buy at UBS; Price Target: $8.75 from $8.65
Resolute Mining (RSG)
Retained at buy at Canaccord Genuity; Price Target: $3.15
Reliance Worldwide Corporation (RWC)
Upgraded to overweight from neutral at JPMorgan; Price Target: $3.65 from $3.75
Retained at hold at Morgans; Price Target: $3.00 from $3.65
South32 (S32)
Retained at buy at Jefferies; Price Target: $5.25 from $5.20
Retained at overweight at JPMorgan; Price Target: $5.10 from $5.00
Retained at outperform at RBC Capital Markets; Price Target: $4.70
Scentre Group (SCG)
Retained at accumulate at Ord Minnett; Price Target: $3.90 from $3.95
Steadfast Group (SDF)
Retained at outperform at Macquarie; Price Target: $4.80
SiteMinder (SDR)
Retained at buy at Morgans; Price Target: $5.90
SEEK (SEK)
Retained at buy at Citi; Price Target: $24.15 from $26.00
Retained at buy at Morgans; Price Target: $25.10
Sandfire Resources (SFR)
Downgraded to hold from buy at Argonaut Securities; Price Target: $18.50 from $19.00
Retained at overweight at Barrenjoey; Price Target: $19.00 from $20.00
Retained at overweight at JPMorgan; Price Target: $19.70 from $19.40
Retained at underweight at Morgan Stanley; Price Target: $16.20
Upgraded to accumulate from hold at Morgans; Price Target: $20.40
Retained at accumulate at Ord Minnett; Price Target: $20.30 from $19.75
Downgraded to sell from neutral at UBS; Price Target: $16.75 from $17.05
Stockland (SGP)
Downgraded to neutral from buy at Bank of America; Price Target: $4.40 from $6.50
Santos (STO)
Retained at buy at Citi; Price Target: $8.65
Retained at outperform at CLSA; Price Target: $10.40 from $10.30
Retained at overweight at Jarden; Price Target: $8.80 from $8.85
Retained at equal-weight at Morgan Stanley; Price Target: $7.50
Retained at accumulate at Ord Minnett; Price Target: $7.90
Retained at outperform at RBC Capital Markets; Price Target: $8.50
Retained at buy at UBS; Price Target: $8.80 from $8.70
Suncorp Group (SUN)
Retained at outperform at Macquarie; Price Target: $18.70
Tetratherix (TTX)
Retained at speculative buy at Morgans; Price Target: $6.84 from $7.03
Vicinity Centres (VCX)
Downgraded to hold from accumulate at Ord Minnett; Price Target: $2.50
West African Resources (WAF)
Retained at buy at Argonaut Securities; Price Target: $6.20
Retained at overweight at Barrenjoey; Price Target: $4.80 from $4.90
Retained at speculative buy at Euroz Hartleys; Price Target: $5.55 from $5.50
Retained at outperform at Macquarie; Price Target: $4.00 from $4.50
Wisetech Global (WTC)
Retained at buy at Morgans; Price Target: $70.40
Scans
Top Gainers
Code | Company | Last | % Chg |
|---|---|---|---|
| KEY | KEY Petroleum Ltd | $0.165 | +50.00% |
| AI1 | Adisyn Ltd | $0.20 | +48.15% |
| PAT | Patriot Resources Ltd | $0.098 | +44.12% |
| MVP | Medical Developments International Ltd | $0.52 | +35.07% |
| COB | Cobalt Blue Holdings Ltd | $0.125 | +25.00% |
Top Fallers
Code | Company | Last | % Chg |
|---|---|---|---|
| CTO | Citigold Corporation Ltd | $0.015 | -31.82% |
| CLA | Celsius Resources Ltd | $0.011 | -21.43% |
| VMT | Vmoto Ltd | $0.115 | -20.69% |
| QOR | QORIA Ltd | $0.26 | -18.75% |
| IGO | IGO Ltd | $7.01 | -17.92% |
52 Week Highs
Code | Company | Last | % Chg |
|---|---|---|---|
| KEY | KEY Petroleum Ltd | $0.165 | +50.00% |
| AI1 | Adisyn Ltd | $0.20 | +48.15% |
| PAT | Patriot Resources Ltd | $0.098 | +44.12% |
| PKY | Pathkey.Ai Ltd | $0.037 | +23.33% |
| RMI | Resource Minerals International Ltd | $0.037 | +15.63% |
52 Week Lows
Code | Company | Last | % Chg |
|---|---|---|---|
| QOR | QORIA Ltd | $0.26 | -18.75% |
| SUH | Southern Hemisphere Mining Ltd | $0.023 | -8.00% |
| INF | Infinity Metals Ltd | $0.012 | -7.69% |
| IMU | Imugene Ltd | $0.125 | -7.41% |
| KOA | The Koala Company Ltd | $3.47 | -4.93% |
Near Highs
Code | Company | Last | % Chg |
|---|---|---|---|
| AYLD | Global X S&P/ASX 200 Covered Call Complex ETF | $10.23 | -0.20% |
| GLN | Galan Lithium Ltd | $0.495 | +5.32% |
| HGBL | Betashares Global Shares Currency Hedged ETF | $80.46 | +0.21% |
| AHL | Adrad Holdings Ltd | $1.30 | -1.52% |
| ASIA | Betashares Asia Technology Tigers ETF | $17.41 | +1.40% |
Relative Strength Index (RSI) Oversold
Code | Company | Last | % Chg |
|---|---|---|---|
| DGL | DGL Group Ltd | $0.405 | +1.25% |
| AX1 | Accent Group Ltd | $0.625 | +0.81% |
| EML | EML Payments Ltd | $0.39 | 0.00% |
| DTR | Dateline Resources Ltd | $0.25 | -9.09% |
| SDV | Scidev Ltd | $0.11 | 0.00% |
