
News | Market Wraps
Evening Wrap: ASX 200 rallies as inflation data bolsters 'no more hikes' case, retail, tech stocks shine, CSL bounces
The S&P/ASX 200 closed 59.9 points higher, up 0.69%.

Mentioned
The S&P/ASX 200 closed 59.9 points higher, up 0.69%.
The ASX 200 rallied after April inflation came in below expectations, all but ruling out a June RBA rate hike and triggering a sharp rally in rate-sensitive sectors across the board. High-multiple growth stocks, bond-proxy sectors, and materials all advanced — but in a conspicuous departure from the script, gold stocks and financials largely sat out the party.
Be sure to click/scroll through for the usual reporting of the major sector and stock-specific moves, the broker responses to them, as well as all the key economic data in tonight's Evening Wrap. Also, I have detailed technical analysis on the Nasdaq Composite and the S&P/ASX 200 in today's ChartWatch.
Let's dive in!
Today in Review
Wed 27 May 26, 5:35pm (AEST)
Name | Value | % Chg |
|---|---|---|
Major Indices | ||
| ASX 200 | 8,717.7 | +0.69% |
| All Ords | 8,945.1 | +0.70% |
| Small Ords | 3,473.7 | +0.95% |
| All Tech | 2,808.4 | +1.98% |
| Emerging Companies | 3,030.7 | +0.95% |
Currency | ||
| AUD/USD | 0.7146 | -0.30% |
US Futures | ||
| S&P 500 | 7,546.0 | +0.12% |
| Dow Jones | 50,670.0 | +0.24% |
| Nasdaq | 30,118.25 | +0.15% |
Name | Value | % Chg |
|---|---|---|
Sector | ||
| Consumer Discretionary | 3,500.7 | +1.81% |
| Information Technology | 1,772.6 | +1.78% |
| Utilities | 9,738.1 | +1.70% |
| Real Estate | 3,593.5 | +1.56% |
| Health Care | 23,058.0 | +1.44% |
| Materials | 24,979.1 | +0.93% |
| Industrials | 8,101.9 | +0.70% |
| Energy | 10,458.2 | +0.43% |
| Consumer Staples | 11,696.3 | +0.14% |
| Financials | 9,225.5 | +0.10% |
| Communication Services | 1,655.5 | -0.25% |
Markets
%20intraday%20chart_27%20May.png)
ASX 200 Session Chart
The S&P/ASX 200 (XJO) finished 59.9 points higher at 8,717.7, 1.1% from its session low and smack–bang on its session high. This positivity was reflected In the broader-based S&P/ASX 300 (XKO) with advancers beat decliners by a tidy 192 to 91.
Consumer Discretionary (XDJ) (+1.8%) and Information Technology (XIJ) (+1.8%) jointly led the session's gains as falling benchmark bond yields — driven by the better-than-expected April CPI and reinforced by an overnight global bond market rally — lifted the present value of future earnings for long-duration, high-P/E stocks. When risk-free yields fall, the earnings streams of growth stocks are discounted at a lower rate, making them worth more today.
Premier Investments (PMV) (+3.8%), Nick Scali (NCK) (+3.5%), Aristocrat Leisure (ALL) (+3.2%), and Temple & Webster (TPW) (+2.9%) led Consumer Discretionary.
Within Technology, Elsight (ELS) (+8.9%), Dicker Data (DDR) (+8.6%), Megaport (MP1) (+8.6%), Weebit Nano (WBT) (+7.0%), and Siteminder (SDR) (+6.0%) were the standouts, with NextDC (NXT) (+3.8%) also advancing on AI-driven demand tailwinds.
Utilities (XUJ) (+1.7%) and Real Estate (XPJ) (+1.6%) were the other major winners as bond-proxy sectors — whose stable income streams compete directly with risk-free government bonds — found buyers as yields retreated. Origin Energy (ORG) (+3.0%) and AGL Energy (AGL) (+0.9%) led Utilities. Goodman Group (GMG) (+3.7%) and Lifestyle Communities (LIC) (+3.7%) were the Real Estate standouts.
Health Care (XHJ) (+1.4%) joined the rate-sensitive rally. 4DMedical (4DX) (+5.1%), Fisher & Paykel Healthcare (FPH) (+4.1%), and CSL (CSL) (+2.4%) all advanced — a welcome change of direction for it and a sector that has been the ASX's most persistent underperformers.
Materials (XMJ) (+0.9%) were broadly firmer, though less of a standout than in recent sessions. Aluminium hit a four-year high overnight and copper remained elevated. Capstone Copper (CSC) (+4.0%), South32 (S32) (+3.5%), BHP (BHP) (+1.5%), and Sandfire Resources (SFR) (+1.5%) all gained.
Financials (XFJ) (+0.1%) was conspicuously absent from the day's winners despite lower bond yields typically being a double tailwind for banks — improving both credit growth prospects and credit quality. The sector's near-flat result, in a session where every macro signal should have been supportive, is a warning sign that fund flows into the sector remain cautious.
ASX Ltd. (ASX) (-8.5%) — extending Tuesday's record fall as CLSA downgraded its rating — was the primary drag. Westpac (WBC) (-0.6%) also fell after the Federal Court ordered a $26 million penalty for financial hardship failures. Commonwealth Bank (CBA) (+0.3%) and Macquarie Group (MQG) (+1.0%) provided partial offsets.
The Gold Sub-Index (XGD) (+0.1%) was equally conspicuous in its failure to rally — lower risk-free yields should reduce the opportunity cost of holding non-yielding precious metals, yet the sector was essentially flat. When a sector doesn't respond to seemingly good news, it typically signals it's on the wrong end of fund flows — a caution worth noting. Capricorn Metals (CMM) (+3.2%) and West African Resources (WAF) (+2.6%) were the few bright spots.
Energy (XEJ) (+0.4%) edged higher despite a continued soft oil price backdrop, carried by coal stocks that extended their recent recovery. New Hope Corp. (NHC) (+2.6%), Whitehaven Coal (WHC) (+2.2%), and Yancoal Australia (YAL) (+2.1%) all advanced. Karoon Energy (KAR) (-1.3%) was the notable exception.
Communication Services (XTJ) (-0.2%) and Consumer Staples (XSJ) (+0.1%) were both little changed — defensives that attract flows on risk-off days found few buyers in today's decisively risk-on session. Telstra (TLS) (-0.9%) was the Communication Services drag; within Staples, Woolworths (WOW) (+0.4%) and A2 Milk (A2M) (+0.5%) managed modest gains.
Today's best ASX Top 300 gainers
Company | Last Price | Change $ | Change % | 1mo % | 1yr % |
|---|---|---|---|---|---|
Nufarm (NUF) | $2.91 | +$0.35 | +13.7% | +21.3% | +22.8% |
Elsight (ELS) | $6.47 | +$0.53 | +8.9% | -7.4% | +895.4% |
Dicker Data (DDR) | $9.68 | +$0.77 | +8.6% | +7.4% | +17.6% |
Megaport (MP1) | $14.98 | +$1.19 | +8.6% | +67.7% | +14.4% |
Austal (ASB) | $4.25 | +$0.3 | +7.6% | -0.9% | -20.7% |
Weebit Nano (WBT) | $7.84 | +$0.51 | +7.0% | +94.1% | +329.6% |
Siteminder (SDR) | $3.02 | +$0.17 | +6.0% | 0% | -33.8% |
Infratil (IFT) | $13.14 | +$0.72 | +5.8% | +30.7% | +34.9% |
EQT (EQT) | $16.11 | +$0.84 | +5.5% | -19.3% | -49.2% |
4DMEDICAL (4DX) | $3.49 | +$0.17 | +5.1% | -25.9% | +1044.3% |
Data#3 (DTL) | $8.75 | +$0.42 | +5.0% | +8.6% | +18.2% |
Tabcorp (TAH) | $0.730 | +$0.035 | +5.0% | -33.9% | +2.1% |
Bannerman Energy (BMN) | $3.70 | +$0.16 | +4.5% | -15.3% | +30.7% |
Nanosonics (NAN) | $3.24 | +$0.14 | +4.5% | -7.4% | -27.0% |
Silex Systems (SLX) | $6.49 | +$0.28 | +4.5% | +3.3% | +85.4% |
Fisher & Paykel Healthcare (FPH) | $31.29 | +$1.24 | +4.1% | +6.5% | -3.7% |
Capstone Copper (CSC) | $14.90 | +$0.57 | +4.0% | +26.8% | +79.5% |
Superloop (SLC) | $3.69 | +$0.14 | +3.9% | +9.5% | +40.8% |
Premier Investments (PMV) | $12.25 | +$0.45 | +3.8% | -1.4% | -40.7% |
Nextdc (NXT) | $15.20 | +$0.55 | +3.8% | +5.4% | +18.2% |
Today's worst ASX Top 300 losers
Company | Last Price | Change $ | Change % | 1mo % | 1yr % |
|---|---|---|---|---|---|
ASX (ASX) | $46.06 | -$4.97 | -9.7% | -20.7% | -35.4% |
Metals X (MLX) | $1.565 | -$0.125 | -7.4% | +11.4% | +192.5% |
Meeka Metals (MEK) | $0.130 | -$0.01 | -7.1% | -7.1% | -13.3% |
Endeavour (EDV) | $2.93 | -$0.15 | -4.9% | -13.8% | -27.7% |
Black Cat Syndicate (BC8) | $1.195 | -$0.055 | -4.4% | +3.9% | +47.5% |
Neuren Pharmaceuticals (NEU) | $13.84 | -$0.59 | -4.1% | +16.0% | -1.5% |
Power (PWH) | $9.26 | -$0.39 | -4.0% | +5.3% | +38.2% |
IDP Education (IEL) | $2.65 | -$0.11 | -4.0% | -21.6% | -66.5% |
Amplitude Energy (AEL) | $1.755 | -$0.065 | -3.6% | -1.4% | -14.7% |
Immutep (IMM) | $0.054 | -$0.002 | -3.6% | -14.3% | -81.7% |
Tuas (TUA) | $2.11 | -$0.06 | -2.8% | -63.8% | -62.6% |
Elders (ELD) | $5.64 | -$0.16 | -2.8% | -19.7% | -9.0% |
Sunrise Energy Metals (SRL) | $15.29 | -$0.43 | -2.7% | +24.0% | +3260.4% |
St Barbara (SBM) | $0.550 | -$0.015 | -2.7% | -14.1% | +74.6% |
Dateline Resources (DTR) | $0.185 | -$0.005 | -2.6% | -21.3% | +320.5% |
Charter Hall (CHC) | $19.73 | -$0.5 | -2.5% | -0.4% | +7.9% |
Polynovo (PNV) | $1.205 | -$0.03 | -2.4% | +22.3% | -6.2% |
Minerals 260 (MI6) | $0.835 | -$0.02 | -2.3% | +14.4% | +475.9% |
IGO (IGO) | $9.25 | -$0.22 | -2.3% | +23.5% | +125.6% |
ChartWatch
Nasdaq Composite Index
Analysis
Is anyone reading this surprised by Tuesday's gain on the Comp? 🤔
No, I didn’t think so — it’s not like any dyed in the wool deep-value fundamental analyst would be caught dead reading ChartWatch! 🤣
But that’s their loss, because the brand of trend following I practice here is proving to be absolutely spot on.
And it will continue to be that way… Until it isn’t = When the trend changes.
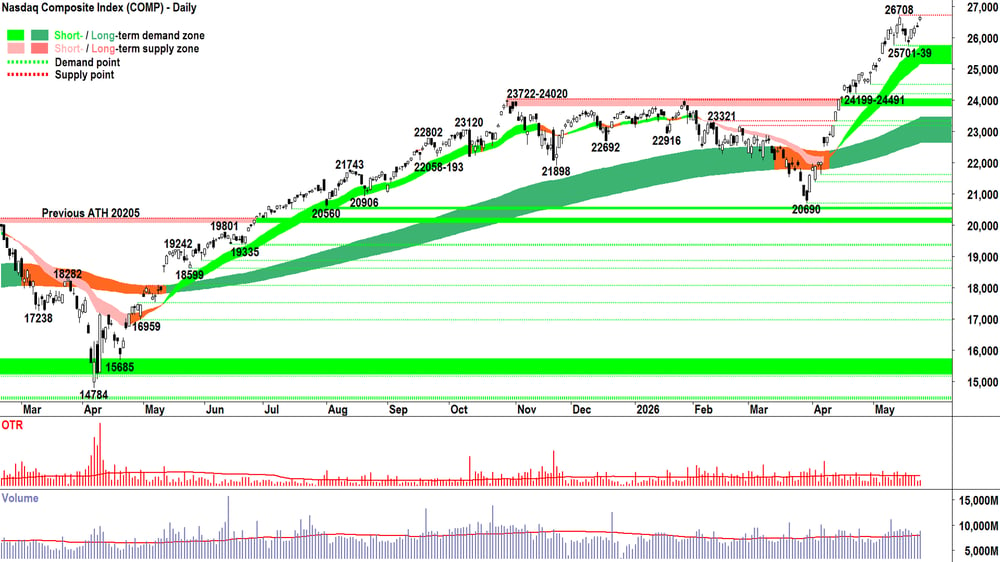
The good news is that there’s nothing in the above chart that suggests to me the short and long term uptrends are about to change. The trend ribbons are impeccable double greens, the price action is rising peaks and rising troughs with substantially larger motive phases (up-moves) compared stagnation phases (down-moves) and the candles are predominantly demand side in nature (white-bodied and or downward pointing shadows).
✅✅✅
Volume was above average last night. No red flag there either. Above average demand met above average supply. Why above average supply? That’s a bad thing, right — an above average amount of supply came to market — they didn’t believe in HOFU!
In this specific instance, trends, price action, candles — elevated volume here is okay. That’s because we’re punching up against a clear point of supply in the form of 26708.
We expect there to be elevated supply there. Importantly, the candle (gap and run, high close) tells us the supply side was not motivated in their activities — but the demand side was.
✅
Copy and paste from yesterday vis-à-vis what we’re on the lookout for… the fingerprints of excess supply! (But, ladies and gentlemen, long suffering readers of ChartWatch… that’s what good trading is all about: consistency!)
And as always... we remain vigilant to signs in the price action and volume that supply might be growing in influence:
Greater prevalence of black-bodied and/or upward pointing shadows (longer length = more motivated; vs shorter length = less motivated; larger volume = larger supply side ammunition)
A lower peak to 26708 is set, soon followed by a lower trough to 25701
The price closes below the short term trend ribbon, soon followed by the short term trend ribbon transitioning to amber, and eventually at some point impeding upward price action by acting as a zone of dynamic excess supply
The process is repeated at the long term trend ribbon
View
FRP (RP = Risk Position — it reflects my personal allowable capital allocation limit for my investments in US stocks. So 1/2RP is 50%, 2/3RP is 67% and FRP is 100% 🪣).
Key levels
26708 is the key point of supply. 25701-39 is the closest point of demand, then there's the short term uptrend ribbon (presently 25161-25725). If the price closes back below this range, the supply-side is very likely back in control of the Comp's price.
S&P/ASX 200 (XJO)
%20chart_27%20May.png)
Analysis
That’ll do OTP. That’ll do…
A pat on the head for you OTP! 🐷
It wasn’t a spectacular session… It wasn’t a triple digit gain... Heck, it’s not like the rest of the chart above is any good… But there’s something about today’s session that I like. 🤔
The OTP was the little train that could. It just kept chugging and chugging along… let me show you the intraday chart again… I think I can… I think I can… 🚂
I think I can… I think I can… 🚂
Until, at 4:10pm, following the mysterious closing price auction where the big fund managers get to play shenanigans with prices — It did!
That closing price auction jump demonstrates latent demand. The same latent demand that bubbled away patiently in the system throughout the day, hoovering up supply, not want to show its hand.
This could be it: the beginning of the OTP’s great resurgence! 🚀
Or not. Can’t tell the future, remember! 🤣
Jokes aside, 8485 is increasingly looking the goods as a credible point of demand. Fingers crossed, we see a similar demand side candle tomorrow that closes us above the trend ribbons. Importantly, however, it should be longer than today’s — indicating that the demand side is losing patience and is therefore growing in motivation.
Similarly, that the supply side is increasingly getting out of their way and choosing to HOFU.
As innocuous as today’s candle looks to the untrained eye — I am pegging it as an important step towards our ‘great catch up’ to US stocks. (Or not 😉!)
View
I remain 1/3RP 🪣 on the OTP (i.e., my personal allowable capital allocation limit for my investments in Australian stocks is 33%).
Key levels
The short- and long-term trend ribbons (presently 8677-8740) combine to represent the key zone of supply. Beyond that, it's the not so lucky 8888 level! Demand is the 8262-8379 zone. Below that... 😱!
(Glossary of acronyms! Old Tin Pot (OTP): S&P/ASX 200 | MOTN: More Often Than Not | FOMO: Fear Of Missing Out | HOFU: Holding On For Upside | BTD: Buy The Dip | STR: Sell The Rally | RP: Risk Position)
***NEW VIDEO DROPPED! 📺***
BHP, RIO, FMG... ASX big miners are back baby! Plus lithium and uranium sector reviews
ChartWatch *LIVE* Webinar
ChartWatch *LIVE* Webinars – WEEKLY Wednesday's @ 12pm AEDT
Learn more about technical analysis and trend following through real case studies on ASX stocks. Australia's premier technical analyst, Carl Capolingua, shares his unique insights on stocks as requested by viewers. Ask about a company in your portfolio or anything related to trading and investing and get Carl's expert opinion.
Places are limited so >REGISTER NOW!<
Economy
Today
AUS April Consumer Price Index (CPI)
Headline: +0.4% m/m & +4.2% p.a. vs +0.6% m/m & +4.4% p.a. forecast and +1.1% m/m & +4.6% p.a. previous
Trimmed Mean: +0.3% m/m and +3.4% p.a. vs +0.3% m/m forecast and +0.3% m/m previous
Takeaways:
Headline better than expected, trimmed mean in-line — but back up to the highest in 18 months, and well above the RBA's target +2-3% p.a. band.
The odds of a another one-quarter RBA official cash rate increase at the August meeting fell to 40% from 51%.
Data seems to back up last week's weaker than expected employment data, and is likely to be welcomed as good news by the RBA.
Later this week
Thursday
09:30 AUS April Household Spending (-0.3% m/m forecast vs +1.6% m/m previous)
20:30 USA April Personal Consumption Expenditures (PCE)
PCE Index: +0.3% m/m forecast vs +0.3% m/m previous
Personal Income: +0.4% m/m forecast vs +0.6% m/m previous
Personal Spending: +0.5% m/m forecast vs +0.9% m/m previous
20:30 USA March Quarter Preliminary GDP (+2.1% p/.a forecast vs +0.7% p.a. previous)
20:30 USA April Core Durable Goods Orders (+0.5% m/m forecast vs +0.9% m/m previous)
22:00 USA April New Home Sales (661,000 forecast vs 682,000 previous)
Friday
09:30 AUS April Private Sector Credit (+0.6% m/m forecast vs +0.7% m/m previous)
Latest News
Interesting Movers
Trading higher
+17.3% KMD Brands (KMD) - launched a business review of its capital structure, portfolio configuration, and other value-creation opportunities, while reporting second-half group sales growth of 5.2% ahead of the 4.3% consensus, with Kathmandu same-store sales up 8.9% despite a deceleration from earlier in the quarter.
+13.7% Nufarm (NUF) - delivered first-half underlying EBITDA of $243 million, up 18% year-on-year, landing within guidance and slightly ahead of consensus, with Seed Technologies EBITDA more than doubling to $58 million; the company reaffirmed its full-year outlook for strong underlying EBITDA growth.
+7.8% Southern Cross Media (SXL) - Gina Rinehart disclosed she had accumulated a stake of just over 9% in the company, marking her first investment in a media business since her Fairfax stake a decade ago.
+2.1% Web Travel (WEB) - FY26 EBITDA of $148.4 million came in approximately 3% ahead of the $144 million consensus despite geopolitical disruption, with revenue margin improving 30 basis points year-on-year to 6.8% and an exit rate of 7.1% pointing to continued momentum.
Trading lower
-8.5% ASX Ltd. (ASX) - CLSA downgraded to Hold from Outperform and cut its price target to $51.30 from $55.40, with analyst Ed Henning acknowledging revenue momentum remains supportive but noting the revised cost outlook is well above expectations.
-4.9% Endeavour Group (EDV) - announced a major restructure including plans to sell most of its vineyard and winery assets, slash its dividend payout, and target $300 million in cost savings to improve profitability; the company said it would retain strategically important brands while exiting non-core winery and agricultural assets.
-4.1% Neuren Pharmaceuticals (NEU) - disclosed at its AGM that it is reassessing capital management options in light of projected royalty growth from DAYBUE and DAYBUE STIX and the potential for further milestone payments.
Broker Moves
Life360 Inc (360)
Retained at buy at Bell Potter; Price Target: $33.00 from $32.50
Adairs (ADH)
Retained at hold at Ord Minnett; Price Target: $1.60 from $2.30
AGL Energy (AGL)
Retained at underweight at Morgan Stanley; Price Target: $9.28
Aristocrat Leisure (ALL)
Retained at buy at UBS; Price Target: $69.40
ANZ Group Holdings (ANZ)
Retained at neutral at Macquarie; Price Target: $32.50 from $33.50
Retained at neutral at UBS; Price Target: $36.50
Aroa Biosurgery (ARX)
Retained at buy at Bell Potter; Price Target: $1.09 from $1.12
Retained at buy at Morgans; Price Target: $0.79 from $0.77
Abacus Storage King (ASK)
Retained at buy at Shaw and Partners; Price Target: $1.60 from $1.65
ASX (ASX)
Retained at neutral at Citi; Price Target: $56.20 from $56.80
Downgraded to hold from outperform at CLSA; Price Target: $51.30 from $55.40
Retained at neutral at Jarden; Price Target: $55.30 from $58.75
Retained at overweight at JPMorgan; Price Target: $57.00 from $63.50
Retained at neutral at Macquarie; Price Target: $54.00 from $58.50
Retained at hold at Ord Minnett; Price Target: $51.30 from $59.85
Retained at buy at UBS; Price Target: $62.00 from $65.20
Adveritas (AV1)
Retained at buy at Bell Potter; Price Target: $0.18
Black Cat Syndicate (BC8)
Initiated at buy at Ord Minnett; Price Target: $2.20
Bendigo and Adelaide Bank (BEN)
Retained at underperform at Macquarie; Price Target: $9.00 from $9.75
Bank of Queensland (BOQ)
Retained at underperform at Macquarie; Price Target: $5.25 from $5.70
Commonwealth Bank of Australia (CBA)
Retained at underperform at Macquarie; Price Target: $111.00 from $114.00
Retained at sell at UBS; Price Target: $130.00
Challenger (CGF)
Retained at buy at Citi; Price Target: $10.00
Downgraded to hold from outperform at CLSA; Price Target: $8.85
Retained at neutral at Jarden; Price Target: $8.70
Retained at hold at Jefferies; Price Target: $9.25
Retained at overweight at JPMorgan; Price Target: $10.00
Retained at buy at UBS; Price Target: $10.20 from $10.10
Electro Optic Systems Holdings (EOS)
Retained at buy at Bell Potter; Price Target: $10.60 from $10.40
Flight Centre Travel Group (FLT)
Retained at buy at Canaccord Genuity; Price Target: $14.60
Retained at overweight at Jarden; Price Target: $16.50 from $16.80
Retained at buy at Jefferies; Price Target: $14.00 from $15.00
Retained at outperform at RBC Capital Markets; Price Target: $15.00
Retained at buy at UBS; Price Target: $14.50
Fisher & Paykel Healthcare Corporation (FPH)
Upgraded to positive from neutral at E&P; Price Target: $36.01 from $31.95
Retained at buy at Goldman Sachs; Price Target: $42.30
Retained at overweight at Morgan Stanley; Price Target: $33.70 from $32.80
Goodman Group (GMG)
Retained at buy at Bell Potter; Price Target: $35.50 from $36.45
Retained at outperform at CLSA; Price Target: $35.59
Initiated at positive at E&P; Price Target: $36.50
Retained at buy at Jarden; Price Target: $35.56
Retained at overweight at Morgan Stanley; Price Target: $36.15
Retained at buy at Morgans; Price Target: $36.00 from $32.45
Retained at hold at Ord Minnett; Price Target: $29.15 from $29.00
Infratil (IFT)
Retained at accumulate at Morgans; Price Target: $13.80 from $11.30
Judo Capital Holdings (JDO)
Retained at outperform at Macquarie; Price Target: $1.85
Light & Wonder Inc. (LNW)
Retained at buy at UBS; Price Target: $210.00
Macquarie Group (MQG)
Retained at neutral at UBS; Price Target: $250.00
National Australia Bank (NAB)
Retained at neutral at Macquarie; Price Target: $39.00 from $40.50
Retained at buy at UBS; Price Target: $48.50
Origin Energy (ORG)
Retained at underweight at Morgan Stanley; Price Target: $11.00
Rio Tinto (RIO)
Retained at neutral at Citi; Price Target: $179.00 from $170.00
South32 (S32)
Retained at buy at Citi; Price Target: $5.60 from $5.40
Superloop (SLC)
Downgraded to overweight from buy at Jarden; Price Target: $3.60 from $3.40
Santos (STO)
Retained at outperform at Bernstein; Price Target: $8.90
Retained at outperform at CLSA; Price Target: $10.40
Retained at overweight at Jarden; Price Target: $8.75
Retained at equal-weight at Morgan Stanley; Price Target: $7.50
Retained at outperform at RBC Capital Markets; Price Target: $8.50
Tabcorp Holdings (TAH)
Retained at buy at UBS; Price Target: $1.20
The Lottery Corporation (TLC)
Retained at buy at UBS; Price Target: $6.20
Westpac Banking Corporation (WBC)
Retained at underperform at Macquarie; Price Target: $30.00 from $31.00
Retained at neutral at UBS; Price Target: $40.00
WEB Travel Group (WEB)
Retained at buy at Citi; Price Target: $3.90
Scans
Top Gainers
Code | Company | Last | % Chg |
|---|---|---|---|
| HTG | Harvest Technology Group Ltd | $0.019 | +90.00% |
| MNB | Minbos Resources Ltd | $0.023 | +53.33% |
| PRO | Prophecy International Holdings Ltd | $0.105 | +41.89% |
| AR9 | Archtis Ltd | $0.072 | +33.33% |
| PV1 | Provaris Energy Ltd | $0.012 | +33.33% |
Top Fallers
Code | Company | Last | % Chg |
|---|---|---|---|
| CCE | Carnegie Clean Energy Ltd | $0.11 | -21.43% |
| QEM | QEM Ltd | $0.026 | -21.21% |
| SRN | Surefire Resources NL | $0.02 | -20.00% |
| E25 | Element 25 Ltd | $0.23 | -17.86% |
| CRS | Caprice Resources Ltd | $0.085 | -17.07% |
52 Week Highs
Code | Company | Last | % Chg |
|---|---|---|---|
| HTG | Harvest Technology Group Ltd | $0.019 | +90.00% |
| 14D | 1414 Degrees Ltd | $0.115 | +25.00% |
| RMI | Resource Minerals International Ltd | $0.077 | +14.93% |
| NUF | Nufarm Ltd | $2.91 | +13.67% |
| YUG | Yugo Metals Ltd | $0.10 | +11.11% |
52 Week Lows
Code | Company | Last | % Chg |
|---|---|---|---|
| SCP | Scalare Partners Holdings Ltd | $0.06 | -16.67% |
| VRX | VRX Silica Ltd | $0.041 | -16.33% |
| CHM | Chimeric Therapeutics Ltd | $0.105 | -16.00% |
| RWL | Rubicon Water Ltd | $0.08 | -13.98% |
| OSM | Osmond Resources Ltd | $0.405 | -11.96% |
Near Highs
Code | Company | Last | % Chg |
|---|---|---|---|
| WVOL | iShares MSCI World Ex Aust Minimum Volatility ETF | $44.72 | -0.27% |
| NUF | Nufarm Ltd | $2.91 | +13.67% |
| EGH | Eureka Group Holdings Ltd | $0.58 | 0.00% |
| IAGPF | Insurance Australia Group Ltd | $105.69 | +0.20% |
| VVLU | Vanguard Global Value Equity Active ETF | $80.03 | -0.58% |
Relative Strength Index (RSI) Oversold
Code | Company | Last | % Chg |
|---|---|---|---|
| ETPMPD | Global X Metal Securities Australia Ltd | $175.00 | -0.77% |
| CTT | Cettire Ltd | $0.175 | -2.78% |
| PWR | Peter Warren Automotive Holdings Ltd | $1.02 | -0.97% |
| EDV | Endeavour Group Ltd | $2.93 | -4.87% |
| CSL | CSL Ltd | $99.26 | +2.44% |
