News | Market Wraps
Evening Wrap: ASX 200 crunched as crude oil surges past US$110 a barrel, gold stocks dump nearly 10% in resources bloodbath
The S&P/ASX 200 closed 142.8 points lower, down 1.65%.

Mentioned
The S&P/ASX 200 closed 142.8 points lower, down 1.65%.
The ASX 200 plunged as escalating attacks on Middle East energy infrastructure sent oil prices sharply higher, intensifying fears of a prolonged inflation shock and further interest rate hikes.
Rising energy costs and a stronger US dollar triggered broad-based selling across commodities and growth sectors, leaving only energy and defensive names as safe-haven hideouts.
In stock specific news:
Woodside Energy Group (WDS) (+7.2%) — surged after oil prices spiked and it appointed former Anglo American CEO Mark Cutifani to its board.
Boss Energy (BOE) (-6.8%) — declined after updating uranium resources at its Gould’s Dam and Jason’s deposits.
Lynas Rare Earths (LYC) (-2.7%) — fell despite announcing first production of samarium oxide, expanding its heavy rare earths product suite.
Orora (ORA) (-2.5%) — slipped following the appointment of a new chief financial officer.
Be sure to click/scroll through for the usual reporting of the major sector and stock-specific moves, the broker responses to them, as well as all the key economic data in tonight's Evening Wrap.
Also, I have detailed technical analysis on the Nasdaq Composite and the S&P/ASX 200 in today's ChartWatch.
Let's dive in!
Today in Review
Thu 19 Mar 26, 5:00pm (AEST)
Name | Value | % Chg |
|---|---|---|
Major Indices | ||
| ASX 200 | 8,497.8 | -1.65% |
| All Ords | 8,690.7 | -1.77% |
| Small Ords | 3,317.8 | -3.30% |
| All Tech | 2,607.0 | -2.61% |
| Emerging Companies | 2,872.2 | -4.54% |
Currency | ||
| AUD/USD | 0.7039 | +0.22% |
US Futures | ||
| S&P 500 | 6,665.5 | -0.17% |
| Dow Jones | 46,475.0 | -0.13% |
| Nasdaq | 24,587.25 | -0.26% |
Name | Value | % Chg |
|---|---|---|
Sector | ||
| Energy | 11,068.5 | +5.08% |
| Consumer Staples | 12,529.9 | +0.91% |
| Utilities | 9,977.7 | +0.36% |
| Communication Services | 1,684.6 | -0.43% |
| Financials | 9,653.6 | -0.47% |
| Consumer Discretionary | 3,373.2 | -1.78% |
| Industrials | 7,886.1 | -1.95% |
| Health Care | 27,204.8 | -2.16% |
| Real Estate | 3,318.8 | -2.37% |
| Information Technology | 1,640.6 | -2.98% |
| Materials | 20,856.4 | -4.83% |
Markets
%20intraday%20chart_19%20Mar.png)
ASX 200 Session Chart
The S&P/ASX 200 (XJO) finished 142.8 points lower at 8,497.8, 1.7% from its session high and just 0.15% from its low. Reflecting the carnage at the headline level, breadth was suitably terrible, with advancers lagged decliners by 35 to 249 in the broader-based S&P/ASX 300 (XKO).
The Energy (XEJ) (+5.1%) sector surged as Brent crude spiked above US$110/bbl on escalating Middle East supply disruptions and direct attacks on key infrastructure. The rally reflects growing expectations energy supply chains will be increasingly disrupted. Woodside Energy Group (WDS) (+7.2%) led gains alongside Viva Energy (VEA) (+14.5%), while Ampol (ALD) (+4.6%) and Santos (STO) (+3.2%) also advanced.
Consumer Staples (XSJ) (+0.9%) outperformed as investors rotated into defensive sectors amid heightened macro uncertainty. Supermarkets tend to benefit from stable demand regardless of economic conditions. Woolworths Group (WOW) (+2.0%) and Coles Group (COL) (+1.5%) were key contributors.
Utilities (XUJ) (+0.4%) also edged higher as another defensive pocket of the market — regardless of rising petrol costs, interest rates, and as of today’s data — unemployment: consumers must keep the lights on! APA Group (APA) (+1.1%) was a notable mover.
Gold Sub-Index (XGD) (-9.2%) collapsed as investors liquidated recent winners to fund losses elsewhere, exacerbated by falling bullion prices driven by a stronger US dollar. Genesis Minerals (GMD) (-10.7%) and Ramelius Resources (RMS) (-10.6%) were heavily sold, while broader weakness hit Northern Star Resources (NST) (-9.5%).
Resources (XJR) (-3.3%) slumped on growing concerns that higher oil prices and interest rates will weigh on global growth and commodity demand. Base metals fell sharply overnight, reinforcing the negative sentiment. PLS Group (PLS) (-10.0%) and Sandfire Resources (SFR) (-6.0%) were among the worst performers.
Information Technology (XIJ) (-3.0%) declined as rising yields and risk aversion continued to pressure high-growth names. WiseTech Global (WTC) (-7.0%) led losses as investors rotated away from long-duration assets.
In commodities, gold fell in Asian trade, dropping 1.3% to US$4,833/oz, while silver declined 3.7% to US$74.73/oz. Copper also weakened in Asian trade, falling 2.0% to US$5.47/lb after a sharp overnight decline, reflecting rising concerns over global growth.
Lithium prices fell sharply in China trade, with benchmark lithium carbonate futures on GFEX dropping 6.3% to 142,680 CNY/t, while rare earths also declined in China trade, with NdPr prices down 6.4% to 695,000 CNY/t. The combination of the two meant there were also heavy losses in critical minerals stocks today — very little was spared the rod!
Today's best blue chip gainers
Company | Last Price | Change $ | Change % | 1mo % | 1yr % |
|---|---|---|---|---|---|
Woodside Energy (WDS) | $33.70 | +$2.26 | +7.2% | +29.9% | +47.5% |
Ampol (ALD) | $32.97 | +$1.45 | +4.6% | +14.2% | +38.1% |
Santos (STO) | $8.02 | +$0.25 | +3.2% | +21.0% | +26.1% |
Worley (WOR) | $10.47 | +$0.3 | +3.0% | -19.7% | -30.2% |
Whitehaven Coal (WHC) | $8.95 | +$0.2 | +2.3% | +6.0% | +55.1% |
Woolworths Group (WOW) | $36.74 | +$0.72 | +2.0% | +15.0% | +30.4% |
Coles Group (COL) | $21.43 | +$0.32 | +1.5% | -3.3% | +16.0% |
APA Group (APA) | $9.57 | +$0.1 | +1.1% | +3.7% | +21.8% |
Medibank Private (MPL) | $4.33 | +$0.04 | +0.9% | -9.6% | -0.7% |
Suncorp Group (SUN) | $15.70 | +$0.11 | +0.7% | +2.7% | -16.7% |
Telstra Group (TLS) | $5.30 | +$0.02 | +0.4% | +6.9% | +28.6% |
Brambles (BXB) | $22.43 | +$0.08 | +0.4% | -4.6% | +11.5% |
Insurance Australia (IAG) | $7.19 | +$0.02 | +0.3% | +5.4% | -5.4% |
Downer EDI (DOW) | $7.59 | +$0.02 | +0.3% | -1.8% | +43.2% |
QBE Insurance Group (QBE) | $20.81 | +$0.05 | +0.2% | +5.5% | -5.1% |
Telix Pharmaceuticals (TLX) | $12.41 | +$0.02 | +0.2% | +39.8% | -55.2% |
Commonwealth Bank (CBA) | $177.36 | +$0.27 | +0.2% | +0.3% | +24.2% |
Origin Energy (ORG) | $11.76 | +$0.01 | +0.1% | -1.4% | +10.9% |
ASX (ASX) | $49.79 | +$0.01 | +0.0% | -9.1% | -23.7% |
Bank of Queensland (BOQ) | $6.93 | $0 | 0% | -0.4% | +6.9% |
Today's worst blue chip losers
Company | Last Price | Change $ | Change % | 1mo % | 1yr % |
|---|---|---|---|---|---|
Genesis Minerals (GMD) | $5.51 | -$0.66 | -10.7% | -20.8% | +57.9% |
Ramelius Resources (RMS) | $3.61 | -$0.43 | -10.6% | -18.0% | +65.6% |
PLS Group (PLS) | $4.13 | -$0.46 | -10.0% | -6.6% | +106.5% |
Evolution Mining (EVN) | $12.21 | -$1.29 | -9.6% | -16.3% | +82.2% |
Northern Star Resources (NST) | $18.96 | -$1.99 | -9.5% | -32.3% | +6.8% |
Capricorn Metals (CMM) | $10.48 | -$1.08 | -9.3% | -21.8% | +30.7% |
Perseus Mining (PRU) | $4.76 | -$0.42 | -8.1% | -13.8% | +52.6% |
Wisetech Global (WTC) | $41.47 | -$3.13 | -7.0% | -13.7% | -49.9% |
Sandfire Resources (SFR) | $15.72 | -$1. | -6.0% | -17.0% | +39.7% |
Newmont Corp. (NEM) | $146.25 | -$8.97 | -5.8% | -15.9% | +93.5% |
Pinnacle Investment (PNI) | $12.72 | -$0.73 | -5.4% | -23.9% | -28.9% |
Mineral Resources (MIN) | $51.42 | -$2.88 | -5.3% | -4.3% | +115.3% |
ALS (ALQ) | $20.44 | -$1.09 | -5.1% | -14.6% | +30.3% |
IGO (IGO) | $7.01 | -$0.35 | -4.8% | -15.5% | +61.5% |
Cleanaway Waste (CWY) | $2.32 | -$0.11 | -4.5% | -4.1% | -9.0% |
Ansell (ANN) | $28.63 | -$1.13 | -3.8% | -13.1% | -14.4% |
F&P Healthcare (FPH) | $30.75 | -$1.18 | -3.7% | -1.1% | +3.9% |
Block (XYZ) | $81.84 | -$2.95 | -3.5% | +13.5% | -12.8% |
BHP Group (BHP) | $48.35 | -$1.74 | -3.5% | -7.5% | +22.2% |
ChartWatch
Nasdaq Composite Index
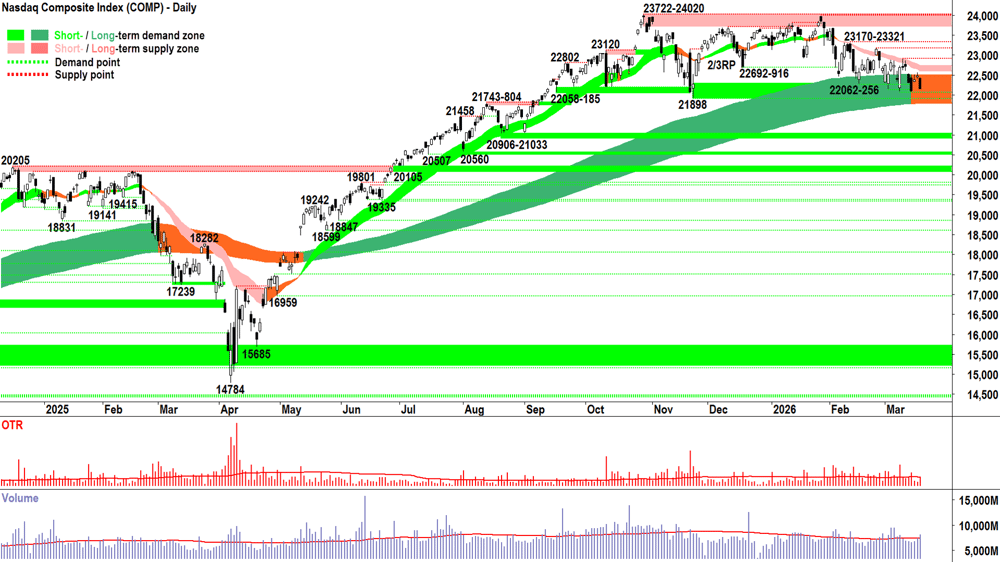
Analysis
Well, there are exactly zero surprises with regards to Wednesday’s Comp candle. In fact, I don’t think we’ve had a surprise in this Comp chart for the last 30-odd candles!
Can technical analysis be so straightforward? One could argue that if one is doing the “right” kind of technical analysis, then perhaps! 😉
There’s so little I need to add here — I’m tempted to just leave it at that = You know exactly what the above chart means. 🧐
Now, for those who aren’t long suffering readers of ChartWatch, you’re likely reading this and wondering what the fluff is this guy on about!?
Okay, rather than start at square one (which is always D vs S = P), perhaps I can invite you to watch my ChartWatch *LIVE* Webinars where I go into substantial detail on how my technical model works.
Trust me, you’ll be looking at the Comp chart and thinking: “Yep, that’s about right,” in no time!
For long suffering readers of ChartWatch, you know very well the direction we’d expect the Comp to travel MOTN (More Often Than Not) from here. 📉
The only fly I can see in the ointment, is President Orange Fly from our fairy tale of The Dark Green Caterpillar and the Brave Bull. Or is it: The Orange Caterpillar and the Bear now? 🐛🐻
If President Orange Fly decides he wants TACO for dinner… then I guess we can take our MOTN = 📉 and you know what! 🤣
(Yep, ChartWatch newbs are PROPERLY confused right now… “To the Market Index Editor, Dear Sir, your ChartWatch section in the Evening Wrap is totally incomprehensible…”
View
The Analysis part may be moot... and we're locked in as far as the Accept part is concerned... so, the only real question is whether Act now equals:
Pre-empt the move to 1/3RP; or
Stick with the prevailing 1/2RP a little longer.
I'm going with: 1/2RP — BUT I'm placing a hold on all new long-side RP, letting any existing RP roll off (i.e., either through required -R events or being stricter on what constitutes one), and continuing to favour the addition of short-side RP.
(1/2RP describes my US portfolio risk limit. RP = Risk Position — it reflects my personal allowable capital allocation limit for my investments in US stocks — how full I can fill my US "Risk Bucket", if you prefer. 1/2RP is 50%, 2/3RP is 67% and FRP is 100% 🪣).
Key levels
21898 is the critical zone of demand — a close below it implies the long term uptrend is likely under significant pressure (over!?) = ⚠️. The short term downtrend ribbon (presently 22604-22748) is the nearest critical zone of point supply, and 22907-23170-23321 aren't far beyond that.
S&P/ASX 200 (XJO)
%20chart_19%20Mar.png)
Analysis
There's no doubt about how I want to manage my portfolio risk here! 🪓
1/3RP = ✅
But, to be fair, since the ASX 200 (aka, the Old Tin Pot) made its all time high on 2-Mar, it's been pretty clear where the best +R opportunities have been coming from.
The table below shows the tally of Uptrend Watchlist and Downtrend Watchlist constituents in my daily ChartWatch ASX Scans series since the candle immediately after 2-Mar. Note how quickly the pool of +R long opportunity dwindled, and how immense the +R short opportunity pool quickly became.
Candle Date | Article Date | 📈 Watchlist | 📉 Watchlist | Ratio 📈:📉 |
|---|---|---|---|---|
3/03/2026 | 4/03/2026 | 16 | 63 | 0.3:1 |
4/03/2026 | 5/03/2026 | 10 | 72 | 0.1:1 |
5/03/2026 | 6/03/2026 | 18 | 39 | 0.5:1 |
6/03/2026 | 9/03/2026 | 31 | 28 | 1.1:1 |
9/03/2026 | 10/03/2026 | 10 | 33 | 0.3:1 |
10/03/2026 | 11/03/2026 | 14 | 26 | 0.5:1 |
11/03/2026 | 12/03/2026 | 9 | 38 | 0.2:1 |
12/03/2026 | 13/03/2026 | 6 | 76 | 0.1:1 |
13/03/2026 | 16/03/2026 | 9 | 44 | 0.2:1 |
16/03/2026 | 17/03/2026 | 5 | 40 | 0.1:1 |
17/03/2026 | 18/03/2026 | 6 | 28 | 0.2:1 |
18/03/2026 | 19/03/2026 | 6 | 20 | 0.3:1 |
ChartWatch ASX Scans Uptrends Watchlist vs Downtrends Watchlist constituents since 2-Mar ASX 200 all time high
If you read the news, it might feel like a tricky and volatile period for financial markets... but the trends have a habit of cutting through the hype to what's actually happening beneath the surface = What the Big + Smart money is doing.
Whether you cut your RP, got short, or not, the big question remains: What's the MOTN scenario for the OTP now? 🤔
You and I both know it's 📉 — but, there are some important nuances:
The 8383-8457 demand zone remains intact = we must watch the price action there closely. It's still plausible the demand tries again in that zone = white-bodied candles and or downward pointing shadows + above average volume
Below 8383-8457 — there's no way to sugar coat this — there are a few very minor points of demand to offer support and none I'd expect to play a major role... until the big one = 7169 Reciprocal Tariff TACO low ⚠️🚨.
Today's move confirms the long term trend ribbon (presently 8671-8768) is acting as a zone of dynamic supply. In combination with the short term downtrend (presently 8774-8815), falling peaks and falling troughs, and predominance of supply-side candles = START OF LONG TERM DOWNTREND. There's little reason to contemplate moving back to 1/2RP until the OTP closes above both levels.
View
1/3RP = My OTP Risk Bucket Limit 🪣 (i.e., my personal allowable capital allocation limit for my investments in Australian stocks is 33%).
Key levels
8383-8457 is the closest zone of demand (static). Beyond it — the bear market awaits...⚠️🚨 The ASX 200 must at least close back above the short- and long term uptrend ribbons (presently 8774-8815. and 8671-8768 respectively) to reclaim any semblance of demand-side control.
ChartWatch *LIVE* Webinar
ChartWatch *LIVE* Webinars – WEEKLY Wednesday's @ 12pm AEDT
Learn more about technical analysis and trend following through real case studies on ASX stocks. Australia's premier technical analyst, Carl Capolingua, shares his unique insights on stocks as requested by viewers. Ask about a company in your portfolio or anything related to trading and investing and get Carl's expert opinion.
Places are limited so >REGISTER NOW!<
Economy
Today
AUS February Employment
Change: +48,900 vs +20,300 forecast and +17,800 in January
Looks like a stonking result, but note that full-time employment fell 30,500 while part-time employment surged 79,400
Can be a sign that employers are becoming more skittish, favouring more flexible options to fill vacancies, also consumers with part-time employment rarely have the same confidence as those with full-time employment
Unemployment rate: 4.3% vs forecast unchanged at 4.1%
Perhaps the key takeaway from today's data is this stat: the number of unemployed people grew 35,000
Later this week
Friday
00:15 EUR European Central Bank Main Financing Rate Announcement & Statement of Monetary Policy (no change at 2.15% forecast)
12:00 CHN Peoples Bank of China (PBOC) Long Prime Rate Announcement
1-year Loan Prime Rate: no change at 3.0% forecast
5-year Loan Prime Rate: no change at 3.5% forecast
Latest News
Interesting Movers
Trading higher
+15.2% Viva Energy Group (VEA) – No news, general strength across the broader Energy sector today, rise is consistent with prevailing short term uptrend and long term trend is transitioning from down to up, added to ChartWatch ASX Scans Uptrends list this morning 🔎📈
+7.2% Woodside Energy Group (WDS) – No news, general strength across the broader Energy sector today, rise is consistent with prevailing short and long term uptrends, a regular in ChartWatch ASX Scans Uptrends list 🔎📈
+6.8% Yancoal Australia (YAL) – No news, general strength across the broader Energy sector today, rise is consistent with prevailing short and long term uptrends, a regular in ChartWatch ASX Scans Uptrends list 🔎📈
+5.5% Karoon Energy (KAR) – No news, general strength across the broader Energy sector today.
+5.3% New Hope Corp. (NHC) – No news, general strength across the broader Energy sector today, rise is consistent with prevailing short and long term uptrends, a regular in ChartWatch ASX Scans Uptrends list 🔎📈
+4.6% Ampol (ALD) – No news, general strength across the broader Energy sector today.
+4.5% BetaShares US EQY Strong Bear CCY H Complex ETF (BBUS) – No news (Short ASX shares ETF).
+4.2% BetaShares Crude Oil ETF (OOO) – No news (Long crude oil ETF).
+4.1% BetaShares Australian Equities Strong Bear Complex ETF (BBOZ) – No news (Short ASX shares ETF).
+4.0% Beach Energy (BPT) – No news, general strength across the broader Energy sector today.
+3.2% Santos (STO) – No news, general strength across the broader Energy sector today, rise is consistent with prevailing short and long term uptrends, a regular in ChartWatch ASX Scans Uptrends list 🔎📈
+2.3% Whitehaven Coal (WHC) – No news, general strength across the broader Energy sector today, rise is consistent with prevailing short and long term uptrends, a regular in ChartWatch ASX Scans Uptrends list 🔎📈
+2.0% Woolworths Group (WOW) – No news, general strength across the broader Consumer Staples sector today, rise is consistent with prevailing short and long term uptrends, a regular in ChartWatch ASX Scans Uptrends list 🔎📈
+1.5% Coles Group (COL) – No news, general strength across the broader Consumer Staples sector today.
+1.1% APA Group (APA) – No news, general strength across the broader Energy sector today, rise is consistent with prevailing short and long term uptrends, a regular in ChartWatch ASX Scans Uptrends list 🔎📈
Trading lower
-16.0% Brightstar Resources (BTR) – No news, general weakness across the broader Precious Metals sector today, fall is consistent with prevailing short term downtrend and long term trend is transitioning from up to down, a recent regular in ChartWatch ASX Scans Downtrends list 🔎📉
-15.5% Benz Mining Corp. (BNZ) – No news, general weakness across the broader Precious Metals sector today.
-15.5% Forrestania Resources (FRS) – No news, general weakness across the broader Precious Metals sector today.
-14.1% Ora Banda Mining (OBM) – No news, general weakness across the broader Precious Metals sector today.
-14.0% Andean Silver (ASL) – No news, general weakness across the broader Precious Metals sector today.
-12.8% Westgold Resources (WGX) – No news, general weakness across the broader Precious Metals sector today.
-12.1% Iperionx (IPX) – No news, general weakness across the broader Critical Minerals sector today.
-11.6% Unico Silver (USL) – No news, general weakness across the broader Precious Metals sector today.
-11.4% Kingsgate Consolidated (KCN) – No news, general weakness across the broader Precious Metals sector today.
-11.3% Pantoro Gold (PNR) – No news, general weakness across the broader Precious Metals sector today.
-11.2% Black Cat Syndicate (BC8) – No news, general weakness across the broader Precious Metals sector today.
-10.7% Genesis Minerals (GMD) – No news, general weakness across the broader Precious Metals sector today.
-10.6% Emerald Resources (EMR) – No news, general weakness across the broader Precious Metals sector today.
-10.6% Ramelius Resources (RMS) – No news, general weakness across the broader Precious Metals sector today.
-10.6% Vault Minerals (VAU) – No news, general weakness across the broader Precious Metals sector today.
-10.5% Alkane Resources (ALK) – No news, general weakness across the broader Precious Metals sector today.
-10.0% PLS Group (PLS) – No news, general weakness across the broader Critical Minerals sector today.
-10.0% Greatland Resources (GGP) – No news, general weakness across the broader Precious Metals sector today.
-9.8% Regis Resources (RRL) – No news, general weakness across the broader Precious Metals sector today.
-9.6% Evolution Mining (EVN) – No news, general weakness across the broader Precious Metals sector today.
-9.5% Northern Star Resources (NST) – No news, general weakness across the broader Precious Metals sector today.
Broker Moves
29Metals (29M)
Initiated at buy at Morgans; Price Target: $0.54
Advanced Innergy Holdings (AIH)
Retained at buy at Morgans; Price Target: $1.45 from $1.50
Ampol (ALD)
Retained at buy at Ord Minnett; Price Target: $35.50 from $35.00
Aristocrat Leisure (ALL)
Retained at outperform at Macquarie; Price Target: $63.00
Ansell (ANN)
Retained at neutral at Citi; Price Target: $36.00
ANZ Group Holdings (ANZ)
Retained at neutral at Macquarie; Price Target: $37.00
Arena REIT (ARF)
Retained at buy at UBS; Price Target: $3.93 from $4.09
ASX (ASX)
Retained at neutral at Macquarie; Price Target: $56.00
Boss Energy (BOE)
Retained at speculative buy at Canaccord Genuity; Price Target: $2.55 from $2.80
Brambles (BXB)
Retained at neutral at Macquarie; Price Target: $24.70
Commonwealth Bank of Australia (CBA)
Retained at underperform at Macquarie; Price Target: $124.00
Charter Hall Group (CHC)
Retained at buy at UBS; Price Target: $24.50
Centuria Industrial REIT (CIP)
Retained at buy at UBS; Price Target: $3.40
Charter Hall Long Wale REIT (CLW)
Retained at sell at UBS; Price Target: $3.35
Centuria Capital Group (CNI)
Retained at neutral at UBS; Price Target: $1.69
Centuria Office REIT (COF)
Retained at neutral at UBS; Price Target: $1.01
Computershare (CPU)
Retained at neutral at Macquarie; Price Target: $36.00
Charter Hall Retail REIT (CQR)
Retained at neutral at UBS; Price Target: $3.82
Dexus (DXS)
Retained at neutral at UBS; Price Target: $6.59
Flight Centre Travel Group (FLT)
Retained at buy at Citi; Price Target: $16.75
Fortescue (FMG)
Retained at neutral at Macquarie; Price Target: $22.00
Goodman Group (GMG)
Retained at buy at UBS; Price Target: $33.92
GPT Group (GPT)
Retained at buy at UBS; Price Target: $5.40
HomeCo Daily Needs REIT (HDN)
Retained at buy at UBS; Price Target: $1.40
HMC Capital (HMC)
Retained at buy at UBS; Price Target: $3.70
Harvey Norman Holdings (HVN)
Retained at outperform at Macquarie; Price Target: $6.60
Ingenia Communities Group (INA)
Retained at neutral at UBS; Price Target: $4.60
JB Hi-Fi (JBH)
Retained at outperform at Macquarie; Price Target: $106.00
Light & Wonder Inc. (LNW)
Retained at outperform at Macquarie; Price Target: $220.00
Mirvac Group (MGR)
Retained at neutral at UBS; Price Target: $1.97
National Australia Bank (NAB)
Retained at outperform at Macquarie; Price Target: $47.00
National Storage REIT (NSR)
Retained at neutral at UBS; Price Target: $2.80
Orthocell (OCC)
Initiated at speculative buy at Bell Potter; Price Target: $1.15
Qantas Airways (QAN)
Retained at outperform at Macquarie; Price Target: $11.60 from $12.00
QBE Insurance Group (QBE)
Retained at outperform at Macquarie; Price Target: $24.40
QPM Energy (QPM)
Retained at speculative buy at Ord Minnett; Price Target: $0.10
RAM Essential Services Property Fund (REP)
Retained at buy at UBS; Price Target: $0.65
Rural Funds Group (RFF)
Retained at neutral at UBS; Price Target: $2.10 from $2.15
Rio Tinto (RIO)
Retained at neutral at Macquarie; Price Target: $155.00
SEEK (SEK)
Retained at buy at Citi; Price Target: $26.00
SGH (SGH)
Retained at neutral at Macquarie; Price Target: $53.05
Sims (SGM)
Upgraded to outperform from hold at CLSA; Price Target: $25.00 from $22.80
Upgraded to neutral from underweight at Jarden; Price Target: $21.50 from $19.50
Retained at underperform at Jefferies; Price Target: $19.00 from $17.40
Upgraded to hold from sell at Ord Minnett; Price Target: $20.00 from $18.20
Retained at buy at UBS; Price Target: $30.00 from $26.50
Stockland (SGP)
Retained at neutral at UBS; Price Target: $4.95
Transurban Group (TCL)
Retained at neutral at Macquarie; Price Target: $14.29
The Lottery Corporation (TLC)
Retained at outperform at Macquarie; Price Target: $5.70
Telix Pharmaceuticals (TLX)
Retained at buy at UBS; Price Target: $31.00
Vicinity Centres (VCX)
Retained at buy at UBS; Price Target: $2.65
Viva Energy Group (VEA)
Retained at buy at Ord Minnett; Price Target: $2.85 from $2.50
Westpac Banking Corporation (WBC)
Retained at underperform at Macquarie; Price Target: $35.00
Woodside Energy Group (WDS)
Downgraded to neutral from positive at E&P; Price Target: $30.70 from $28.30
Retained at neutral at Macquarie; Price Target: $30.00
Wesfarmers (WES)
Retained at outperform at Macquarie; Price Target: $92.00
Block, Inc. (XYZ)
Retained at neutral at Macquarie; Price Target: $95.00
Scans
Top Gainers
Code | Company | Last | % Chg |
|---|---|---|---|
| CQT | Conneqt Health Ltd | $0.036 | +28.57% |
| RAC | Racura Oncology Ltd | $2.90 | +21.85% |
| MCM | MC Mining Ltd | $0.315 | +18.87% |
| BAS | Bass Oil Ltd | $0.081 | +17.39% |
| NGY | Nuenergy Gas Ltd | $0.043 | +16.22% |
Top Fallers
Code | Company | Last | % Chg |
|---|---|---|---|
| BEL | Bentley Capital Ltd | $0.016 | -30.44% |
| AAU | Antilles Gold Ltd | $0.013 | -23.53% |
| LPM | Lithium Plus Minerals Ltd | $0.10 | -23.08% |
| TZL | TZ Ltd | $0.03 | -23.08% |
| PR2 | Piche Resources Ltd | $0.081 | -22.86% |
52 Week Highs
Code | Company | Last | % Chg |
|---|---|---|---|
| CR9 | Corella Resources Ltd | $0.015 | +15.39% |
| VEA | Viva Energy Group Ltd | $2.43 | +15.17% |
| BRK | Brookside Energy Ltd | $0.535 | +8.08% |
| ECH | Echelon Resources Ltd | $0.415 | +7.79% |
| WDS | Woodside Energy Group Ltd | $33.70 | +7.19% |
52 Week Lows
Code | Company | Last | % Chg |
|---|---|---|---|
| TZL | TZ Ltd | $0.03 | -23.08% |
| FEG | Far East Gold Ltd | $0.11 | -18.52% |
| TD1 | Tali Digital Ltd | $0.04 | -16.67% |
| BTR | Brightstar Resources Ltd | $0.34 | -16.05% |
| IMU | Imugene Ltd | $0.15 | -14.29% |
Near Highs
Code | Company | Last | % Chg |
|---|---|---|---|
| AHL | Adrad Holdings Ltd | $1.105 | +0.45% |
| DGVA | Dimensional Global Value Trust - Active ETF | $27.10 | +0.07% |
| PL3 | Patagonia Lithium Ltd | $0.185 | +2.78% |
| TLS | Telstra Group Ltd | $5.30 | +0.38% |
| SYI | State Street SPDR MSCI Aus Select High Dividend Yield ETF | $30.81 | -0.06% |
Relative Strength Index (RSI) Oversold
Code | Company | Last | % Chg |
|---|---|---|---|
| MGX | MGX Resources Ltd | $0.36 | -7.69% |
| CSC | Capstone Copper Corp | $10.48 | -8.15% |
| AUI | Australian United Investment Company Ltd | $10.60 | -0.09% |
| HVN | Harvey Norman Holdings Ltd | $5.12 | -2.10% |
| IIND | Betashares India Quality ETF | $9.50 | -0.84% |
