News | Market Wraps
Evening Wrap: ASX 200 rebounds as oil dips on Trump de-escalation, MIN +6% on lithium rally vs WDS -4% on energy rout
The S&P/ASX 200 closed 93.6 points higher, up 1.09%.

Mentioned
The S&P/ASX 200 closed 93.6 points higher, up 1.09%.
The ASX 200 recouped some of yesterday’s losses to close at 8,692.6, as President Trump’s comments regarding the conflict in the Middle East triggered a violent reversal in oil. This lifted sentiment for risk assets like stocks, with 9 out of the 11 major ASX sectors up today.
In stock news:
Telix Pharmaceuticals (TLX) (+7.8%) — surged after reporting positive early-stage Phase 3 results for TLX591 in advanced prostate cancer
Fortescue (FMG) (+1.1%) — edged higher after completing its takeover of Alta Copper and securing full ownership of the Cañariaco copper project in Peru
Orica (ORI) (-3.4%) — fell after announcing a $100 million cost reduction program over the next three years
Pantoro (PNR) (-22.5%) — slumped after downgrading its FY26 production guidance
Be sure to click/scroll through for the usual reporting of the major sector and stock-specific moves, the broker responses to them, as well as all the key economic data in tonight's Evening Wrap.
Also, I have detailed technical analysis on the Nasdaq Composite and the S&P/ASX 200 in today's ChartWatch.
Let's dive in!
Today in Review
Tue 10 Mar 26, 4:58pm (AEST)
Name | Value | % Chg |
|---|---|---|
Major Indices | ||
| ASX 200 | 8,692.6 | +1.09% |
| All Ords | 8,924.2 | +1.14% |
| Small Ords | 3,508.6 | +1.31% |
| All Tech | 2,843.6 | +1.90% |
| Emerging Companies | 3,155.4 | +2.83% |
Currency | ||
| AUD/USD | 0.7062 | -0.19% |
US Futures | ||
| S&P 500 | 6,787.5 | -0.20% |
| Dow Jones | 47,670.0 | -0.21% |
| Nasdaq | 24,949.25 | -0.17% |
Name | Value | % Chg |
|---|---|---|
Sector | ||
| Information Technology | 1,786.9 | +1.94% |
| Materials | 22,476.8 | +1.87% |
| Health Care | 29,082.2 | +1.76% |
| Financials | 9,557.0 | +1.31% |
| Consumer Discretionary | 3,505.1 | +1.27% |
| Real Estate | 3,464.5 | +0.71% |
| Industrials | 8,106.7 | +0.67% |
| Communication Services | 1,701.4 | +0.14% |
| Utilities | 9,887.7 | +0.05% |
| Consumer Staples | 12,266.0 | -0.31% |
| Energy | 10,169.2 | -2.91% |
Markets
ASX 200 Session Chart
The S&P/ASX 200 (XJO) finished 93.6 points higher at 8,692.6, 1.09% from its session low and 0.67% from its session high. In the broader-based S&P/ASX 300 (XKO), advancers beat decliners by a robust 210 to 66.
Information Technology (XIJ) (+1.9%) was the best-performing sector as a broad rebound in tech stocks lifted the complex, led by Life360 (360) (+10.3%) and Technology One (TNE) (+4.2%).
Resources (XJR) (+1.2%) snapped a five-day losing streak as bargain hunters returned to beaten-down miners, with BHP Group (BHP) (+2.6%) and Fortescue (FMG) (+1.1%) leading the gains.
Energy (XEJ) (-3.4%) was the worst performer as crude oil gave back almost all of Monday’s war-driven surge. Yesterday’s top gainers reversed lower, led by Woodside Energy (WDS) (-3.7%) and Santos (STO) (-3.5%).
In commodities, spot gold was 0.7% lower at US$5,176/oz and silver rose 2.1% to US$88.80/oz in Asian trade, lifting precious metals names like Northern Star Resources (NST) (+2.5%), Unico Silver (USL) (+8.3%) and Silver Mines (SVL) (+4.8%).
The benchmark lithium carbonate futures contract logged its second straight day of solid gains, today adding 4.1% to 163,000 CNY/mt. This lifted the sector broadly, with Mineral Resources (MIN) (+5.7%) and PLS Group (PLS) (+5.2%) top performers.
Fund flows: CTRL+Z
What's there to say about fund flows today?
Everything just printed the equal and opposite of yesterday.
To be fair, we did just witness one of the GREAT about-faces in markets last night, brought on by you-know-who! Is that the last of the volatility and uncertainty? Perhaps...
Either way, we are indeed in a choppy market! And in choppy markets, trend traders get chopped up! 🪓
Today's best blue chip gainers
Company | Last Price | Change $ | Change % | 1mo % | 1yr % |
|---|---|---|---|---|---|
Life360 (360) | $22.51 | +$2.11 | +10.3% | -12.5% | -2.1% |
Telix Pharmaceuticals (TLX) | $11.00 | +$0.8 | +7.8% | +11.6% | -60.3% |
Pro Medicus (PME) | $139.69 | +$8.19 | +6.2% | -13.3% | -45.4% |
Sandfire Resources (SFR) | $16.60 | +$0.91 | +5.8% | -14.3% | +49.0% |
Mineral Resources (MIN) | $57.45 | +$3.14 | +5.8% | +10.2% | +163.8% |
PLS Group (PLS) | $4.67 | +$0.23 | +5.2% | +12.0% | +155.2% |
Technology One (TNE) | $27.44 | +$1.12 | +4.3% | +21.3% | -4.7% |
Genesis Minerals (GMD) | $6.77 | +$0.26 | +4.0% | -1.5% | +112.2% |
IGO (IGO) | $7.68 | +$0.24 | +3.2% | -6.7% | +100.0% |
Lynas Rare Earths (LYC) | $17.72 | +$0.54 | +3.1% | +19.6% | +146.5% |
Suncorp Group (SUN) | $14.49 | +$0.39 | +2.8% | -13.5% | -24.4% |
Capricorn Metals (CMM) | $13.20 | +$0.34 | +2.6% | -2.8% | +72.1% |
Northern Star Resources (NST) | $25.96 | +$0.65 | +2.6% | -6.3% | +50.3% |
Insurance Australia Group (IAG) | $6.63 | +$0.16 | +2.5% | -14.6% | -14.9% |
Ramelius Resources (RMS) | $4.24 | +$0.1 | +2.4% | -7.4% | +52.0% |
JB HI-FI (JBH) | $79.91 | +$1.8 | +2.3% | -0.6% | -11.8% |
BHP Group (BHP) | $51.23 | +$1.13 | +2.3% | +3.0% | +30.7% |
Downer EDI (DOW) | $7.55 | +$0.16 | +2.2% | -4.2% | +40.9% |
Perseus Mining (PRU) | $5.50 | +$0.11 | +2.0% | -2.5% | +79.2% |
Newmont Corp. (NEM) | $163.00 | +$3.25 | +2.0% | -1.2% | +134.1% |
Today's worst blue chip losers
Company | Last Price | Change $ | Change % | 1mo % | 1yr % |
|---|---|---|---|---|---|
Ampol (ALD) | $29.93 | -$1.42 | -4.5% | +1.5% | +22.3% |
Woodside Energy Group (WDS) | $30.18 | -$1.18 | -3.8% | +16.8% | +31.7% |
Seek (SEK) | $15.83 | -$0.58 | -3.5% | -12.4% | -31.6% |
Santos (STO) | $7.37 | -$0.27 | -3.5% | +6.0% | +20.8% |
Orica (ORI) | $20.92 | -$0.74 | -3.4% | -19.6% | +20.9% |
Coles Group (COL) | $20.49 | -$0.6 | -2.8% | -6.0% | +8.5% |
Medibank Private (MPL) | $4.10 | -$0.08 | -1.9% | -10.7% | -4.4% |
Lendlease Group (LLC) | $3.66 | -$0.05 | -1.3% | -19.2% | -39.2% |
Whitehaven Coal (WHC) | $8.74 | -$0.11 | -1.2% | -4.6% | +48.1% |
Amcor PLC (AMC) | $59.78 | -$0.74 | -1.2% | -13.3% | -26.4% |
ASX (ASX) | $49.99 | -$0.59 | -1.2% | -10.8% | -24.6% |
Worley (WOR) | $10.40 | -$0.12 | -1.1% | -20.9% | -27.9% |
Challenger (CGF) | $7.52 | -$0.08 | -1.1% | -12.6% | +36.7% |
Netwealth Group (NWL) | $23.52 | -$0.21 | -0.9% | -0.6% | -15.7% |
Dyno Nobel (DNL) | $3.04 | -$0.02 | -0.7% | -10.1% | +11.8% |
Atlas Arteria (ALX) | $4.65 | -$0.03 | -0.6% | -1.5% | -6.1% |
QBE Insurance Group (QBE) | $20.49 | -$0.12 | -0.6% | +0.5% | -2.6% |
Nextdc (NXT) | $12.75 | -$0.06 | -0.5% | -4.4% | -3.4% |
Vicinity Centres (VCX) | $2.28 | -$0.01 | -0.4% | -9.2% | +7.0% |
South32 (S32) | $4.26 | -$0.01 | -0.2% | -6.4% | +18.0% |
ChartWatch
Nasdaq Composite Index
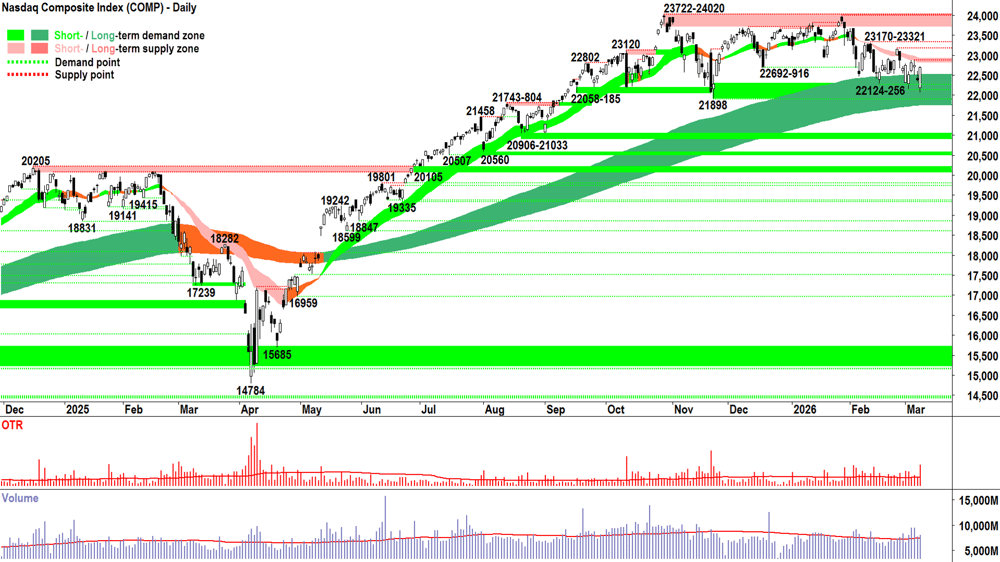
Analysis
Once upon a time, there was an imaginary dark green caterpillar 🐛
It made friends with a brave bull 🐂
And they lived happily ever after.
Quite a fairy tale!
This Nasdaq bull market is a bit of a fairy tale, because I doubt may of us would have pegged last night’s candle as the MOTN (More Often Than Not) outcome based on the 500-odd point decline futures were flagging at the time of my last update.
But, to rehash (and hopefully the magnitude and reliability of this statement is beginning to sink in!!!):
Just like it’s in the nature of olives to have pits, it’s in the nature of bull markets to rally!
For first-time readers of ChartWatch in the Evening Wrap, no doubt you are already drafting an email to our editors: “Dear Sir, this person’s so called ‘analysis’, which consisted of caterpillars, bulls, and olives, made no sense at all 😠”
Can I offer first-time readers this fact:
12 out of the last 15 candles — which have all appeared at or in the dark green long term uptrend ribbon — have white bodies. White-bodied candles are usually, or MOTN if you prefer, associated with pervasive programmed buy orders that are creating an environment of excess demand.
And this observation:
The dark green long term uptrend ribbon is an imaginary construct that has no real fundamental basis to exist. For some reason that neither I, nor any long suffering reader of ChartWatch can understand, it tends to act as a dynamic zone of demand, magically supporting price in a long term uptrend. Well, MOTN it does…
Also…
That’s a decent candle.
It’s a very decent size.
It closed very close to its high.
It happened in a very logical spot (i.e., the static demand zone of 21898-22256 plus the dynamic demand zone of the long term uptrend ribbon — presently 21754-22512).
It didn’t seem to care about the dynamic supply of the short term downtrend ribbon and the last point of supply of 22877 (i.e., the peak of 5-Mar).
So, save for yesterday evening’s threat of excess supply — all we can actually see on the Comp’s chart is excess demand.
Which brings us to the million dollar question that we as technical analsts must answer after each and every candle:
What’s the MOTN outcome here? 🤔
We could be just one more big white candle away from doing some serious damage to probably the vast majority of big fund managers’ predicted story-ending — i.e., the assumption that the brave bull was soon to perish!
I put to you that a strong resumption of upside momentum would very likely:
Put billions of dollars of anticipatory shorts — logically expecting a break of support — absolutely under the pump. Imagine how these shorts are feeling right now!!! They will be you-know-what-ing themselves! 🤯 Always remember: shorts that want to cover back = latent demand. In this case, super-motivated latent demand.
Disappoint billions of dollars of ‘waiting to buy the dip’ buyers. They’re reconsidering if they’ll ever get a dip = increasingly motivated latent demand.
Strike absolute fear into the hearts of fund managers who are strategically underweight the index — if the index somehow miraculously rallies from here… they’re going to look very stupid at the end of this quarter… um… which is ONLY 15 TRADING DAYS AWAY = increasingly motivated latent demand.
Now think about supply.
If, like us, supply is kinda starting to believe there’s really no major rush to get out… if they start to believe… "Well… why don’t I just hang on here and see how this plays out? I know where my exit point is (i.e., below 21898 / the long term uptrend ribbon) — that’s not a huge amount of downside… indeed, this is a very decent asymmetrical risk-vs-reward bet…"
The balance between demand and supply could swing dramatically and see us punch to new highs in just a few more candles like Monday’s. 🚀
And that would be fun to watch! 😁
But there’s a fly in the Dark Green Caterpillar’s and Brave Bull’s ointment. 🪰
A great big, slightly orange fly… who insists on being the main character in this story — and, ideally, the main character in every other book on the bookshelf too!
The Big Orange Fly can wave his magic word-wand and wreak havoc on even the most sound technical analysis that any caterpillar — or any bull — can muster. 😉

View
Tell me how 1/2RP for my US portfolio risk limit is not spot-on! (RP = Risk Position — it reflects my personal allowable capital allocation limit for my investments in US stocks. So 1/2RP is 50%, 2/3RP is 67% and FRP is 100% 🪣).
Key levels
21898-22256 is the critical zone of demand — a close below it implies the supply-side is in control of the Comp's short term price, and that the long term uptrend ribbon (presently 21754-22512) is likely under significant pressure = ⚠️. The short term downtrend ribbon (presently 22819-22931) is the nearest critical zone of point supply, and then the three static points of supply: 22877, 23170 & 23321 are not far beyond that.
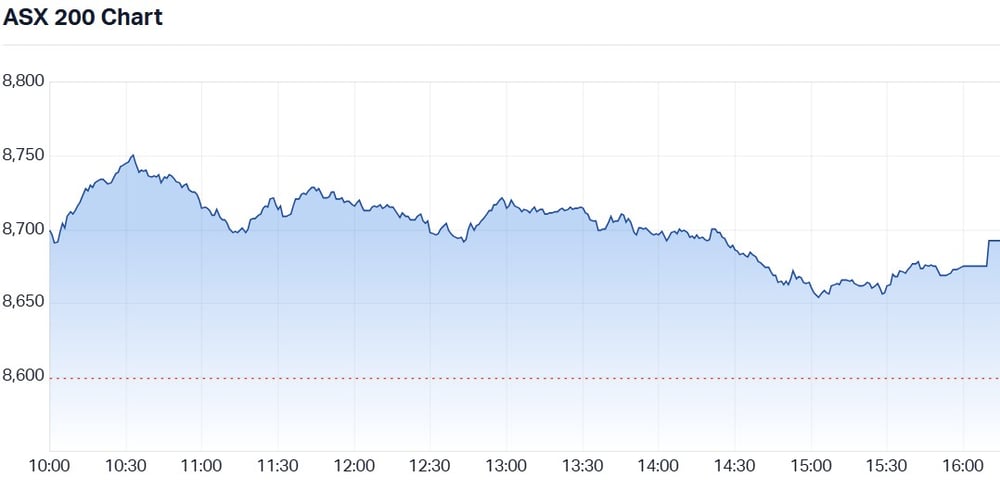
S&P/ASX 200 (XJO)
%20chart_10%20Mar.png)
Analysis
Orange is not the new green, but it does appear to be the theme of today's analysis!
Nope, orange is a sad, sad time for trend traders... 😭
Yet here we are: double orange 🟧🟧!
Orange, of course, is the colour of neutrality, of equilibrium between demand and supply.
The ASX 200's, a.k.a. the Old Tin Pot's chart now shows short term equilibrium and long term equilibrium.
And what do you make of today’s candle? 🤔
Most times, plus-93.6 points is a good outcome for the OTP.
But I put to you: when considered against the plunge from 9201 to 8457 — yesterday’s downward pointing shadow + today’s white body ≠ confident demand-side engagement.
It’s more dead cat 🙀 than soaring phoenix 🐦🔥
Today’s upward pointing shadow, if anything, suggest the long term trend ribbon may have flipped from a zone of dynamic demand to a zone of dynamic supply.
Let’s hope not, because the long term consequences of such a switch would be catastrophic = ⚠️.
You know how I operate: pare back risk when the trends are unclear (🟧🟧 remember!), and wait for confirmation.
But if you can see an emphatic buy signal in today’s price action — then by all means go for it! 🚂
View
1/2RP, logically, is still the right place to be — but bloody hell! 🤦 (i.e., my personal allowable capital allocation limit for my investments in Australian stocks is 50%)
Key levels
8383-8457 is the closest zone of demand (static). Beyond it — the bear market awaits...⚠️🚨 The ASX 200 must at least close back above the long term uptrend ribbon (presently 8674 - 8783) to reclaim any semblance of demand-side control.
ChartWatch *LIVE* Webinar
ChartWatch *LIVE* Webinars – WEEKLY Wednesday's @ 12pm AEDT
Learn more about technical analysis and trend following through real case studies on ASX stocks. Australia's premier technical analyst, Carl Capolingua, shares his unique insights on stocks as requested by viewers. Ask about a company in your portfolio or anything related to trading and investing and get Carl's expert opinion.
Places are limited so >REGISTER NOW!<
Economy
Today
10:30 AUS Westpac Consumer Sentiment
Result: +1.2% m/m actual vs -2.6% m/m previous
11:30 AUS NAB Business Confidence
Result: -1 m/m actual vs 4 m/m previous
Australian business activity remained steady in February, but confidence turned negative as higher interest rates and renewed cost pressures weighed on sentiment.
Later this week
Wednesday
23:30 USA Core CPI m/m (+0.2% m/m forecast vs +0.3% m/m previous)
Thursday
11:00 AUS MI Inflation Expectations (+5% m/m previous)
23:30 USA Unemployment Claims (+216k w/w forecast vs +213k w/w previous)
Friday
00:30 GB GDP m/m (+0.2% p.a. forecast vs +0.1% p.a. previous)
11:30 USA Core PCE Price Index m/m (+0.4% m/m forecast vs -0.1% m/m previous)
Saturday
01:00 USA JOLTS Job Openings (+6.84 million m/m forecast vs +6.54 million m/m previous)
Latest News
Interesting Movers
Trading higher
+10.3% Life360 (360) – No news, general strength across the broader Information Technology sector today.
+9.3% Lindian Resources (LIN) – No news, rise is consistent with prevailing short and long term uptrends, a regular in ChartWatch ASX Scans Uptrends list 🔎📈
+9.1% 4DMedical (4DX) – Update - S&P DJI March 2026 Rebalance of the All Ordinaries, general strength across the broader Information Technology sector today, rise is consistent with prevailing short and long term uptrends, a regular in ChartWatch ASX Scans Uptrends list 🔎📈
+8.9% Elevra Lithium (ELV) – No news, general strength across the broader Lithium sector today.
+8.7% Electro Optic Systems (EOS) – No news, general strength across the broader Defence sector today, rise is consistent with prevailing short and long term uptrends, a regular in ChartWatch ASX Scans Uptrends list 🔎📈
+8.4% Unico Silver (USL) – Update - S&P DJI March 2026 Rebalance of the All Ordinaries, general strength across the broader Silver sector today.
+8.4% Droneshield (DRO) – No news, general strength across the broader Defence sector today, rise is consistent with prevailing short and long term uptrends, a recent regular in ChartWatch ASX Scans Uptrends list 🔎📈
+7.8% Telix Pharmaceuticals (TLX) – ProstACT Global Phase 3 (Part 1) Results Presentation, general strength across the broader HealthCare sector today.
+6.9% iShares MSCI South Korea ETF (IKO) – No news, (South Korean stocks rallied sharply today).
+6.9% Andean Silver (ASL) – Becoming a substantial holder (UBS 5.4%), general strength across the broader Silver sector today.
+6.8% Core Lithium (CXO) – Update - S&P DJI March 2026 Rebalance of the All Ordinaries, general strength across the broader Lithium sector today.
+6.8% Boab Metals (BML) – Update - S&P DJI March 2026 Rebalance of the All Ordinaries, general strength across the broader Silver sector today.
+6.7% Paladin Energy (PDN) – No news, general strength across the broader Uranium sector today.
+6.2% Pro Medicus (PME) – No news, general strength across the broader HealthCare sector today.
+6.1% Nexgen Energy (NXG) – No news, general strength across the broader Uranium sector today.
+6.0% Resolute Mining (RSG) – No news, general strength across the broader Gold sector today.
+5.9% BetaShares Geared US Eqty CCY Hedged Complex ETF (GGUS) – (US stocks ETF).
+5.8% Mineral Resources (MIN) – No news, general strength across the broader Lithium sector today.
+5.7% BetaShares Global Uranium ETF (URNM) – No news, general strength across the broader Uranium sector today, (Uranium stocks ETF).
+5.3% Liontown (LTR) – Becoming a substantial holder news, general strength across the broader Lithium sector today.
+5.2% PLS Group (PLS) – No news, general strength across the broader Lithium sector today.
Trading lower
-22.5% (OOO) – No news (crude oil prices pulled back overnight).
-22.5% Pantoro Gold (PNR) – Development of Third Underground Mine at Norseman.
-8.1% BetaShares Energy ETF (FUEL) – No news (energy stocks ETF).
-8.0% Helia Group (HLI) – Change in substantial holding from MQG (Macquarie Group 7.2% from 8.5%).
-6.8% Karoon Energy (KAR) – No news, general weakness across the broader Energy sector today.
-5.4% BetaShares US EQY Strong Bear CCY H Complex ETF (BBUS) – No news (short US stocks ETF).
-4.5% Ampol (ALD) – No news, general weakness across the broader Energy sector today.
-4.3% Beach Energy (BPT) – Ceasing to be a substantial holder (Citibank last update was 5.6%), general weakness across the broader Energy sector today.
-3.8% Woodside Energy Group (WDS) – No news, general weakness across the broader Energy sector today.
-3.5% Santos (STO) – No news, general weakness across the broader Energy sector today.
Broker Moves
Alkane Resources (ALK)
Retained at buy at Ord Minnett; Price Target: $2.10 from $2.05
Ansell (ANN)
Retained at equal-weight at Morgan Stanley; Price Target: $34.40
ANZ Group Holdings (ANZ)
Retained at neutral at Macquarie; Price Target: $37.00
AUB Group (AUB)
Retained at overweight at Morgan Stanley; Price Target: $31.15
Bendigo and Adelaide Bank (BEN)
Retained at underperform at Macquarie; Price Target: $10.00
BHP Group (BHP)
Retained at overweight at Morgan Stanley; Price Target: $56.00
Bank of Queensland (BOQ)
Retained at neutral at Macquarie; Price Target: $6.50
CAR Group (CAR)
Retained at neutral at Macquarie; Price Target: $28.50
Retained at overweight at Morgan Stanley; Price Target: $38.00
Commonwealth Bank of Australia (CBA)
Retained at outperform at Macquarie; Price Target: $124.00
Challenger (CGF)
Retained at buy at Citi; Price Target: $10.00
Cochlear (COH)
Retained at underweight at Morgan Stanley; Price Target: $194.00 from $216.00
Retained at buy at UBS; Price Target: $302.00
CSL (CSL)
Retained at overweight at Morgan Stanley; Price Target: $215.00
Dicker Data (DDR)
Retained at equal-weight at Morgan Stanley; Price Target: $10.30
Dyno Nobel (DNL)
Retained at buy at Citi; Price Target: $4.00
Retained at hold at Ord Minnett; Price Target: $3.20 from $3.45
Data3 (DTL)
Retained at overweight at Morgan Stanley; Price Target: $9.20
FINEOS Corporation Holdings PLC (FCL)
Retained at outperform at Macquarie; Price Target: $3.50
Fortescue (FMG)
Retained at underweight at Morgan Stanley; Price Target: $18.35
Hansen Technologies (HSN)
Retained at overweight at Morgan Stanley; Price Target: $6.00
IGO (IGO)
Retained at underweight at Morgan Stanley; Price Target: $7.50
Iluka Resources (ILU)
Retained at overweight at Morgan Stanley; Price Target: $6.70
Judo Capital Holdings (JDO)
Retained at outperform at Macquarie; Price Target: $2.05
Jumbo Interactive (JIN)
Retained at neutral at Citi; Price Target: $9.90 from $11.80
Metals X (MLX)
Retained at buy at Canaccord Genuity; Price Target: $1.50 from $1.35
Megaport (MP1)
Retained at equal-weight at Morgan Stanley; Price Target: $10.00
National Australia Bank (NAB)
Retained at underperform at Macquarie; Price Target: $47.00
Nickel Industries (NIC)
Retained at buy at Bell Potter; Price Target: $1.45
Objective Corporation (OCL)
Retained at overweight at Morgan Stanley; Price Target: $21.30
Orica (ORI)
Retained at outperform at Macquarie; Price Target: $25.95
PLS Group (PLS)
Retained at overweight at Morgan Stanley; Price Target: $5.30
Pro Medicus (PME)
Retained at overweight at Morgan Stanley; Price Target: $275.00
REA Group (REA)
Retained at neutral at Macquarie; Price Target: $200.00
Retained at overweight at Morgan Stanley; Price Target: $250.00
Reece (REH)
Upgraded to overweight from neutral at Jarden; Price Target: $16.40 from $13.90
Ramsay Health Care (RHC)
Retained at underweight at Morgan Stanley; Price Target: $35.60 from $35.70
Steadfast Group (SDF)
Retained at overweight at Morgan Stanley; Price Target: $5.59
SEEK (SEK)
Retained at overweight at Morgan Stanley; Price Target: $28.00
Sonic Healthcare (SHL)
Retained at equal-weight at Morgan Stanley; Price Target: $24.20
Telstra Group (TLS)
Retained at overweight at Morgan Stanley; Price Target: $5.40
Telix Pharmaceuticals (TLX)
Retained at overweight at Morgan Stanley; Price Target: $24.60
Tesoro Gold (TSO)
Initiated at speculative buy at Euroz Hartleys; Price Target: $2.09
Westpac Banking Corporation (WBC)
Retained at underperform at Macquarie; Price Target: $35.00
Wisetech Global (WTC)
Retained at overweight at Morgan Stanley; Price Target: $100.00
Scans
Top Gainers
Code | Company | Last | % Chg |
|---|---|---|---|
| CC9 | Chariot Resources Ltd | $0.125 | +30.21% |
| MEL | Metgasco Ltd | $0.018 | +28.57% |
| B4P | Beforepay Group Ltd | $1.645 | +27.03% |
| IOD | Iodm Ltd | $0.17 | +25.93% |
| APL | Associate Global Partners Ltd | $0.25 | +25.00% |
Top Fallers
Code | Company | Last | % Chg |
|---|---|---|---|
| 88E | 88 Energy Ltd | $0.029 | -29.27% |
| OOO | Betashares Crude Oil INDEX Currncy HDG Complex ETF | $7.88 | -22.52% |
| PNR | Pantoro Gold Ltd | $3.79 | -22.50% |
| T92 | Terra Critical Minerals Ltd | $0.11 | -21.43% |
| PTL | Prestal Holdings Ltd | $0.031 | -20.51% |
52 Week Highs
Code | Company | Last | % Chg |
|---|---|---|---|
| APL | Associate Global Partners Ltd | $0.25 | +25.00% |
| ZMI | ZINC of Ireland NL | $0.02 | +25.00% |
| SKY | SKY Metals Ltd | $0.19 | +18.75% |
| PSL | Paterson Resources Ltd | $0.06 | +11.11% |
| LIN | Lindian Resources Ltd | $0.765 | +9.29% |
52 Week Lows
Code | Company | Last | % Chg |
|---|---|---|---|
| PTL | Prestal Holdings Ltd | $0.031 | -20.51% |
| NTI | Neurotech International Ltd | $0.011 | -15.39% |
| NRX | Noronex Ltd | $0.012 | -14.29% |
| VTX | Vertex Minerals Ltd | $0.14 | -9.68% |
| TZL | TZ Ltd | $0.039 | -9.30% |
Near Highs
Code | Company | Last | % Chg |
|---|---|---|---|
| HGBL | Betashares Global Shares Currency Hedged ETF | $77.16 | +2.57% |
| MQGPG | Macquarie Group Ltd | $103.10 | 0.00% |
| DGVA | Dimensional Global Value Trust - Active ETF | $27.12 | +0.97% |
| AZJ | Aurizon Holdings Ltd | $3.98 | +1.27% |
| DCOR | Daintree Core Income Active ETF | $51.82 | +0.10% |
Relative Strength Index (RSI) Oversold
Code | Company | Last | % Chg |
|---|---|---|---|
| SGP | Stockland | $4.74 | 0.00% |
| CGFPC | Challenger Ltd | $100.01 | -0.09% |
| WES | Wesfarmers Ltd | $75.46 | +1.47% |
| HVN | Harvey Norman Holdings Ltd | $5.41 | +0.93% |
| AMP | AMP Ltd | $1.20 | 0.00% |
