
How does the ASX 200 perform after an oil price shock?
Oil just posted its second-largest weekly gain in 40 years. History says investors shouldn't panic but the next few months won't be smooth.


Source: iStock
KEY POINTS
- Since 1990, the ASX 200 has been higher 24 months after every major one-week WTI crude price spike, though near-term volatility is the norm
- Geopolitically driven spikes have historically seen oil prices lower after six months, while recessionary spikes saw a brief pullback before a medium-term recovery
- With the ASX 200 trading at 18.6x going into the conflict and Goldman Sachs warning 18% of global supply has been disrupted, the upside case for equities depends heavily on oil not pushing to demand-destruction levels
Oil prices surged 35% last week to US$91 a barrel, marking the second largest weekly gain in over 40 years. For investors wondering what comes next, history offers a somewhat reassuring answer but not before some near-term volatility.
Since 1990, there have been six instances where WTI crude rallied 25% or more in a single week. Each was driven by a distinct catalyst, and produced a different market reaction in the months that followed. Below, we examine what triggered each spike, how oil prices performed afterwards, and what the ASX 200 did next.
What triggered each spike
July 1990: Iraq's invasion of Kuwait ignited fears of a prolonged Middle East war and a major supply disruption.
December 2008: Crude staged a technical rebound after collapsing from US$147 to below US$35 during the GFC, driven by short-covering and early bets on a demand recovery.
January 2009: OPEC announced what was then its largest-ever coordinated production cut, at 4.2 million barrels per day.
March 2020: Emergency OPEC+ production deals were struck after Saudi Arabia's abrupt exit from the agreement triggered a price war with Russia, coinciding with the pandemic demand collapse.
May 2020: OPEC+ implemented historic production cuts following the April price war that briefly pushed WTI into negative territory.
February 2022: Russia's invasion of Ukraine sent energy markets into shock.
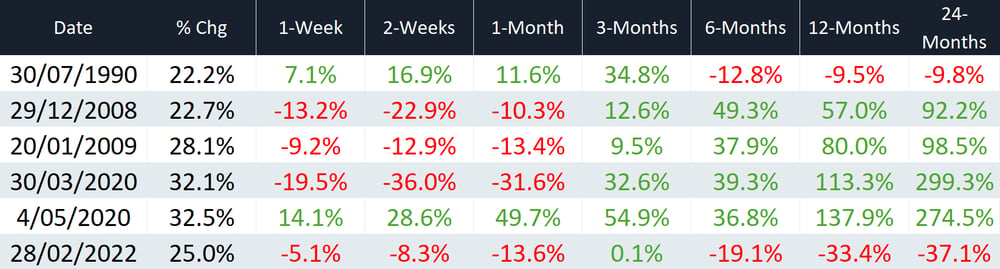
The table below shows WTI forward returns at various intervals following each major one-week spike.
WTI forward returns after a major one-week spike (Source: Author's own calculations)
Despite the tiny dataset, there is a potential pattern. The 1990 and 2022 episodes were geopolitical in origin and near-term performance was volatile in both cases, but prices were lower after six months. When the spike was recessionary in origin, prices staged a technical jump before pulling back, then recovered substantially over the medium term.
What the ASX 200 did next
ASX 200 forward returns following major crude price spikes are overwhelmingly positive. Short-term returns are relatively constructive, and the market was higher 24 months after every single instance.
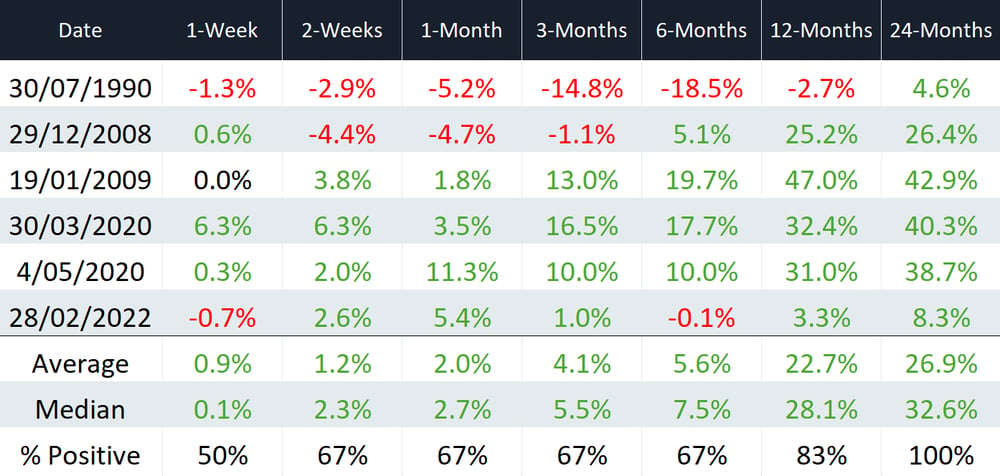
S&P/ASX 200 forward price returns after a major one-week WTI crude price spike (Source: Author's own calculations)
Morgan Stanley's analysis of geopolitical shocks more broadly supports the same conclusion. The S&P 500 has risen an average of 2%, 6%, and 8% after one, six, and twelve months following such events, though the historical relationship breaks down when oil prices surge more than 75-100% year-over-year, the threshold at which energy costs begin threatening the broader business cycle.
Is this time different?
As the old adage goes, history doesn’t repeat itself, but it often rhymes.
President Trump has said the war against Iran "is very complete," but Defence Secretary Pete Hegseth described the US campaign as "just the beginning," while Iran's Revolutionary Guard said they will be the ones to "determine the end of the war." The situation remains highly uncertain.
Last week's rally brought crude oil to five standard deviations above its 50-day moving average, according to Bespoke Investment Group, noting that "statistically speaking, that occurs once every 9,500 years, so the last time would have been about 6,000 years before Moses parted the Red Sea. Imagine what that did to shipping in the area."
After such a move, prices became even more volatile on Monday, rallying as much as 30.9% to US$119 intraday before closing 6.7% lower at US$85 a barrel. This marked the largest intraday reversal since the 1980s, excluding the 20-21 March 2020 bounce when prices turned negative.
From a supply perspective, Goldman Sachs warned that with shipments through the Strait of Hormuz down 90%, roughly 18% of global oil supply has been removed from the market. Prices may need to rise to demand-destruction levels faster than historical models suggest. Middle East pipeline redirection is currently only 25% effective, with most shippers in a wait-and-see mode.
On the policy side, G7 finance ministers are in emergency talks with the IEA over a coordinated strategic petroleum reserve release. Figures being discussed range from 300 to 400 million barrels, up to 30% of the IEA's 1.2 billion-barrel emergency stockpile, which would represent one of the most significant supply-side interventions in the oil market's history.
Ultimately, everything hinges on where oil prices go from here. Markets are entering this period on solid footing after a strong reporting season, with UBS describing it as the best February results season since 2019 and flagging confidence in 6-7% earnings growth for the ASX 200 in FY26. With the index trading at 18.6x heading into the conflict, however, there is limited buffer if the earnings outlook deteriorates.
