News | Market Wraps
Evening Wrap: ASX 200 slides as Friday the 13th spooks Tech, Healthcare – COH -18.9%, WTC -10.4%
The S&P/ASX 200 closed 125.9 points lower, down -1.39%.

Mentioned
The S&P/ASX 200 closed 125.9 points lower, down -1.39%.
The ASX 200 fell hard today, with 9 of the 11 major sectors down. Defensives outperformed, while tech and reporting season losers were aggressively sold.
Utilities (XUJ) (+3.3%) led as defensives caught a bid, with Origin Energy (ORG) (+4.5%) among the top movers.
Information Technology (XIJ) (-5.0%) extended its slide, led by WiseTech Global (WTC) (-9.8%) and SiteMinder (-9.3%) as the software exodus rolled on.
Webjet Group (WJL) (-25.8%) and Austal (ASB) (-22.3%) were the biggest losers in the ASX 200. WJL tumbled after they announced that Helloworld and BGH had walked away from a potential takeover of the company. Austal sank after flagging a US$17.1m overstatement and cutting FY26 EBIT guidance to about $110m.
Nick Scali (NCK) (-21.8%) and Cochlear (-18.7%) were also marked down after disappointing results.
Precious metals rebounded from heavy falls overnight, but with gold up 1.2% (vs 3% overnight fall) and spot silver up 1.0% (vs 10% overnight fall), appetite for local precious metals stocks was scant. Evolution Mining (EVN) (-3.6%) and Unico Silver (USL) (-8.2%) still fell.
Be sure to click/scroll through for the usual reporting of the major sector and stock-specific moves, the broker responses to them, as well as all the key economic data in tonight's Evening Wrap.
Also, I have detailed technical analysis on the Nasdaq Composite and the S&P/ASX 200 in today's ChartWatch.
Let's dive in!
Today in Review
Fri 13 Feb 26, 5:12pm (AEST)
Name | Value | % Chg |
|---|---|---|
Major Indices | ||
| ASX 200 | 8,917.6 | -1.39% |
| All Ords | 9,138.8 | -1.54% |
| Small Ords | 3,612.1 | -2.84% |
| All Tech | 2,633.1 | -4.72% |
| Emerging Companies | 3,037.2 | -3.30% |
Currency | ||
| AUD/USD | 0.7068 | -0.33% |
US Futures | ||
| S&P 500 | 6,840.0 | -0.16% |
| Dow Jones | 49,433.0 | -0.18% |
| Nasdaq | 24,720.0 | -0.19% |
Name | Value | % Chg |
|---|---|---|
Sector | ||
| Utilities | 10,129.0 | +3.38% |
| Real Estate | 3,767.4 | +0.85% |
| Consumer Staples | 12,037.9 | -0.41% |
| Communication Services | 1,633.2 | -0.75% |
| Financials | 9,810.5 | -0.84% |
| Industrials | 8,310.2 | -0.84% |
| Energy | 9,117.4 | -2.00% |
| Materials | 23,435.1 | -2.02% |
| Consumer Discretionary | 3,865.0 | -2.36% |
| Health Care | 29,396.0 | -4.04% |
| Information Technology | 1,634.0 | -5.06% |
Markets
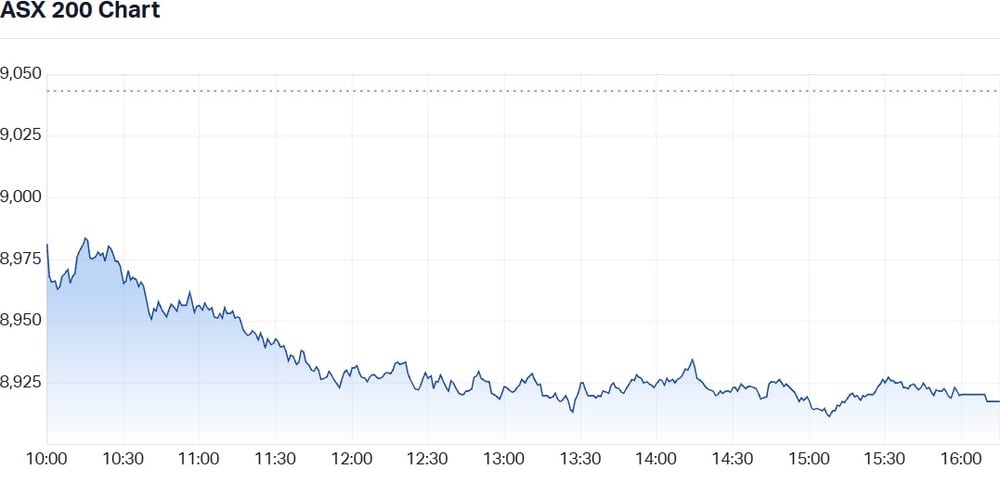
ASX 200 Session Chart
The S&P/ASX 200 (XJO) finished 125.9 points lower at 8917.6, 0.07% from its session low and 1.41% from its session high. In the broader-based S&P/ASX 300 (XKO), decliners beat advancers by a disturbing 237 to 39.
For the week, the XJO finished down 175 points or 0.6 % lower, 1.41% from its intraweek high and just 0.56% from its intraweek low.
Fund flows: Oh, Old Tin Pot… You’ve done it to us again! 🤦
70 and 44.
Those two numbers may have held the key to today’s 1.4% decline in the S&P/ASX 200 (aka, the Old Tin Pot) — just one session after it brushed up against a fresh all-time high.
Yesterday, the OTP came within a handful of points of rewriting the record books. Then, at precisely 1pm AEDT, a large and pervasive programmed sell order hit the tape. The advance stalled instantly. What had looked like steady accumulation turned into motivated distribution.
The index still logged a gain by the close, but the character of the session shifted = upward pointing shadow!!! ⚠️🚨
Today’s follow-through weakness suggests that the sell program was less random noise and more a signal that latent supply was waiting overhead.
In today’s edition of ChartWatch ASX Scans, 70 stocks made the Downtrends List. Of those, I promoted 44 to Feature Downtrends — my highest-conviction technical setups for S > D = P⬇️. That’s the largest number of Feature Downtrends since the 6-April 2025 candle which occurred amid last year’s Trump Tariff Tumult.
But yesterday saw no global tumult! Indeed, our benchmark index was flirting with history!
In other words, while the headlines lauded a tickle of the record (a breach according to the AFR! 😉), a substantial cohort of individual stocks were getting smashed.
The market breadth statistics reinforced the ChartWatch warning. Yesterday, decliners in the ASX 300 beat advancers by a very lopsided 214 to 64. Zooming out, and looking to rolling 12-month and all-time statistics:
Just 14% of ASX 200 constituents were trading within 10% of their all-time highs.
A whopping 74% were trading at least 20% below their all-time high.
A disturbing 20% were trading within 10% of their rolling 12-month lows.
That is not the statistical footprint of a broad, healthy bull market. It does, however, demonstrate how strength in a few big banks and major resources companies — the defining factor of yesterday’s advance — can obfuscate major sub-surface fragility.
Yesterday’s failed breakout and today’s sharp reversal are reminders that index-level euphoria can sit atop weakening foundations. The lesson is simple: never believe the hype when that hype rests on a thin veneer of mega-cap performance.
Oh, Old Tin Pot… You’ve done it to us again! 🤦
Today's best blue chip gainers
Company | Last Price | Change $ | Change % | 1mo % | 1yr % |
|---|---|---|---|---|---|
AMP (AMP) | $1.395 | +$0.115 | +9.0% | -23.1% | -20.3% |
Origin Energy (ORG) | $12.08 | +$0.58 | +5.0% | +9.2% | +19.1% |
Nextdc (NXT) | $14.02 | +$0.5 | +3.7% | +11.4% | -5.5% |
AGL Energy (AGL) | $10.42 | +$0.26 | +2.6% | +19.6% | -4.9% |
Goodman Group (GMG) | $31.02 | +$0.72 | +2.4% | +0.8% | -14.2% |
Scentre Group (SCG) | $3.79 | +$0.06 | +1.6% | -9.3% | +4.7% |
Brambles (BXB) | $23.30 | +$0.31 | +1.3% | +0.3% | +20.4% |
ANZ Group Holdings (ANZ) | $40.89 | +$0.54 | +1.3% | +12.4% | +30.9% |
Telstra Group (TLS) | $4.94 | +$0.06 | +1.2% | +2.7% | +27.6% |
Vicinity Centres (VCX) | $2.57 | +$0.03 | +1.2% | -1.2% | +16.3% |
Stockland (SGP) | $5.17 | +$0.06 | +1.2% | -7.0% | +0.4% |
Insurance Australia Group (IAG) | $6.87 | +$0.07 | +1.0% | -10.0% | -11.9% |
Transurban Group (TCL) | $14.00 | +$0.14 | +1.0% | +0.1% | +6.1% |
APA Group (APA) | $9.07 | +$0.09 | +1.0% | +4.1% | +36.8% |
GPT Group (GPT) | $5.03 | +$0.03 | +0.6% | -7.2% | +10.5% |
ASX (ASX) | $54.76 | +$0.32 | +0.6% | +4.3% | -17.5% |
Rio Tinto (RIO) | $169.74 | +$0.94 | +0.6% | +15.7% | +41.0% |
Bluescope Steel (BSL) | $29.16 | +$0.15 | +0.5% | +1.2% | +36.9% |
Coles Group (COL) | $22.05 | +$0.09 | +0.4% | +5.0% | +13.3% |
Amcor PLC (AMC) | $70.06 | +$0.21 | +0.3% | +8.0% | -11.8% |
Today's worst blue chip losers
Company | Last Price | Change $ | Change % | 1mo % | 1yr % |
|---|---|---|---|---|---|
Cochlear (COH) | $199.22 | -$46.42 | -18.9% | -25.3% | -34.6% |
Wisetech Global (WTC) | $42.62 | -$4.95 | -10.4% | -36.8% | -65.4% |
Life360 (360) | $22.02 | -$2.47 | -10.1% | -27.3% | -8.1% |
Light & Wonder (LNW) | $138.03 | -$13.92 | -9.2% | -23.6% | -8.3% |
Seek (SEK) | $15.84 | -$1.57 | -9.0% | -30.8% | -34.0% |
Pro Medicus (PME) | $118.22 | -$10.78 | -8.4% | -44.3% | -57.6% |
Block (XYZ) | $69.55 | -$5.99 | -7.9% | -30.9% | -47.6% |
Pinnacle Investment Management (PNI) | $16.31 | -$1.24 | -7.1% | -8.5% | -33.3% |
Technology One (TNE) | $20.17 | -$1.53 | -7.1% | -26.6% | -36.4% |
Fisher & Paykel Healthcare Corp. (FPH) | $31.12 | -$2.1 | -6.3% | -7.2% | -1.2% |
Capricorn Metals (CMM) | $13.25 | -$0.81 | -5.8% | -10.5% | +70.1% |
REA Group (REA) | $158.09 | -$9.08 | -5.4% | -16.1% | -41.5% |
Aristocrat Leisure (ALL) | $48.44 | -$2.55 | -5.0% | -16.3% | -36.7% |
Resmed Inc (RMD) | $34.17 | -$1.66 | -4.6% | -10.2% | -9.1% |
Worley (WOR) | $13.03 | -$0.63 | -4.6% | -0.1% | -11.0% |
Genesis Minerals (GMD) | $6.87 | -$0.33 | -4.6% | -8.9% | +113.4% |
PLS Group (PLS) | $4.23 | -$0.2 | -4.5% | -13.1% | +89.7% |
Xero (XRO) | $73.49 | -$3.43 | -4.5% | -31.7% | -59.9% |
Eagers Automotive (APE) | $24.67 | -$1.08 | -4.2% | -7.6% | +95.0% |
Netwealth Group (NWL) | $21.37 | -$0.93 | -4.2% | -15.2% | -31.9% |
ChartWatch
Nasdaq Composite Index
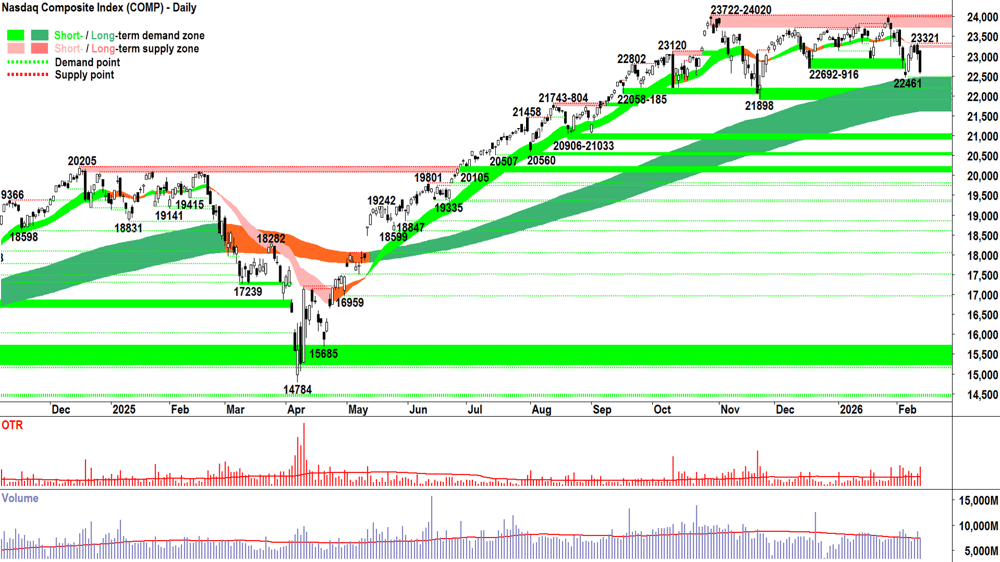
Analysis
What did I say yesterday? 33-33-33 probabilities for:
Demand from those buying the dip into the long term uptrend ribbon consumes / overcomes the supply at the short term downtrend ribbon/23232.
Supply holds out for another night… based on the last couple of “pause” candles, it probably won’t overcome this last little demand-side push…
Short term downtrend ribbon proves too great a hurdle… it steps up its attack and closes the Comp below Wednesday’s candle low of 22902… we rebound back towards the long term uptrend ribbon.
In my defence, can I offer I concluded a 66% probability that the Comp would NOT GO UP last night! 😁
Obviously, we got Scenario 3, the one where the supply at the short term downtrend ribbon proves to much for the demand-side. What we saw (long black-bodied candle, close very near low of the session) demonstrates credible supply-side motivation — they wanted out — and there was very little demand-side motivation in the way.
There was only average volume, so roughly balanced on supply-side size versus the demand getting in its way. It wasn’t a deluge of supply, nor was it a total demand-side vacuum. Nope, Thursday was more about motivation, and that’s important.
It’s not a great candle, sure, but it’s a one warning sign emoji kind of deal ⚠️. On the other hand, if we did have high volume, or if we did have low volume, it would have elicited a two warning sign emoji response!
Thursday's ⬛🕯️ + deluge of supply (i.e., substantially above average volume) = ⚠️⚠️
Thursday's ⬛🕯️ + demand-side vacuum (i.e., substantially below average volume) = ⚠️⚠️
Hey, consider that even just one ⚠️ still isn’t good!
Now it all comes down to the long term uptrend ribbon (presently 21615-22465). I note the 22461 point of demand is also in the mix.
You know what to look for: Bounce from the long term uptrend ribbon, like it did on Monday… or consume 22461 and begin to look very, very dodgy indeed! ⚠️⚠️⚠️
What are the odds…? 🤔
View
Still on the fence here… but now rather comfortable with my position! I am at 1/2RP portfolio risk limit 🪣 (RP = Risk Position — it reflects my personal allowable capital allocation limit for my investments in US stocks. So 1/2RP is 50%, 2/3RP is 67% and FRP is 100%).
Key levels
22461 is the critical point of demand. If the Comp closes below that price, we can assume the supply side is very much in control. On a close below 21898 the long term uptrend is likely under significant pressure = ⚠️. 23321 is the nearest critical static point supply, but the short term downtrend ribbon (presently 23220-23270) may also impede upside price action.
S&P/ASX 200 (XJO)
%20chart_15%20Sep.png)
Analysis
Yesterday’s high of 9105 feels like a very long, long way away now. 😭
My "odds hunch" on this one yesterday wasn’t very good. Nope, I admit that I bought the dummy and went with a MOTN the price should go higher bet (i.e., candles, price action, trend ribbons looked pretty good — but these are clueless of the crumbling market breadth!).
Hey, apart from today’s rather ugly supply side showing, it may go higher yet!
But, that is indeed an ugly candle. It get’s even uglier when you blend in yesterday’s upward pointing shadow, and when you consider two days of above average volume.
It is clear ladies and gentlemen — there was a rather clever seller that knew exactly what they were doing and when and where they were going to do it!
They sold into the extra liquidity that often accompanies the optimism of a new record high.
And that’s exactly how you do it if you want to shift a great deal of supply at the best possible price.
Well, not you. Or me… Uh-uh, I'm talking about the biggest and smartest money.
Which is definitely not either of us! 😉
Hey — at least I was spot on with respect to where they were likely to do it: SMACK-BANG in the middle of the 9110-9116 supply zone. 🎯
(Okay, so where to next? Heck… It’s Friday… It’s been a long week… Short term uptrend ribbon… Hopefully there’s some buy the dip there… It doesn't look good for Monday, but more broadly, there’s still a lot to like about the recent technicals (since 8547-8562)… I still feel like the Old Tin Pot is on a bit of a mission to make a new high… In spite of itself! 🤦)
View
I am 2/3 RP 🪣 (i.e., my personal allowable capital allocation limit for my investments in Australian stocks is 67%).
Key levels
The short term uptrend ribbon (presently 8837-8872) is the closest zone of demand, a close below it would neutralise the present short term uptrend. 9110-9116 is the key zone of supply. Celebrations are on hold until the demand-side can consumer the highly motivated supply that appears to be residing there.
ChartWatch *LIVE* Webinar
ChartWatch *LIVE* Webinars – WEEKLY Wednesday's @ 12pm AEDT
Learn more about technical analysis and trend following through real case studies on ASX stocks. Australia's premier technical analyst, Carl Capolingua, shares his unique insights on stocks as requested by viewers. Ask about a company in your portfolio or anything related to trading and investing and get Carl's expert opinion.
Places are limited so >REGISTER NOW!<
Economy
Today
There were no major economic news announcements in our time zone today
Later this week
Saturday
00:30 USA January Core Consumer Price Index (CPI) (+0.3% m/m forecast vs +0.2% m/m in December)
Latest News
Interesting Movers
Trading higher
+9.0% AMP (AMP) – No news, rebounded after yesterday's sharp sell-off due to AMP FY 25 Investor Presentation.
+7.8% GQG Partners (GQG) – 2025 Full Year Results - Investor Presentation.
+5.0% Origin Energy (ORG) – Continued positive response to 12-Feb Investor Presentation for Half Year Results, general strength across the broader Utilities sector today.
+4.1% BetaShares US EQY Strong Bear CCY H Complex ETF (BBUS) – No news (Bear / short US stocks ETF).
+2.6% AGL Energy (AGL) – No news, general strength across the broader Utilities sector today.
Trading lower
-22.8% (ASB) – Earnings guidance update.
-22.3% Nick Scali (NCK) – 1H FY26 Investor Presentation.
-18.9% Cochlear (COH) – HY26 Result - Presentation, general weakness across the broader HealthCare sector today, fall is consistent with prevailing short and long term downtrends, a regular in ChartWatch ASX Scans Downtrends list 🔎📉
-13.0% Energy Transition Minerals (ETM) – Change in substantial holding (Le Shan Shenghe Rare Earth Company 5.95% from 7.23%).
-12.5% Investigator Resources (IVR) – No news, general weakness across the broader Silver sector today.
-11.4% Appen (APX) – No news, general weakness across the broader Information Technology sector today.
-10.4% Wisetech Global (WTC) – No news, general weakness across the broader Information Technology sector today, fall is consistent with prevailing short and long term downtrends, a regular in ChartWatch ASX Scans Downtrends list 🔎📉
-10.1% Qoria (QOR) – No news, general weakness across the broader Information Technology sector today, fall is consistent with prevailing short and long term downtrends, a regular in ChartWatch ASX Scans Downtrends list 🔎📉
-10.1% Life360 (360) – No news, general weakness across the broader Information Technology sector today, fall is consistent with prevailing short and long term downtrends, a regular in ChartWatch ASX Scans Downtrends list 🔎📉
-9.9% Siteminder (SDR) – Ceasing to be a substantial holder from MUFG, general weakness across the broader Information Technology sector today, fall is consistent with prevailing short and long term downtrends, a regular in ChartWatch ASX Scans Downtrends list 🔎📉
-9.2% Light & Wonder (LNW) – No news, general weakness across the broader Information Technology sector today.
-9.0% Seek (SEK) – No news, general weakness across the broader Information Technology sector today, fall is consistent with prevailing short and long term downtrends, a regular in ChartWatch ASX Scans Downtrends list 🔎📉
-8.8% Unico Silver (USL) – No news, general weakness across the broader Silver sector today.
-8.6% Boab Metals (BML) – No news, general weakness across the broader Silver sector today.
-8.5% Data#3 (DTL) – No news, general weakness across the broader Information Technology sector today.
-8.5% Zip Co. (ZIP) – No news, general weakness across the broader Information Technology sector today, fall is consistent with prevailing short and long term downtrends, a regular in ChartWatch ASX Scans Downtrends list 🔎📉
-8.4% Pro Medicus (PME) – Continued negative response to 12-Feb HY26 Results Presentation, general weakness across the broader HealthCare sector today, fall is consistent with prevailing short and long term downtrends, a regular in ChartWatch ASX Scans Downtrends list 🔎📉
-7.9% Block (XYZ) – No news, general weakness across the broader Information Technology sector today, fall is consistent with prevailing short and long term downtrends, a regular in ChartWatch ASX Scans Downtrends list 🔎📉
-7.1% Technology One (TNE) – No news, general weakness across the broader Information Technology sector today, fall is consistent with prevailing short and long term downtrends, a regular in ChartWatch ASX Scans Downtrends list 🔎📉
-7.0% Sun Silver (SS1) – No news, general weakness across the broader Silver sector today.
-7.0% Andean Silver (ASL) – No news, general weakness across the broader Silver sector today.
-6.6% Generation Development Group (GDG) – No news, fall is consistent with prevailing short and long term downtrends, a regular in ChartWatch ASX Scans Downtrends list 🔎📉
-6.5% Silver Mines (SVL) – No news, general weakness across the broader Silver sector today.
-6.4% Audinate Group (AD8) – No news, general weakness across the broader Information Technology sector today, fall is consistent with prevailing short and long term downtrends, one of the most Featured (highest conviction) stocks in ChartWatch ASX Scans Downtrends list 🔎📉
Broker Moves
Aeris Resources (AIS)
Upgraded to buy from accumulate at Morgans; Price Target: $0.70
Retained at speculative buy at Ord Minnett; Price Target: $0.85
AMP (AMP)
Retained at buy at Citi; Price Target: $1.80 from $21.00
Retained at buy at Jefferies; Price Target: $1.75 from $2.20
Upgraded to overweight from neutral at JPMorgan; Price Target: $1.50 from $1.70
Retained at overweight at Morgan Stanley; Price Target: $2.20
Upgraded to buy from accumulate at Ord Minnett; Price Target: $1.65 from $2.05
Upgraded to buy from neutral at UBS; Price Target: $1.75 from $1.90
ANZ Group Holdings (ANZ)
Retained at outperform at CLSA; Price Target: $42.80 from $38.90
Retained at neutral at JPMorgan; Price Target: $38.00 from $35.50
Retained at neutral at Macquarie; Price Target: $37.00 from $36.00
Upgraded to overweight from equal-weight at Morgan Stanley; Price Target: $41.30 from $36.30
Retained at lighten at Ord Minnett; Price Target: $33.00
Retained at sell at UBS; Price Target: $36.50 from $35.00
Austal (ASB)
Retained at neutral at Citi; Price Target: $6.90
ASX (ASX)
Retained at neutral at Citi; Price Target: $55.50
Retained at hold at Morgans; Price Target: $58.20 from $58.10
Retained at neutral at UBS; Price Target: $58.40 from $57.60
Bannerman Energy (BMN)
Retained at buy at Shaw and Partners; Price Target: $4.70
Breville Group (BRG)
Retained at buy at Goldman Sachs; Price Target: $37.60 from $37.00
Retained at overweight at Jarden; Price Target: $34.90 from $31.00
Retained at overweight at JPMorgan; Price Target: $36.50 from $35.50
Retained at outperform at Macquarie; Price Target: $38.50 from $39.20
Retained at buy at Morgans; Price Target: $40.65 from $36.05
Upgraded to accumulate from hold at Ord Minnett; Price Target: $37.20 from $35.00
Retained at sector perform at RBC Capital Markets; Price Target: $34.00 from $32.00
BWP Trust (BWP)
Retained at buy at Citi; Price Target: $4.00
Cogstate (CGS)
Initiated at buy at Bell Potter; Price Target: $2.90
Collins Foods (CKF)
Retained at buy at Citi; Price Target: $12.85
Charter Hall Long Wale REIT (CLW)
Upgraded to buy from neutral at Citi; Price Target: $4.70
Retained at neutral at Macquarie; Price Target: $3.75 from $3.96
Retained at equal-weight at Morgan Stanley; Price Target: $4.62
CSL (CSL)
Retained at neutral at Macquarie; Price Target: $176.00 from $188.00
Domino's Pizza Enterprises (DMP)
Retained at sell at Citi; Price Target: $19.85
DPM Metals Inc. (DPM)
Downgraded to neutral from outperform at Macquarie; Price Target: $58.00 from $59.00
Evolution Mining (EVN)
Retained at neutral at Citi; Price Target: $16.20 from $14.40
Garda Diversified Property Fund (GDF)
Retained at accumulate at Morgans; Price Target: $1.35 from $1.40
Guzman Y Gomez (GYG)
Retained at sell at Citi; Price Target: $21.05
HomeCo Daily Needs REIT (HDN)
Retained at accumulate at Morgans; Price Target: $1.40 from $1.46
Insurance Australia Group (IAG)
Retained at buy at Citi; Price Target: $8.30 from $9.00
Retained at hold at CLSA; Price Target: $7.10 from $8.05
Retained at neutral at Goldman Sachs; Price Target: $8.00
Retained at overweight at JPMorgan; Price Target: $7.70 from $8.70
Retained at outperform at Macquarie; Price Target: $9.00 from $8.90
Retained at equal-weight at Morgan Stanley; Price Target: $7.50 from $8.45
IGO (IGO)
Retained at outperform at Macquarie; Price Target: $9.25 from $9.50
Lynas Rare Earths (LYC)
Retained at sell at Ord Minnett; Price Target: $11.00
Macquarie Group (MQG)
Retained at hold at Morgans; Price Target: $223.52 from $215.70
Nick Scali (NCK)
Retained at buy at Citi; Price Target: $27.95
NIB Holdings (NHF)
Retained at buy at Citi; Price Target: $8.15
Northern Star Resources (NST)
Upgraded to buy from neutral at Citi; Price Target: $33.40 from $28.60
Netwealth Group (NWL)
Retained at buy at Citi; Price Target: $28.90
Orora (ORA)
Retained at outperform at CLSA; Price Target: $2.80 from $2.70
Retained at buy at Jarden; Price Target: $2.60
Retained at outperform at Macquarie; Price Target: $2.45 from $2.35
Retained at hold at Morgans; Price Target: $2.30
Origin Energy (ORG)
Retained at buy at Citi; Price Target: $13.00
Upgraded to overweight from neutral at Jarden; Price Target: $12.00 from $11.65
Retained at buy at Jefferies; Price Target: $13.03 from $12.87
Retained at neutral at Macquarie; Price Target: $11.25
Retained at underweight at Morgan Stanley; Price Target: $10.88
Retained at sector perform at RBC Capital Markets; Price Target: $13.50
Paladin Energy (PDN)
Retained at buy at Canaccord Genuity; Price Target: $16.00 from $15.95
Retained at sell at Ord Minnett; Price Target: $9.75
Pro Medicus (PME)
Retained at buy at Bell Potter; Price Target: $240.00 from $320.00
Retained at buy at Citi; Price Target: $300.00 from $350.00
Retained at outperform at CLSA; Price Target: $170.00 from $350.00
Retained at neutral at E&P; Price Target: $228.83 from $247.00
Retained at outperform at Macquarie; Price Target: $244.00 from $291.30
Retained at overweight at Morgan Stanley; Price Target: $275.00 from $350.00
Retained at buy at Morgans; Price Target: $275.00 from $290.00
Retained at sector perform at RBC Capital Markets; Price Target: $190.00 from $225.00
South32 (S32)
Retained at outperform at Macquarie; Price Target: $5.00 from $4.80
Downgraded to accumulate from buy at Morgans; Price Target: $5.00
Retained at buy at UBS; Price Target: $5.10 from $5.30
Santos (STO)
Retained at buy at Ord Minnett; Price Target: $7.50 from $7.60
Turaco Gold (TCG)
Retained at buy at Morgans; Price Target: $2.19 from $1.63
Temple & Webster Group (TPW)
Retained at buy at Bell Potter; Price Target: $13.00 from $19.50
Upgraded to buy from neutral at Citi; Price Target: $15.38
Retained at buy at Goldman Sachs; Price Target: $16.05 from $18.70
Retained at outperform at Macquarie; Price Target: $13.70 from $24.15
Viva Leisure (VVA)
Retained at buy at Morgans; Price Target: $2.00 from $1.80
WA1 Resources (WA1)
Retained at speculative buy at Canaccord Genuity; Price Target: $32.00 from $28.00
Westpac Banking Corporation (WBC)
Retained at neutral at Citi; Price Target: $39.00
Scans
Top Gainers
Code | Company | Last | % Chg |
|---|---|---|---|
| CDR | Codrus Minerals Ltd | $0.04 | +29.03% |
| ARC | ARC Funds Ltd | $0.115 | +19.79% |
| EDE | Eden Innovations Ltd | $0.19 | +18.75% |
| QEM | QEM Ltd | $0.032 | +18.52% |
| BSA | BSA Ltd | $0.28 | +16.67% |
Top Fallers
Code | Company | Last | % Chg |
|---|---|---|---|
| MNB | Minbos Resources Ltd | $0.012 | -38.46% |
| WJL | Webjet Group Ltd | $0.58 | -25.16% |
| ASB | Austal Ltd | $4.87 | -22.82% |
| MIO | Macarthur Minerals Ltd | $0.031 | -22.50% |
| NCK | Nick Scali Ltd | $18.48 | -22.32% |
52 Week Highs
Code | Company | Last | % Chg |
|---|---|---|---|
| EDE | Eden Innovations Ltd | $0.19 | +18.75% |
| BSA | BSA Ltd | $0.28 | +16.67% |
| TAS | Tasman Resources Ltd | $0.067 | +9.84% |
| GR8 | Great Dirt Resources Ltd | $0.65 | +8.33% |
| EMP | Emperor Energy Ltd | $0.135 | +8.00% |
52 Week Lows
Code | Company | Last | % Chg |
|---|---|---|---|
| MNB | Minbos Resources Ltd | $0.012 | -38.46% |
| COH | Cochlear Ltd | $199.22 | -18.90% |
| CMO | Cosmo Metals Ltd | $0.011 | -15.39% |
| TPC | TPC Consolidated Ltd | $5.02 | -15.20% |
| AQZ | Alliance Aviation Services Ltd | $0.92 | -12.80% |
Near Highs
Code | Company | Last | % Chg |
|---|---|---|---|
| WVOL | iShares MSCI World Ex Aust Minimum Volatility ETF | $44.46 | -0.54% |
| IAGPF | Insurance Australia Group Ltd | $106.30 | +0.28% |
| GCI | Gryphon Capital Income Trust | $2.07 | 0.00% |
| VVLU | Vanguard Global Value Equity Active ETF | $81.18 | -1.28% |
| IHD | iShares S&P/ASX DIV Opportunities Esg Screened ETF | $17.00 | -0.47% |
Relative Strength Index (RSI) Oversold
Code | Company | Last | % Chg |
|---|---|---|---|
| IRE | Iress Ltd | $7.02 | -6.28% |
| MTO | Motorcycle Holdings Ltd | $2.52 | +0.40% |
| ATEC | Betashares S&P/ASX Australian Technology ETF | $20.40 | -3.41% |
| LSGE | Loomis Sayles Global Equity Fund - Active ETF | $2.09 | -1.42% |
| RDY | Readytech Holdings Ltd | $1.805 | -3.99% |
