
PME, WTC, and XRO shares are tumbling: An investor guide to navigating the ASX tech-wreck
AI-fuelled panic has smashed ASX tech stocks. Here’s what most investors missed — and how you can figure out what happens next.

Source: Market Index using ChatGPT 5.2
Mentioned
KEY POINTS
- ASX tech heavyweights like XRO, PME and WTC have plunged as global AI fears hammer software valuations.
- But the trend deterioration began months before this week’s headlines, as demand for tech company shares quietly flipped to supply.
- We break down the signals that flagged the shift months in advance — and what to watch for when the next major low forms.
Australia’s Information Technology and Communications Services sectors are under sustained pressure.
Since October last year, the S&P/ASX Information Technology index has fallen sharply from its peak, while Communications Services — home to several major software and digital infrastructure names — has also rolled over. The declines have been broad, swift, and, in some cases, brutal.
The latest catalyst has come from the United States, where aggressive new AI automation tools from Anthropic triggered a sharp repricing across global software stocks. Fears that AI agents could bypass traditional enterprise software models have unsettled investors and compressed previously lofty valuations across the sector.
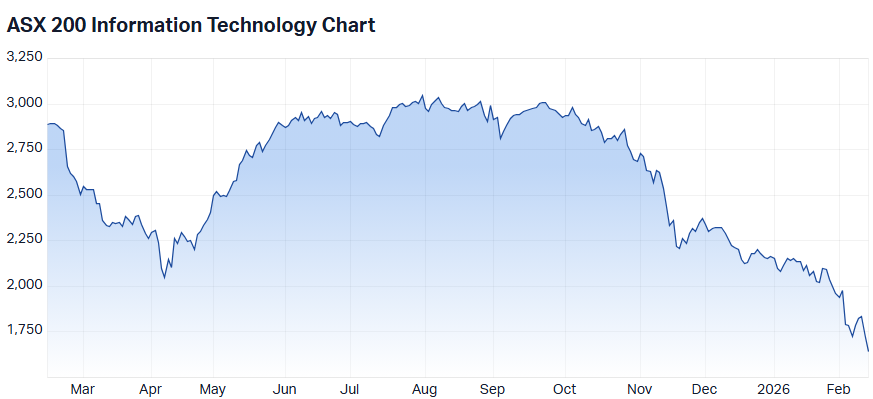
ASX 200 Information Technology Sector Index (XIJ) chart
Whether this proves cyclical or structural remains uncertain. What’s clear is that the current selloff ranks among the most significant shocks to technology stocks since the early-2000s dot-com unwind.
This article explores the forces behind the ASX and global tech-wreck, examines how the deterioration in trend became visible well before the headlines intensified, and outlines the signals that can help investors navigate volatility — and, in some cases, even turn it into opportunity.
Charting disaster
Long before AI headlines dominated financial media, the share price charts of many ASX technology leaders were already deteriorating.
One technical framework that proved particularly relevant during this unwind is the ChartWatch model — a systematic, price-based approach to trend identification developed over decades of trading across bull and bear cycles.
ChartWatch relies exclusively on price behaviour — not earnings forecasts, macro views, or narrative. It focuses on trend state, price structure, candlestick behaviour, volatility, and volume. Market Index readers have direct access to the ChartWatch model via the daily ASX Scans series and accompanying Live Webinars.
Within the model sits a defined technical pattern known as the Turnaround Setup.
A Short Turnaround Setup — which identifies when a long-term trend flips from up to down — occurs when:
The long-term trend ribbon is neutral or still up.
The short-term ribbon has flipped down.
Price forms falling peaks and falling troughs.
Price closes below the midpoint of the long-term ribbon.
Supply-side candles dominate.
A strong supply-side expansion candle confirms the shift.
In practical terms: the underlying demand–supply environment has shifted to excess supply. Excess supply in any market typically leads to lower prices.
Importantly, this setup began appearing across major ASX technology stocks months before February’s AI-driven selloff headlines. The table below shows how several of the ASX’s biggest tech companies have fared since the sector notched its all-time high on July 31 last year, and their corresponding appearances in ChartWatch ASX Scans.
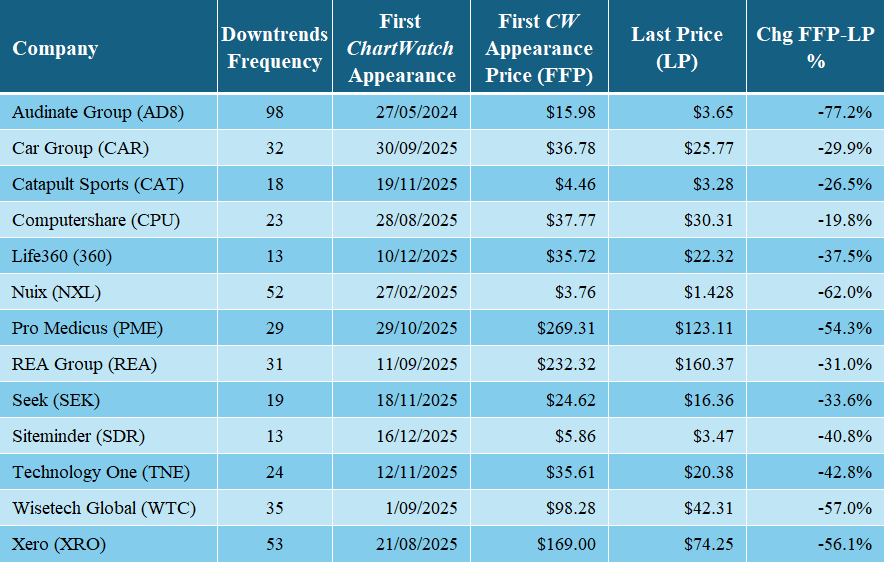
ChartWatch ASX Scans Downtrends Lists appearances selected ASX technology stocks (prices as of midday Feb 13)
Let’s investigate three case studies — arguably the ASX’s most influential technology companies: Xero (XRO), Pro Medicus (PME), and WiseTech Global (WTC) — to see how the Short Turnaround Setup generated the first signals in the table above.
Case Study 1: Xero (XRO)
%20chart%2013%20Feb%202026.png)
Xero (ASX-XRO) chart
Xero’s long-term uptrend matured through mid-2025, peaking at $196.52 on 24 June. That peak immediately preceded the announcement of a $1.85 billion placement to help fund the acquisition of Melio Limited, a US-based accounting software firm.
We can infer from the subsequent price action that this acted as the catalyst for a major re-rating of the stock. The demand–supply environment flipped from excess demand to excess supply — almost overnight.
Investors poring over the details of the Melio deal to determine whether it was good or bad for Xero’s long-term valuation may have missed the bigger message: the largest and most informed capital was already voting.
The short-term ribbon rolled over first — switching from light green (up) to amber (neutral). Price action swiftly shifted from rising peaks and troughs to falling peaks and troughs, before breaking below the midpoint of the long-term ribbon, which also transitioned to neutral.
A peak forming within the long-term ribbon suggested it was no longer acting as a cushion to price — typically a major warning sign of excess supply.
At the time, earnings commentary remained broadly supportive. But from a demand-versus-supply standpoint, the stock had transitioned.
XRO made its first appearance as a Short Turnaround Setup on August 21, 2025, at a candle closing price of $169. It has made 52 subsequent appearances in the downtrends list, with the most recent on February 12 at a candle closing price of $76.92 — a decline of nearly 55%.
Case Study 2: Pro Medicus (PME)
%20chart%2013%20Feb%202026.png)
Pro Medicus (ASX-PME) chart
Like most ASX stocks — technology names in particular — PME rode the rollercoaster that was 2025. It sold off sharply during the Trump tariff turmoil early in the year, bottomed in April, and then surged to new all-time highs mid-year.
Like many ASX technology stocks, that peak proved enduring.
There wasn’t a single news catalyst that sparked PME’s initially gradual decline, as there was with XRO. Regardless, PME’s chart displayed all the familiar hallmarks of trend change via the Short Turnaround Setup.
Note here — and in each case study — that the ChartWatch model did not pick the exact top of the long-term uptrend. That’s impossible, because it’s a trend-following system. It takes time for changes in the underlying demand–supply environment to flow through to candles, price action, and trend ribbons.
The model’s goal is not to pick tops or bottoms — it aims to ride strong trends for as long as possible, and to alert users when a prevailing trend has grown untenable.
That shift was signalled on October 29, 2025, at a candle closing price of $269.31. PME has made 28 subsequent appearances in the downtrends list, most recently on February 12 at a candle closing price of $129 — a decline of just over 52%.
Case Study 3: WiseTech Global (WTC)
%20chart%2013%20Feb%202026.png)
Wisetech Global (ASX-WTC) chart
By now, the signs of trend change using the Short Turnaround Setup should feel familiar.
Two reversal zones are marked — one in February 2025 (during tariff-driven volatility), and a more enduring reversal in August. The latter was sparked by WTC’s full-year results announcement on August 27. Clearly, investors were unimpressed.
This reinforces an important point: fundamental developments can materially change perceived value, and the underlying demand–supply dynamics can flip suddenly. Once price breaks decisively below short- and long-term trend ribbons — and rallies fail to exceed prior peaks — the writing is usually on the wall.
For those prepared to look.
ChartWatch ASX Scans first flagged WTC as a Short Turnaround Setup on September 1, 2025, at a candle closing price of $98.28. It has made 34 subsequent appearances in the downtrends list, most recently on February 12 at a candle closing price of $47.57 — a decline of nearly 52%.
The long and short of the 2026 tech-wreck
The current selloff may ultimately prove cyclical, structural — or somewhere in between. But one fact is clear: the deterioration in share price trends across major ASX technology names was measurable well before this week’s headlines intensified.
(And yes — journalists, with their dire headlines of “crashes”, are often last to the party!)
There are two implications for investors:
Risk can often be reduced before headlines escalate by watching both fundamental and technical developments closely.
Once a trend change has been identified, opportunities to profit may emerge for those able to go short.
Short selling is beyond the scope of this article, but at its simplest, short sellers aim to profit from a falling share price by selling shares first and buying them back later at a lower price.
ChartWatch ASX Scans systematically monitor trend strength and deterioration across the entire ASX. Many technology leaders progressively shifted from its uptrend lists to its downtrend lists during the second half of last year.
That shift was not predictive.
It was reactive to price.
Importantly, ChartWatch does not constitute financial advice, nor is it a signal service. It does not instruct investors when to buy or sell. It simply identifies share price trends — and when they might be changing. And those trends changed in ASX tech months ago.
When’s the best time to plant a tree? 🌳
The next major inflection — the one that stamps out an eventual durable low — will likely be accompanied by the corollary of the factors that define the Short Turnaround Setup (i.e., the “Long Turnaround Setup”). I won’t list those factors here — detailed explanations sit within the webinars, alongside broader discussions of risk and portfolio management.
As for your next steps after reading this article, I am reminded of a saying:
“The best time to plant a tree was 20 years ago. The second best time is now.”
Learning about the ChartWatch model today won’t undo losses investors may have experienced over the past six months. But it might help them avoid a similar fate when the next major sector rotation occurs.
The lesson from this tech-wreck is not about AI-fuelled optimism or pessimism. It’s about respecting trend transitions when they first appear — not when the news finally catches up to explain them.
ChartWatch *LIVE* Webinar
ChartWatch *LIVE* Webinars – WEEKLY Wednesday's @ 12pm AEDT
Learn more about technical analysis and trend following through real case studies on ASX stocks. Australia's premier technical analyst, Carl Capolingua, shares his unique insights on stocks as requested by viewers. Ask about a company in your portfolio or anything related to trading and investing and get Carl's expert opinion.
Places are limited so >REGISTER NOW!<
