News | Market Wraps
Evening Wrap: ASX 200 gains despite tech wipe out, XRO tumbles 16% and WTC 11% as investors flee sector
The S&P/ASX 200 closed 70.7 points higher, up +0.80%.

Mentioned
The S&P/ASX 200 closed 70.7 points higher, up +0.80%.
The market shook off an early wobble to steadily gain throughout the session and close near the daily highs.
Banks and miners offset broad weakness across rate-sensitive sectors, particularly in Consumer Discretionary (XDJ) (-1.1%).
Resources (XJR) (+3.7%), continued to climb, led by South32 (S32) (+6.2%) and Northern Star Resources (NST) (+6.2%). Energy (XEJ) (+3.1%) followed, with Yancoal Australia (YAL) (+9.0%) and Woodside Energy Group (WDS) (+3.1%) among the standouts (coal stocks were generally very good).
Gold (+2.7%) and silver (+3.7%) extended their rally to 2-days, as precious metals prices continued to recover.
Elsewhere, Information Technology (XIJ) (-9.4%), continued its tumble, with Xero (XRO) (-15.9%) and WiseTech Global (WTC) (-10.7%) extending their own mounting losses.
In stock specific news, Amcor (AMC) (+3.5%) firmed after its Q2 earnings result, while Pinnacle Investment (PNI) (+3.2%) rose after its 1H26 result; Neuren Pharmaceuticals (NEU) (0.0%) entered a trading halt after news of a negative trend vote in its European regulatory submission on Tuesday.
Be sure to click/scroll through for the usual reporting of the major sector and stock-specific moves, the broker responses to them, as well as all the key economic data in tonight's Evening Wrap.
Also, I have detailed technical analysis on the Nasdaq Composite and the S&P/ASX 200 in today's ChartWatch.
Let's dive in!
Today in Review
Wed 04 Feb 26, 5:26pm (AEST)
Name | Value | % Chg |
|---|---|---|
Major Indices | ||
| ASX 200 | 8,927.8 | +0.80% |
| All Ords | 9,204.6 | +0.60% |
| Small Ords | 3,790.4 | -0.49% |
| All Tech | 2,914.4 | -7.14% |
| Emerging Companies | 3,246.7 | +0.58% |
Currency | ||
| AUD/USD | 0.703 | +0.11% |
US Futures | ||
| S&P 500 | 6,950.75 | +0.13% |
| Dow Jones | 49,430.0 | +0.16% |
| Nasdaq | 25,455.0 | +0.01% |
Name | Value | % Chg |
|---|---|---|
Sector | ||
| Materials | 23,680.1 | +3.53% |
| Energy | 9,471.4 | +3.14% |
| Financials | 9,346.6 | +0.98% |
| Health Care | 33,963.3 | +0.10% |
| Consumer Staples | 11,842.4 | -0.00% |
| Industrials | 8,333.2 | -0.72% |
| Consumer Discretionary | 3,946.3 | -1.06% |
| Real Estate | 3,824.2 | -1.18% |
| Communication Services | 1,684.9 | -2.01% |
| Utilities | 9,414.6 | -2.05% |
| Information Technology | 1,789.2 | -9.40% |
Markets
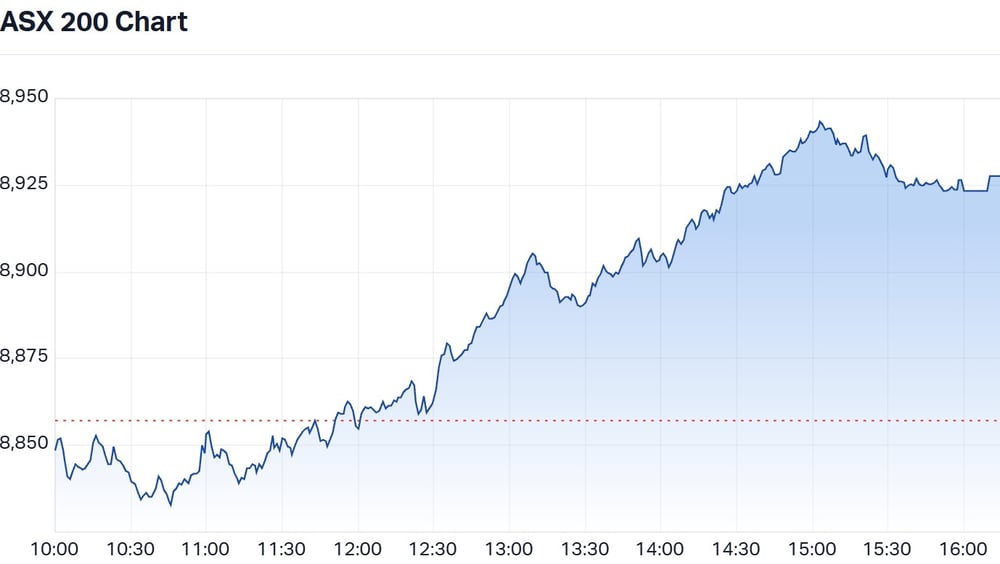
ASX 200 Session Chart
The S&P/ASX 200 (XJO) finished 78.7 points higher at 8,927.8 , 1.08% from its session low and just 0.18% from its session high. Despite the strong performance in the benchmark index, in the broader-based S&P/ASX 300 (XKO), decliners beat advancers by a disturbing 173 to 107.
Fund flows: What's the emergency this time!? 🚑🚨
*9.4%*
That’s how much the Information Technology (XIJ) sector fell today. 🤯
Here are the XIJ biggest 1-day percentage falls since 2000 (note, ASX 200 sector indices only began in 2000):
17/04/2000 -24.1% (part of the Dot-com crash)
04/04/2000 -11.5% (ditto Dot-com…)
16/03/2020 -10.5% (COVID-19 crash)
17/09/2001 -9.8% (ditto Dot-com…)
18/03/2020 -9.8% (ditto COVID…)
05/04/2000 -9.5% (ditto Dot-com…)
04/02/2026 -9.4% Today!
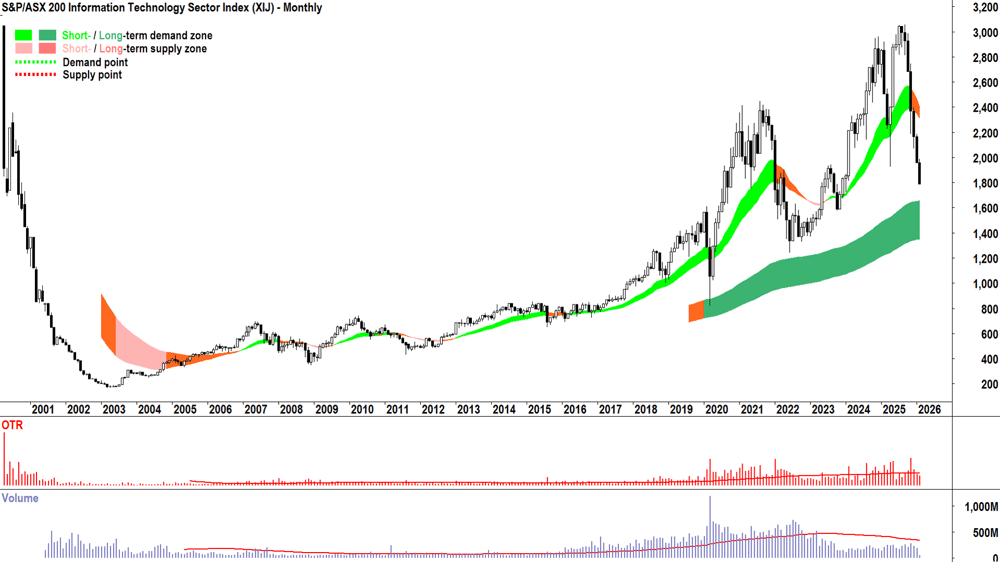
S&P/ASX 200 Information Technology Sector Index monthly chart
Today was the seventh-largest one-day fall in the XIJ’s history, and the first that isn’t related to the 2000-2002 Dot-com bear market, or the 2020 COVID-19 pandemic calamity.
Arguably, those two historical events were pretty heavy stuff. They will be remembered 100 years from now and will studied by finance students for probably that long.
But what about today? 🤔
What’s so special about now… Why the sudden and overwhelming about-face in these stocks which started in the back half of last year?
Beats me. Don’t know. Don’t care. 🤷
Sorry if you wanted something more insightful there — but you’re asking the wrong person. Maybe go ask a fundamental analyst… They’ll probably tell you about the brutal rotation out of the ASX long duration as local bond yields have rocketed. (Note the timing in the chart below: if you read Evening Wrap, you knew all about this shortly after it started happening, and you've been reminded nearly daily since! 💪).
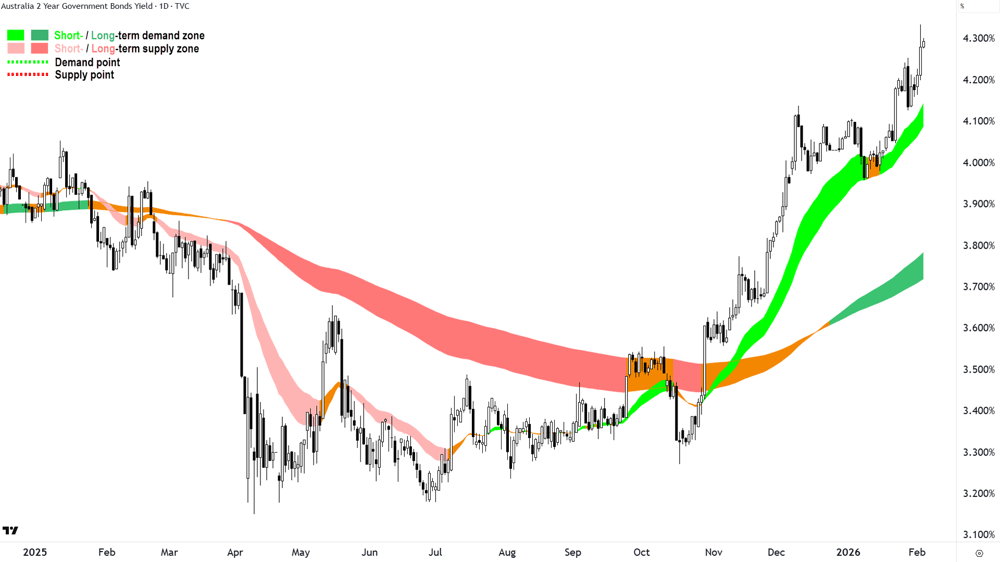
Australian 2-Year Government Bond Yield chart
Perhaps, they’ll discuss that the sector was just plain overvalued… or that some of the key stocks are far from the forefront of the AI revolution and are therefore being sold in favour of the many global players that are. Sure, our ASX tech stocks will be AI adopters, but they’re hardly AI innovators, nor are they the hardware manufacturers that aim to sell "shovels to the miners" as the old saying goes...
All I know, is that around August last year, the charts of the major players in the sector started to flatten out their previous heady ascents, and then rather quickly, they rolled over.
Xero (XRO) (-16%) for example — the stock arguably responsible for seeding today’s tech-wreck with its disappointing investor briefing — first appeared as a Downtrend in my ChartWatch ASX Scans on 25-August 2025 at a price of $169. It first "Featured", i.e., my highest conviction downtrend, on 25-Aug, and has since appeared (regular and feature) roughly 50 times since.
50 times, about 6 months. That’s roughly twice a week! (For those who attend my ChartWatch *LIVE* Webinars... that's plenty of "-R" opportunities — but just as many short selling opportunities too! 😉)
%20chart_4%20Feb.png)
Xero (XRO) chart
You’ll find similar ChartWatch ASX Scans records for the other major techs that were hobbled today, like Wisetech Global (WTC) (-11.7%), Technology One (TNE) (-10.5%), and Pro Medicus (PME) (-6.3%) (I know, that one’s a Healthcare stock!).
Anyways… the charts possibly told us more of a story about major fund flows than any of the fundamentals available to most average investors. Let’s face it — we’re probably going to be the last one’s to know when the fundamentals have changed… It's not like the big funds are going to send us a snap on SnapChat!
But, we have something even better: S > D = P ⬇️
Today's best blue chip gainers
Company | Last Price | Change $ | Change % | 1mo % | 1yr % |
|---|---|---|---|---|---|
South32 (S32) | $4.79 | +$0.28 | +6.2% | +30.9% | +42.6% |
Northern Star Resources (NST) | $28.55 | +$1.66 | +6.2% | +14.4% | +65.0% |
Lynas Rare Earths (LYC) | $16.01 | +$0.76 | +5.0% | +23.4% | +159.9% |
Ramelius Resources (RMS) | $4.69 | +$0.22 | +4.9% | +8.6% | +89.9% |
BHP Group (BHP) | $52.40 | +$2.27 | +4.5% | +12.7% | +31.2% |
Newmont Corp. (NEM) | $171.88 | +$7.13 | +4.3% | +11.5% | +148.4% |
Rio Tinto (RIO) | $159.43 | +$6.56 | +4.3% | +6.6% | +35.8% |
Evolution Mining (EVN) | $15.02 | +$0.56 | +3.9% | +17.4% | +163.5% |
Amcor PLC (AMC) | $65.31 | +$2.23 | +3.5% | +3.8% | -16.8% |
Santos (STO) | $7.04 | +$0.23 | +3.4% | +15.8% | -0.1% |
Pinnacle Investment Management (PNI) | $17.75 | +$0.55 | +3.2% | +4.7% | -30.6% |
Capricorn Metals (CMM) | $14.16 | +$0.43 | +3.1% | -2.7% | +83.4% |
Woodside Energy Group (WDS) | $25.84 | +$0.78 | +3.1% | +10.8% | +4.6% |
Whitehaven Coal (WHC) | $9.56 | +$0.28 | +3.0% | +23.4% | +56.2% |
Genesis Minerals (GMD) | $7.31 | +$0.21 | +3.0% | -3.1% | +129.2% |
IGO (IGO) | $8.76 | +$0.24 | +2.8% | +5.4% | +77.7% |
Commonwealth Bank of Australia (CBA) | $157.06 | +$3.98 | +2.6% | -2.2% | -2.2% |
Perseus Mining (PRU) | $5.69 | +$0.14 | +2.5% | -0.9% | +98.3% |
National Australia Bank (NAB) | $43.93 | +$0.89 | +2.1% | +3.3% | +9.4% |
CSL (CSL) | $181.70 | +$3.59 | +2.0% | +5.4% | -35.2% |
Today's worst blue chip losers
Company | Last Price | Change $ | Change % | 1mo % | 1yr % |
|---|---|---|---|---|---|
Xero (XRO) | $80.82 | -$15.28 | -15.9% | -25.1% | -54.8% |
Hub24 (HUB) | $88.01 | -$10.6 | -10.7% | -6.4% | +9.1% |
Wisetech Global (WTC) | $51.25 | -$6.13 | -10.7% | -22.8% | -58.3% |
Technology One (TNE) | $22.65 | -$2.65 | -10.5% | -17.3% | -26.5% |
Seek (SEK) | $19.26 | -$1.72 | -8.2% | -16.2% | -16.1% |
Netwealth Group (NWL) | $22.65 | -$1.91 | -7.8% | -11.0% | -28.2% |
Car Group (CAR) | $25.68 | -$2.04 | -7.4% | -13.9% | -36.7% |
REA Group (REA) | $177.75 | -$13.85 | -7.2% | +0.1% | -28.8% |
Block (XYZ) | $79.77 | -$6.2 | -7.2% | -18.3% | -47.1% |
Pro Medicus (PME) | $166.35 | -$11.21 | -6.3% | -22.7% | -40.2% |
Life360 (360) | $26.94 | -$1.7 | -5.9% | -15.7% | +6.5% |
Computershare (CPU) | $31.62 | -$1.25 | -3.8% | -7.0% | -10.1% |
Dyno Nobel (DNL) | $3.29 | -$0.13 | -3.8% | +0.3% | +9.7% |
Origin Energy (ORG) | $11.12 | -$0.42 | -3.6% | -1.9% | +6.4% |
Nextdc (NXT) | $12.85 | -$0.41 | -3.1% | +4.5% | -13.5% |
Aristocrat Leisure (ALL) | $51.81 | -$1.5 | -2.8% | -5.1% | -31.4% |
Eagers Automotive (APE) | $25.35 | -$0.72 | -2.8% | +2.4% | +101.2% |
Steadfast Group (SDF) | $5.00 | -$0.14 | -2.7% | -4.0% | -14.4% |
Treasury Wine Estates (TWE) | $5.16 | -$0.14 | -2.6% | -2.1% | -50.7% |
Cochlear (COH) | $260.01 | -$6.75 | -2.5% | -0.2% | -18.7% |
ChartWatch
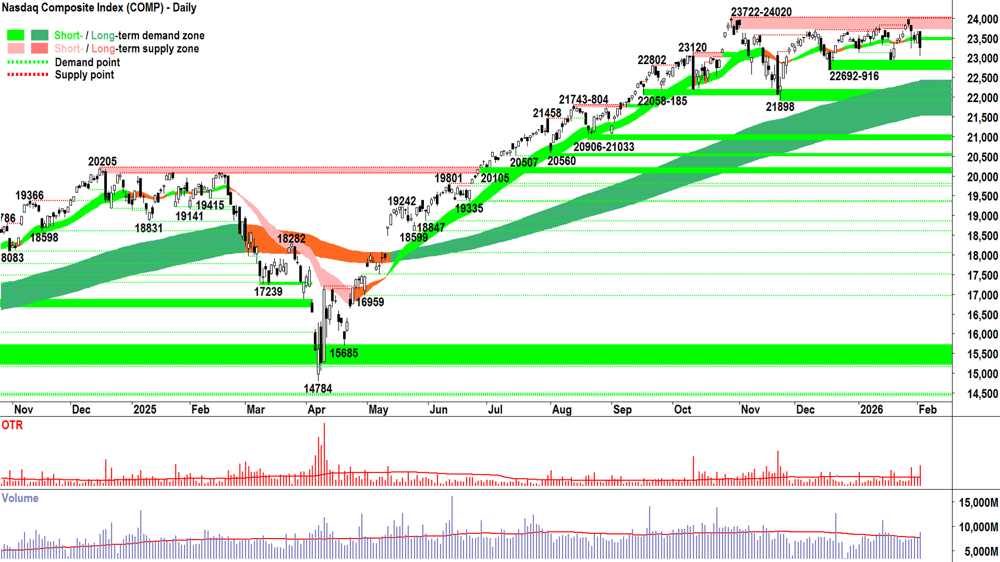
Nasdaq Composite Index
Analysis
Volatility ⬆️
Volume ⬆️
Price ⬇️
Not a great combination! And, as per the last 4 candles, Tuesday’s candle demonstrated significant indecision.
Neither demand, nor supply-side control (but arguably, more of the latter than the former!).
Tuesday’s range was the largest since the 20-Nov 2025 wipe out, although, substantially smaller. But it’s a signal that something’s not right here… that the forces of demand and supply driving the Comp are far from in agreement.
Consider Tuesday’s large black body and downward pointing shadow, for example… Motivated excess supply knocking prices down early in the session, followed by modest buy the dip. The elevated volume suggests both parties were active.
Investors are in two minds as to whether it’s best to stay or go.
Flows are a reflection of the underlying fundamentals = Just as murky!
The bottom line for me is:
Short term trend, price action, and candles are indicating a growing equilibrium ⚠️
I’ve already moved to a more conservative stance = 2/3RP but suspended the addition of new risk ⚖️
Clear point defined where RP reduces 👎
Clear point defined where RP increases 👍
Long term trend remains intact ✅
There’s really isn’t much else to do but wait for further evidence that either the demand- or supply-side id growing in control of price. Alert but not alarmed! 🧐
View
On Monday, I said: I am on hold for the addition of new long-side portfolio risk, but officially, remain at my 2/3RP portfolio risk limit 🪣. I think this is still prudent until we get at least one more demand-side confirmation candle. (RP = Risk Position — it reflects my personal allowable capital allocation limit for my investments in US stocks)
Key levels
The next zone of demand is 22692-916. If the Comp closes below that zone, we can assume the supply side is in control and it would trigger a move in my portfolio risk limit to 1/2RP. On a close below 21898 the long term uptrend is likely under significant pressure = ⚠️. 23722-24020 is the nearest critical zone of supply — the Comp must close within/above this zone with a strong demand-side candle to confirm the demand-side is unequivocally back in control of the Comp's price. If so, then it would trigger a move to FRP (i.e., Full Risk Position of 100% invested! 🤞).
S&P/ASX 200 (XJO)
%20chart_4%20Feb.png)
Analysis
I can’t remember the last time the Comp and the ASX 200 logged such opposing signals in their candles — at least, not with us shooting the lights out after they were so terrible!
But! You can definitely chalk one up for the Old Tin Pot today! 💪
That’s a very decent candle. Improving on yesterday — and as I requested yesterday — recouping most of the 8972 to 8746 pullback.
8979 still looms a little large… Price action and volume showed us there was some very decent supply that originated from there just a few candles ago. Today’s strong close, however, implies that it no longer appears active around that level.
Can I call it a "stunning" turnaround? 🤔
It’s hard to be stunned by anything in markets these days… But let’s go with “unexpected”, or how about “LOTN”! (Less Often Than Not!)
But it’s happening. And assuming the Comp / US markets more generally don’t blow up to derail our budding short term uptrend again… one probably should close one’s eyes and just go with it! 🙈
Okay… close ‘em real tight... Hold my hand… Here we goooooo!!! 🎢
View
I remain comfortable at 2/3RP 🪣 (i.e., my personal allowable capital allocation limit for my investments in Australian stocks is 67%).
Key levels
The short term trend ribbon is the closest zone of (dynamic) demand (presently 8800-8832). 8746 is the closest static point of demand. A close below the short term uptrend ribbon would neutralise the present short term uptrend, while a close below 8675 almost certainly would end it. The October all-time highs around 9110-9116 is the next key zone of supply.
💥 NEW VIDEO DROPPED 💥
ChartWatch *LIVE* Webinar
ChartWatch *LIVE* Webinars – WEEKLY Wednesday's @ 12pm AEDT
Learn more about technical analysis and trend following through real case studies on ASX stocks. Australia's premier technical analyst, Carl Capolingua, shares his unique insights on stocks as requested by viewers. Ask about a company in your portfolio or anything related to trading and investing and get Carl's expert opinion.
Places are limited so >REGISTER NOW!<
Economy
Today
There were no major economic news events in our time zone today.
Later this week
Thursday
11:30 AUS February Goods Trade Balance (+3.45 billion m/m forecast and +2.94 billion m/m in January)
Tentative AUS February NAB Quarterly Business Confidence
Friday
9:30 AUS RBA Gov Bullock Speaks
Saturday
12:30 USA January Non-farm Payrolls
Employment Change: +67,000 forecast vs +50,000 in December
Unemployment Rate: +4.4% forecast vs 4.4% in December
Latest News
Interesting Movers
Trading higher
+14.9% West Wits Mining (WWI) – No news, general strength across the broader Gold sector today, rise is consistent with prevailing short and long term uptrends, a regular in ChartWatch ASX Scans Uptrends list 🔎📈
+9.2% New Murchison Gold (NMG) – No news, general strength across the broader Gold sector today, rise is consistent with prevailing short and long term uptrends, a regular in ChartWatch ASX Scans Uptrends list 🔎📈
+9.0% Yancoal Australia (YAL) – No news, general strength across the broader Energy sector today.
+9.0% Minerals 260 (MI6) – No news, general strength across the broader Gold sector today, rise is consistent with prevailing short and long term uptrends, a regular in ChartWatch ASX Scans Uptrends list 🔎📈
+8.9% Silver Mines (SVL) – No news, general strength across the broader Silver sector today, rise is consistent with prevailing short and long term uptrends, a regular in ChartWatch ASX Scans Uptrends list 🔎📈
+8.6% Manuka Resources (MKR) – No news since 3-Feb Corporate Presentation at the BOEQ Conference, general strength across the broader Gold sector today, rise is consistent with prevailing short and long term uptrends, a regular in ChartWatch ASX Scans Uptrends list 🔎📈
+8.2% Boab Metals (BML) – No news, general strength across the broader Silver sector today.
+7.0% African Gold (A1G) – No news, general strength across the broader Gold sector today, today’s move is consistent with recent volatility, a regular in ChartWatch ASX Scans Uptrends list 🔎📈
+6.2% South32 (S32) – No news, general strength across the broader Resources sector today, rise is consistent with prevailing short and long term uptrends, a regular in ChartWatch ASX Scans Uptrends list 🔎📈
+6.2% Northern Star Resources (NST) – No news, general strength across the broader Gold sector today.
+6.0% Elsight (ELS) – Investor Webinar Presentation.
+5.9% St Barbara (SBM) – No news, general strength across the broader Gold sector today.
+5.8% Regis Resources (RRL) – No news, general strength across the broader Gold sector today.
+5.7% New Hope Corp. (NHC) – No news, general strength across the broader Coal sector today, rise is consistent with prevailing short and long term uptrends, a recent regular in ChartWatch ASX Scans Uptrends list 🔎📈
+5.1% Coronado Global Resources (CRN) – No news, general strength across the broader Coal sector today, rise is consistent with prevailing short and long term uptrends, a recent regular in ChartWatch ASX Scans Uptrends list 🔎📈
+5.1% Global X Physical Gold (GOLD) – No news, general strength across the broader Gold sector today.
+5.0% Lynas Rare Earths (LYC) – Change in substantial holding (UBS 8.57% from 7.34%) , general strength across the broader Rare Earths & Critical Minerals sector today.
Trading lower
-15.9% Xero (XRO) – No news since 3-Feb Investor Briefing, general weakness across the broader Information Technology sector today, fall is consistent with prevailing short and long term downtrends, a regular in ChartWatch ASX Scans Downtrends list 🔎📉
-10.9% Nuix (NXL) – No news, general weakness across the broader Information Technology sector today, fall is consistent with prevailing short and long term downtrends, a regular in ChartWatch ASX Scans Downtrends list 🔎📉
-10.7% Hub24 (HUB) – No news, general weakness across the broader Information Technology sector today.
-10.7% Wisetech Global (WTC) – No news, general weakness across the broader Information Technology sector today, fall is consistent with prevailing short and long term downtrends, a regular in ChartWatch ASX Scans Downtrends list 🔎📉
-10.5% Technology One (TNE) – No news, general weakness across the broader Information Technology sector today, fall is consistent with prevailing short and long term downtrends, a regular in ChartWatch ASX Scans Downtrends list 🔎📉
-9.5% News Corp. Class B (NWS) – No news, general weakness across the broader Communication Services sector today, fall is consistent with prevailing short and long term downtrends, a regular in ChartWatch ASX Scans Downtrends list 🔎📉
-9.0% Zip Co. (ZIP) – No news, general weakness across the broader Financials sector today, fall is consistent with prevailing short and long term downtrends, a recent regular in ChartWatch ASX Scans Downtrends list 🔎📉
-8.6% 4DMEDICAL (4DX) – No news, general weakness across the broader Information Technology sector today.
-8.2% Seek (SEK) – No news, general weakness across the broader Information Technology sector today, fall is consistent with prevailing short and long term downtrends, a regular in ChartWatch ASX Scans Downtrends list 🔎📉
-8.1% Praemium (PPS) – No news since 03-Feb HY2026 Results Presentation, general weakness across the broader Information Technology sector today, fall is consistent with prevailing short and long term downtrends, added to ChartWatch ASX Scans Downtrends list yesterday 🔎📉
-7.9% Siteminder (SDR) – Ceasing to be a substantial holder from MUFG, general weakness across the broader Information Technology sector today, fall is consistent with prevailing short and long term downtrends, a regular in ChartWatch ASX Scans Downtrends list 🔎📉
-7.8% Netwealth Group (NWL) – No news, general weakness across the broader Information Technology sector today, fall is consistent with prevailing short and long term downtrends, a regular in ChartWatch ASX Scans Downtrends list 🔎📉
-7.6% Kelly Partners Group Holdings (KPG) – No news, fall is consistent with prevailing short and long term downtrends, a regular in ChartWatch ASX Scans Downtrends list 🔎📉
-7.4% Car Group (CAR) – No news, general weakness across the broader Information Technology sector today, fall is consistent with prevailing short and long term downtrends, a regular in ChartWatch ASX Scans Downtrends list 🔎📉
-7.2% REA Group (REA) – No news, general weakness across the broader Information Technology sector today, fall is consistent with prevailing short and long term downtrends, a regular in ChartWatch ASX Scans Downtrends list 🔎📉
-7.2% Block (XYZ) – No news, general weakness across the broader Information Technology sector today, fall is consistent with prevailing short and long term downtrends, a regular in ChartWatch ASX Scans Downtrends list 🔎📉
-7.1% Bravura Solutions (BVS) – No news, general weakness across the broader Information Technology sector today, fall is consistent with prevailing short and long term downtrends, a regular in ChartWatch ASX Scans Downtrends list 🔎📉
-6.6% Catapult Sports (CAT) – No news, general weakness across the broader Information Technology sector today, fall is consistent with prevailing short and long term downtrends, a regular in ChartWatch ASX Scans Downtrends list 🔎📉
-6.5% Temple & Webster Group (TPW) – No news, general weakness across the broader Consumer Discretionary sector today, fall is consistent with prevailing short and long term downtrends, a regular in ChartWatch ASX Scans Downtrends list 🔎📉
Broker Moves
Ampol (ALD)
Retained at overweight at Morgan Stanley; Price Target: $34.46
Atlas Arteria (ALX)
Retained at equal-weight at Morgan Stanley; Price Target: $5.06 from $5.09
Amcor Plc (AMC)
Retained at buy at Citi; Price Target: $75.00
ANZ Group Holdings (ANZ)
Retained at neutral at Macquarie; Price Target: $36.00
Aurizon Holdings (AZJ)
Retained at outperform at Macquarie; Price Target: $3.77 from $3.70
Bendigo and Adelaide Bank (BEN)
Retained at underperform at Macquarie; Price Target: $10.00
Bellevue Gold (BGL)
Retained at outperform at Macquarie; Price Target: $2.00
BHP Group (BHP)
Retained at neutral at Macquarie; Price Target: $48.00
Boab Metals (BML)
Retained at buy at Shaw and Partners; Price Target: $1.76 from $1.08
Bank of Queensland (BOQ)
Retained at neutral at Macquarie; Price Target: $6.50
Beach Energy (BPT)
Retained at underweight at Morgan Stanley; Price Target: $1.08
Commonwealth Bank of Australia (CBA)
Retained at underperform at Macquarie; Price Target: $120.00
Credit Corp Group (CCP)
Retained at positive at E&P; Price Target: $22.88 from $26.35
Retained at buy at Jefferies; Price Target: $17.00 from $19.65
Retained at overweight at JPMorgan; Price Target: $19.60
Retained at buy at Morgans; Price Target: $19.35 from $21.50
Cochlear (COH)
Retained at neutral at Citi; Price Target: $300.00
Capstone Copper Corp. (CSC)
Retained at outperform at Macquarie; Price Target: $17.00
Catalyst Metals (CYL)
Retained at buy at Morgans; Price Target: $14.56 from $12.51
DPM Metals Inc. (DPM)
Retained at outperform at Macquarie; Price Target: $52.00
Evolution Mining (EVN)
Retained at underperform at Macquarie; Price Target: $10.20
Fortescue (FMG)
Retained at underperform at Macquarie; Price Target: $21.00
Golden Horse Minerals (GHM)
Retained at buy at Shaw and Partners; Price Target: $1.50 from $1.22
Gemlife Communities Group (GLF)
Retained at neutral at Citi; Price Target: $5.60
Genesis Minerals (GMD)
Retained at buy at Shaw and Partners; Price Target: $10.00 from $5.40
Image Resources NL (IMA)
Retained at outperform at Macquarie; Price Target: $0.10 from $0.13
Judo Capital Holdings (JDO)
Retained at outperform at Macquarie; Price Target: $2.00
Karoon Energy (KAR)
Retained at equal-weight at Morgan Stanley; Price Target: $1.93
LGI (LGI)
Retained at buy at Bell Potter; Price Target: $4.70 from $4.88
Magnetic Resources NL (MAU)
Retained at buy at Shaw and Partners; Price Target: $4.00 from $3.97
Meeka Metals (MEK)
Retained at buy at Morgans; Price Target: $0.40 from $0.30
Macquarie Group (MQG)
Retained at equal-weight at Morgan Stanley; Price Target: $225.00 from $221.00
National Australia Bank (NAB)
Retained at outperform at Macquarie; Price Target: $45.00
Newmont Corporation (NEM)
Retained at outperform at Macquarie; Price Target: $175.00
New Hope Corporation (NHC)
Retained at underperform at Macquarie; Price Target: $4.00
Northern Star Resources (NST)
Retained at outperform at Macquarie; Price Target: $31.00
Nufarm (NUF)
Retained at neutral at Citi; Price Target: $2.55
Origin Energy (ORG)
Retained at underweight at Morgan Stanley; Price Target: $10.88 from $11.11
PMET Resources Inc (PMT)
Retained at speculative buy at Canaccord Genuity; Price Target: $0.95
Pinnacle Investment Management Group (PNI)
Retained at outperform at Macquarie; Price Target: $25.25 from $26.55
Qoria (QOR)
Retained at buy at Ord Minnett; Price Target: $0.76
Retail Food Group (RFG)
Retained at buy at Shaw and Partners; Price Target: $2.00
Ramsay Health Care (RHC)
Retained at neutral at Citi; Price Target: $39.00
Ramelius Resources (RMS)
Retained at buy at Shaw and Partners; Price Target: $6.50 from $4.19
South32 (S32)
Retained at neutral at Macquarie; Price Target: $4.60
Sandfire Resources (SFR)
Retained at neutral at Macquarie; Price Target: $19.60
Santana Minerals (SMI)
Retained at buy at Shaw and Partners; Price Target: $2.15 from $1.63
Santos (STO)
Retained at equal-weight at Morgan Stanley; Price Target: $7.37
Telix Pharmaceuticals (TLX)
Retained at buy at Citi; Price Target: $34.00
Viva Energy Group (VEA)
Retained at equal-weight at Morgan Stanley; Price Target: $2.47
Westpac Banking Corporation (WBC)
Retained at underperform at Macquarie; Price Target: $35.00
Woodside Energy Group (WDS)
Retained at equal-weight at Morgan Stanley; Price Target: $26.63
Xero (XRO)
Retained at outperform at CLSA; Price Target: $179.00 from $221.00
Retained at hold at Jefferies; Price Target: $100.70 from $135.50
Retained at overweight at JPMorgan; Price Target: $165.00 from $180.00
Retained at outperform at Macquarie; Price Target: $233.80 from $230.30
Retained at buy at Ord Minnett; Price Target: $150.00 from $200.00
Retained at buy at UBS; Price Target: $174.00
Scans
Top Gainers
Code | Company | Last | % Chg |
|---|---|---|---|
| XPN | Xpon Technologies Group Ltd | $0.025 | +38.89% |
| NAG | Nagambie Resources Ltd | $0.019 | +35.71% |
| AXI | Axtec Ltd | $0.017 | +30.77% |
| DWG | Dataworks Group Ltd | $0.19 | +26.67% |
| VR1 | Vection Technologies Ltd | $0.038 | +26.67% |
Top Fallers
Code | Company | Last | % Chg |
|---|---|---|---|
| BPP | Babylon Pump & Power Ltd | $0.11 | -18.52% |
| 8CO | 8COMMON Ltd | $0.027 | -18.18% |
| CYC | Cyclopharm Ltd | $0.96 | -17.95% |
| DME | Dome Gold Mines Ltd | $0.10 | -16.67% |
| T88 | Taiton Resources Ltd | $0.13 | -16.13% |
52 Week Highs
Code | Company | Last | % Chg |
|---|---|---|---|
| DWG | Dataworks Group Ltd | $0.19 | +26.67% |
| SLS | Solstice Minerals Ltd | $0.955 | +25.66% |
| TKM | Trek Metals Ltd | $0.16 | +23.08% |
| NWM | Norwest Minerals Ltd | $0.027 | +22.73% |
| AII | Almonty Industries Inc | $18.79 | +16.78% |
52 Week Lows
Code | Company | Last | % Chg |
|---|---|---|---|
| BPP | Babylon Pump & Power Ltd | $0.11 | -18.52% |
| XRO | Xero Ltd | $80.82 | -15.90% |
| SM1 | Synlait Milk Ltd | $0.45 | -13.46% |
| STH | Stepchange Holdings Ltd | $0.11 | -12.00% |
| NXL | NUIX Ltd | $1.515 | -10.88% |
Near Highs
Code | Company | Last | % Chg |
|---|---|---|---|
| AII | Almonty Industries Inc | $18.79 | +16.78% |
| IAGPF | Insurance Australia Group Ltd | $106.03 | +0.08% |
| GCI | Gryphon Capital Income Trust | $2.07 | 0.00% |
| VVLU | Vanguard Global Value Equity Active ETF | $80.75 | -0.05% |
| IHD | iShares S&P/ASX DIV Opportunities Esg Screened ETF | $16.86 | +1.20% |
Relative Strength Index (RSI) Oversold
Code | Company | Last | % Chg |
|---|---|---|---|
| DGGF | Betashares Ethical Diversified Growth ETF | $27.50 | -0.97% |
| XYZ | Block, Inc | $79.77 | -7.21% |
| JPEQ | Jpmorgan US 100Q Equity Premium Income Active ETF | $59.43 | -1.79% |
| FANG | Global X Fang+ ETF | $31.53 | -2.93% |
| ETHI | Betashares Global Sustainability Leaders ETF | $15.34 | -2.17% |
