
News | Market Wraps
Evening Wrap: ASX 200 surges 161 points as Wall Street tech rebound lifts local software stocks, CAR +10% on results
The S&P/ASX 200 closed 161.3 points higher, up +1.85%.

Mentioned
The S&P/ASX 200 closed 161.3 points higher, up +1.85%.
The ASX 200 surged 1.8% for its "best session since April 2025", snapping back hard after Friday’s "worst day since November" as Wall Street steadied and bargain hunters piled into last week’s laggards.
All 11 major ASX sector indices (plus the Gold Sub-Index (XGD) (+5.5%)) finished higher, a welcome reset after Friday's broad collapse.
Information Technology (XIJ) (+3.3%) led the rebound as battered software and data centre names saw fresh demand, with NextDC (NXT) (+4.8%) and Wisetech (WTC) (+3.5%) among the standouts.
Healthcare (XHJ) (+0.5%) was once again the least-best performer for the second consecutive session, but it still managing to just stay above water.
Resources (XJR) (+2.8%) and Energy (XEJ) (+1.7%) also bounced, as the market tried to consolidate after slicing through key short term levels last week.
In stock-specific news, CAR Group (CAR) (+9.9%) jumped after a strong first half FY26 results and a reaffirmed full-year outlook. Management reported proforma revenue was up 13% to $626m and proforma EBITDA of $339m was 12% higher.
In commodities, the silver spot price climbed 5%, lifting Sun Silver (SS1) (+16.3%), Investigator Resources (IVR)(+15.0%), and Unico Silver (USL) (+13.8%).
In another total and utter about-face of Friday's demolition, uranium, lithium, and critical minerals stocks also spiked. Paladin (PDN) (+4.5%), Elevra Lithium (ELV) (+12.0%) and Lynas Rare Earths (LYC) (+3.9%) were notable, respectively, there.
Be sure to click/scroll through for the usual reporting of the major sector and stock-specific moves, the broker responses to them, as well as all the key economic data in tonight's Evening Wrap.
Also, I have detailed technical analysis on the Nasdaq Composite and the S&P/ASX 200 in today's ChartWatch.
Let's dive in!
Today in Review
Mon 09 Feb 26, 5:26pm (AEST)
Name | Value | % Chg |
|---|---|---|
Major Indices | ||
| ASX 200 | 8,870.1 | +1.85% |
| All Ords | 9,131.1 | +1.97% |
| Small Ords | 3,698.8 | +3.60% |
| All Tech | 2,893.7 | +3.73% |
| Emerging Companies | 3,117.6 | +5.21% |
Currency | ||
| AUD/USD | 0.7036 | +0.31% |
US Futures | ||
| S&P 500 | 6,958.25 | +0.08% |
| Dow Jones | 50,270.0 | +0.13% |
| Nasdaq | 25,187.5 | +0.10% |
Name | Value | % Chg |
|---|---|---|
Sector | ||
| Information Technology | 1,783.9 | +3.31% |
| Real Estate | 3,803.3 | +3.14% |
| Materials | 22,962.8 | +2.99% |
| Industrials | 8,341.8 | +1.81% |
| Energy | 9,262.9 | +1.79% |
| Consumer Discretionary | 3,969.1 | +1.70% |
| Utilities | 9,374.9 | +1.24% |
| Financials | 9,422.0 | +1.24% |
| Consumer Staples | 11,910.0 | +0.99% |
| Communication Services | 1,658.4 | +0.88% |
| Health Care | 33,835.0 | +0.58% |
Markets
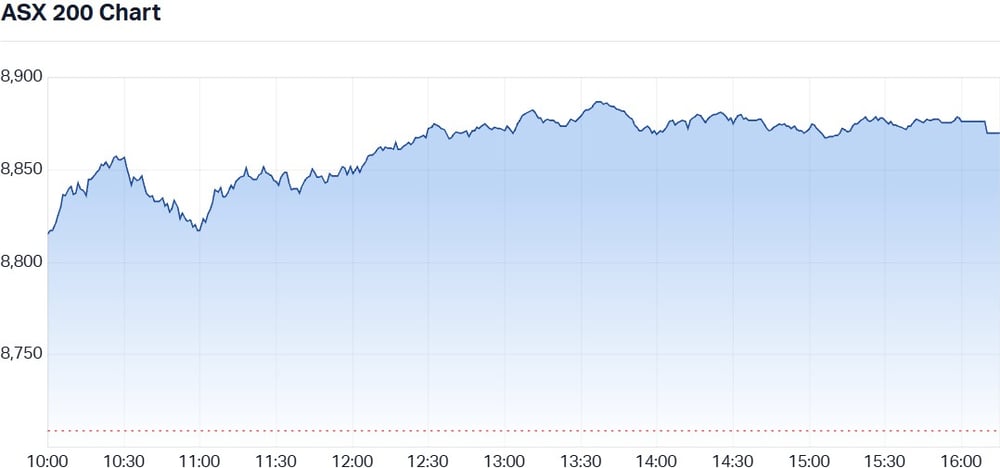
ASX 200 Session Chart
The S&P/ASX 200 (XJO) finished 161.3 points lower at 8,870.1, 1.85% from its session low and just 0.19% from its session high. In the broader-based S&P/ASX 300 (XKO), advancers thumped decliners by a convincing 252 to 27.
Fund flows: Welcome to the jungle — We've got fun and games! 🐒
Friday was the worst one-day percentage fall on the ASX 200, aka the Old Tin Pot, since April’s Trump Tariff Tumult. Today, Monday, is the best one-day percentage gain for the OTP since April’s TTT.
Two days.
Separated by zero time in terms of local economics and earnings drivers.
But it seems, separated by eons in terms of US stock market shenanigans! 🤦
Oh well — there’s no point complaining about how volatile stuff is (nor how ridiculous!).
Can’t tell the future…
What is, is… And all that stuff…
Simply, we must now do the work… And get on with it! ⚒️
The big question I guess we must answer is this:
Is today’s rally the “right” move for stocks… i.e., the one that if we look back in a few weeks we’ll say: “That was the definitive point in the last few weeks’ uptrend”?
Or is it the stuff that came before today, i.e., Friday’s candle’s rout and the supply-side controlled lead up to it? Will we be looking back at today and wishing we’d all used it to sell out of our last holdings of risk? 🤔
That’s the million dollar question!
Hey, don’t ask me… I can’t tell the future… Remember!?
Heck, what do you think? No seriously, I want to know… Quiz below… Tell me / all of us what you think!
When I’m posed with a question like the one above that’s so difficult to answer, my approach is: Best to reduce portfolio risk until the market can figure out what it wants to do.
It’s never “all out” and wait and see — that would be foolish… There’s still a very sound long term uptrend in place.
Similarly, it can never be “all in” and wait and see — for that would be foolish too… There’s still a substantial amount of evidence of supply-side control in the short term trend of the Nasdaq Composite — the home of some of America’s greatest mega-cap tech companies that shaped the post-pandemic bull run — to warrant gay abandon. (As much as my 14-year old will chuckle at that last phrase… Last I checked, it still refers to: “acting in a completely carefree, uninhibited, and unrestrained manner, often without regard for consequences!”
Given, as you know based on ChartWatch below, I’m already at 50-50 invested-vs-cash with respect to my Portfolio Risk Limit — there’s little more for me to do but sit on my hands for the time being — even after today’s face-melting rip higher! 🔥🔥🔥
But this hints at my discomfort — because in investing terms as well as literally speaking, sitting square-whack on the fence can be a rather uncomfortable experience! Ow! Move over! ☹️
A comment about Fund Flows today…
Gold is back… Better than I expected — as in, I felt the 30-Jan wipe out would have longer lasting effects in terms of suppressing demand and supply. Unlike silver, who’s short term trend ribbon was obliterated, gold’s short term trend was only probed. The candles since show a credible resumption of demand and only moderate supply-side engagement so far.
%20COMEX%20chart_9%20Feb.png)
Gold Futures (Front month, back-adjusted) COMEX
Clearly, 5627 is the big show from here, and we must be vigilant with respect to shows of supply side motivation and size from now on. Here, we’re on the lookout for long supply-side candles (i.e., long black-bodies and or long upward pointing shadows) accompanied by substantially above average volume.
How long should the candles be? Again, substantially above average — this would scream that something unusual is afoot! ⚠️
Sans those signals, as in the observance of white-bodied / downward pointing shadow counterparts pushing deep into the 5114-5627 range — then you better believe it — this gold run is not over yet!
Next best today was Information Technology (XIJ) (+3.3%), but hardly of its own accord — nope, it dutifully followed moves in the US. The chart below says it all with respect to whether today’s bounce is likely a definitive low-swing-point, or merely just ebb-and-flow within the prevailing monster downtrend.
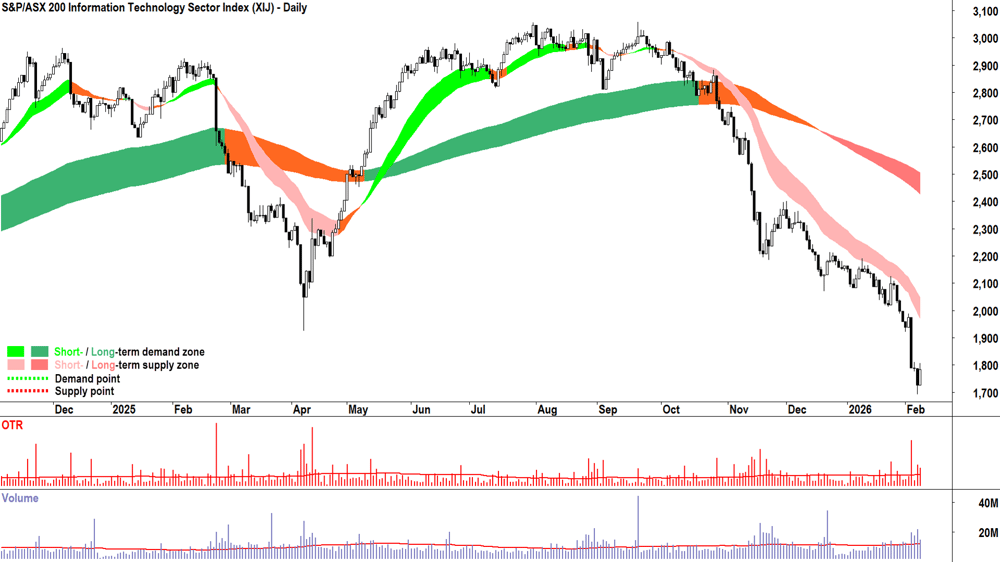
S&P-ASX 200 Information Technology Sector Index chart
Financials (XFJ) (+1.2%) and Resources (XJR) (+2.8%) — i.e., the vast bulk of the Old Tin Pot by market cap and therefore able to team up and deliver us a new all time high, even if all other sectors are going to hell in a handbasket — were both solid today.
I note that for now, like the gold chart, the XJR chart shows it’s holding its short term uptrend ribbon, and therefore also deserves the benefit of the doubt with respect to its prevailing short- and long-term uptrends…
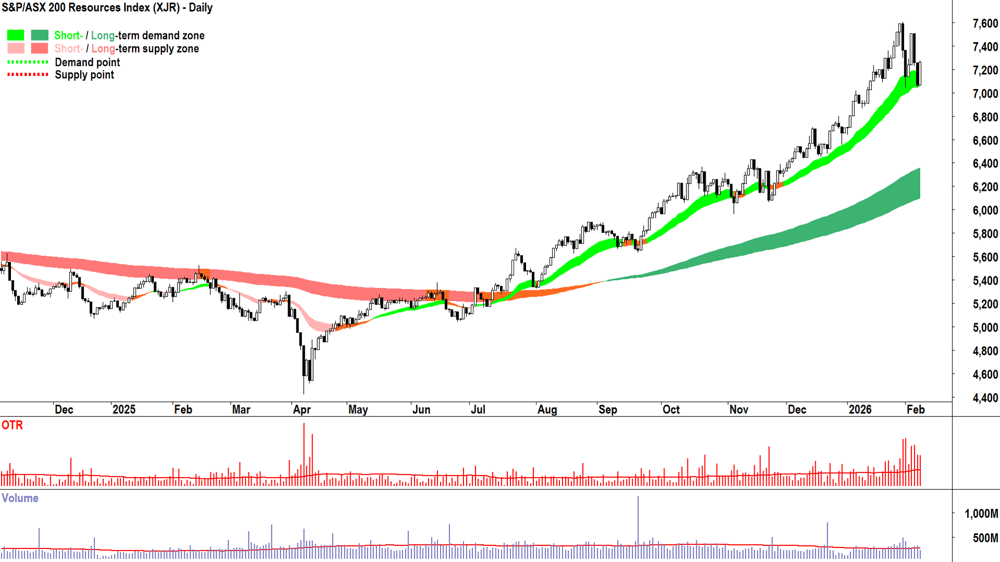
S&P-ASX 200 Resources Index chart
Despite lagging the ASX 200’s gain, the XFJ / Big 4 Banks are looking suspiciously strong again, as per the kiss-and-bounce of the long term uptrend ribbon. This sector remains the greatest “Swing” factor in determining the Old Tin Pot’s future path, and dare I say that earnings announcements could be key (see our Reporting Season Calendar).
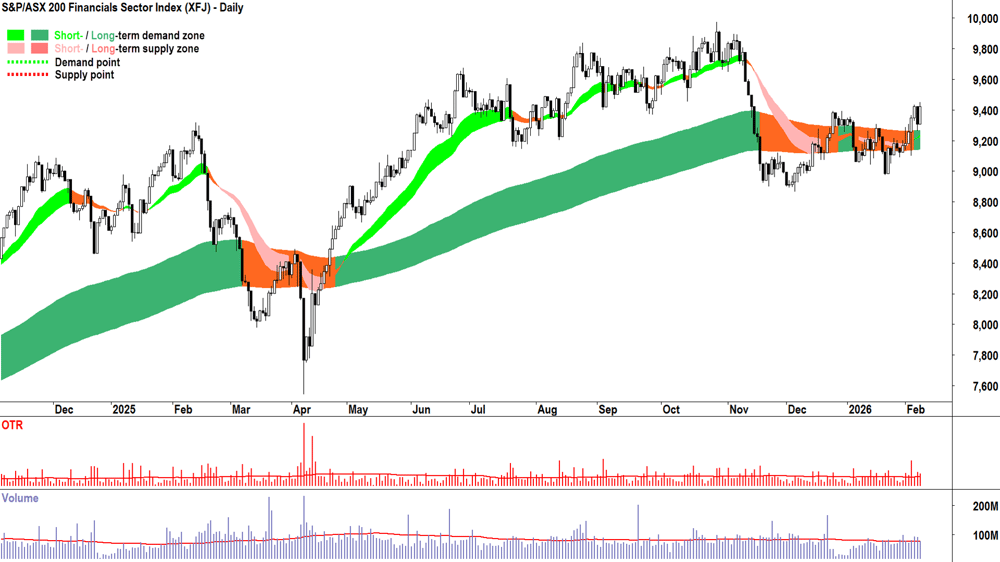
S&P-ASX 200 Financials Sector Index chart
Everything else was pretty much par for the course. I note that Consumer Discretionary (XDJ) (+1.7%), Communication Services (XTJ) (+0.9%), and Health Care (XHJ) (+0.6%) were again laggards. All ships rose today, but as is usually the case — fund flows ensured some rose far more than others! ⛵
Today's best blue chip gainers
Company | Last Price | Change $ | Change % | 1mo % | 1yr % |
|---|---|---|---|---|---|
Car Group (CAR) | $26.91 | +$2.43 | +9.9% | -11.7% | -33.2% |
Newmont Corp. (NEM) | $164.92 | +$10.12 | +6.5% | +4.8% | +135.6% |
Goodman Group (GMG) | $30.76 | +$1.87 | +6.5% | +1.2% | -13.3% |
Block (XYZ) | $81.51 | +$4.91 | +6.4% | -23.7% | -41.5% |
Dyno Nobel (DNL) | $3.38 | +$0.19 | +6.0% | +0.6% | +13.4% |
Perseus Mining (PRU) | $5.64 | +$0.3 | +5.6% | -1.4% | +94.5% |
Ramelius Resources (RMS) | $4.58 | +$0.24 | +5.5% | +10.1% | +74.8% |
Pinnacle Investment (PNI) | $18.44 | +$0.95 | +5.4% | +5.7% | -29.2% |
Nextdc (NXT) | $13.33 | +$0.62 | +4.9% | +4.1% | -10.9% |
Capricorn Metals (CMM) | $13.58 | +$0.62 | +4.8% | -2.9% | +70.2% |
Evolution Mining (EVN) | $14.98 | +$0.64 | +4.5% | +17.6% | +154.8% |
Sandfire Resources (SFR) | $19.37 | +$0.82 | +4.4% | +3.0% | +92.5% |
Downer EDI (DOW) | $7.88 | +$0.33 | +4.4% | -0.6% | +39.0% |
Lynas Rare Earths (LYC) | $14.82 | +$0.55 | +3.9% | +4.1% | +134.9% |
SGH (SGH) | $47.77 | +$1.72 | +3.7% | -0.5% | -2.5% |
James Hardie Industries (JHX) | $33.63 | +$1.17 | +3.6% | +9.0% | -36.0% |
Wisetech Global (WTC) | $49.30 | +$1.7 | +3.6% | -27.8% | -59.0% |
Northern Star Resources (NST) | $27.72 | +$0.95 | +3.5% | +12.7% | +55.9% |
Technology One (TNE) | $22.63 | +$0.77 | +3.5% | -18.0% | -28.6% |
Orica (ORI) | $26.03 | +$0.87 | +3.5% | +0.2% | +50.8% |
Today's worst blue chip losers
Company | Last Price | Change $ | Change % | 1mo % | 1yr % |
|---|---|---|---|---|---|
Challenger (CGF) | $8.60 | -$0.32 | -3.6% | -8.7% | +41.4% |
Brambles (BXB) | $23.16 | -$0.35 | -1.5% | +2.5% | +20.6% |
Seek (SEK) | $18.07 | -$0.24 | -1.3% | -22.9% | -21.6% |
Lendlease Group (LLC) | $4.53 | -$0.04 | -0.9% | -10.3% | -29.9% |
REA Group (REA) | $167.12 | -$0.98 | -0.6% | -8.7% | -33.6% |
AGL Energy (AGL) | $8.90 | -$0.05 | -0.6% | -2.7% | -23.8% |
ASX (ASX) | $56.06 | -$0.23 | -0.4% | +7.5% | -9.0% |
Sigma Healthcare (SIG) | $3.12 | -$0.01 | -0.3% | +8.3% | +11.0% |
JB HI-FI (JBH) | $80.39 | -$0.23 | -0.3% | -14.0% | -20.7% |
Sonic Healthcare (SHL) | $21.98 | -$0.04 | -0.2% | -1.6% | -22.0% |
CSL (CSL) | $180.37 | -$0.13 | -0.1% | +3.4% | -33.3% |
Vicinity Centres (VCX) | $2.51 | $0 | 0% | -3.8% | +15.7% |
Cleanaway Waste Management (CWY) | $2.41 | $0 | 0% | -7.3% | -10.7% |
Telstra Group (TLS) | $4.88 | $0 | 0% | +1.7% | +23.9% |
Telix Pharmaceuticals (TLX) | $9.86 | +$0.01 | +0.1% | -13.0% | -66.2% |
Amcor PLC (AMC) | $68.95 | +$0.13 | +0.2% | +9.7% | -14.7% |
Soul Patt's (SOL) | $37.10 | +$0.09 | +0.2% | -2.7% | +11.2% |
The Lottery Corp. (TLC) | $5.26 | +$0.02 | +0.4% | +3.1% | +7.8% |
Insurance Australia Group (IAG) | $7.76 | +$0.03 | +0.4% | -2.5% | -11.6% |
Suncorp Group (SUN) | $16.76 | +$0.07 | +0.4% | -3.1% | -14.8% |
ChartWatch
Nasdaq Composite Index
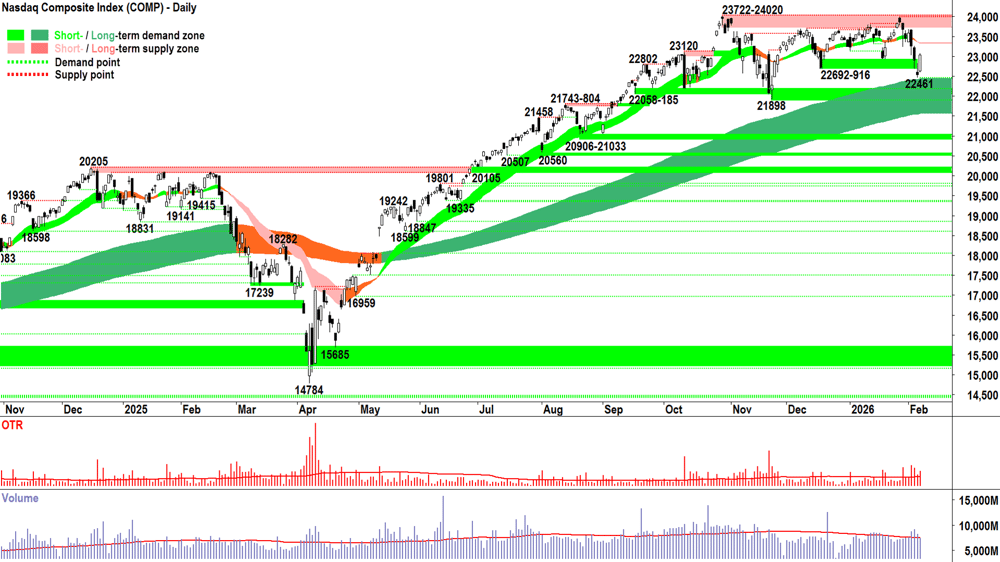
Analysis
If I made one error / omission in Friday’s Comp analysis it was this:
Never underestimate the power of the long term uptrend ribbon to trigger a bounce! 💪
Given how dominant the supply-side’s control appeared after Thursday’s candle, the prospect of such an emphatic bounce on Friday just didn’t occur to me!
Now, I’m not for one second trying to say that the long term trend ribbon caused Friday’s miraculous recovery... A recovery that really had no clear catalyst apart from (according to the financial press on Saturday morning): “Stocks were down 3 days in a row… So they rallied!”
The Comp’s bounce from its long term uptrend ribbon is pure coincidence, indeed. But if you’ve been using my ribbons for any length of time, you’ll know that there have been many similar coincidences at the Comp’s long term trend ribbon — and on pretty much anything you care to stick my long term trend ribbon on! 🎯
“No reason” for Friday’s the bounce… That’s a contentious one… and perhaps somewhat of a bitter statement by me given that on Friday, I officially moved to a 1/2RP Portfolio Risk Limit based on Thursday’s ominous set of trends, price action, candles, and volume. (=⚠️⚠️⚠️)
Which gets me to the issue of where to next? What’s the MOTN (More Often Than Not) scenario from here:
Continue bouncing hard of the long term uptrend ribbon, FOMO and HOFU kick back in, and we have another crack at the 23722-24020 (bullet proof!) supply zone? 🤔
Or hit the short term downtrend ribbon (yes, it’s now pink = downtrend), which acts as a zone of dynamic supply, then make another lower peak, and then retest the demand at the long term uptrend ribbon? 🤔
Neither of us can possibly know which scenario is going to play out… But we do know what candles to watch out for if either one is to transpire. And that’s a very good thing indeed. ✅
View
On the fence… Shifting uncomfortably between the pickets! I am at 1/2RP portfolio risk limit 🪣 (RP = Risk Position — it reflects my personal allowable capital allocation limit for my investments in US stocks. So 1/2RP is 50%, 2/3RP is 67% and FRP is 100%).
Key levels
22461 is the new critical point of demand. If the Comp closes below that price, we can assume the supply side is very much in control. On a close below 21898 the long term uptrend is likely under significant pressure = ⚠️. 23722-24020 is the nearest critical static zone of supply, but the short term downtrend ribbon (presently 23330-23345) may also impede upside price action.
S&P/ASX 200 (XJO)
%20chart_9%20Feb.png)
Analysis
As the 1980’s philosopher Axel Rose once said: "Welcome to the jungle investors… We’ve got fun and games!!!"
GNR foreva!!! 💪
Friday = Big black candle, close near low. ⬛🕯️
Monday = Big white candle, roughly the same size… Close near high. ⬜🕯️
Check out the OTR (Optimised True Range) on both — we’re talking nearly triple the average daily true range over the last two trading sessions = NOT NORMAL!
Interestingly, volume was substantially higher on Friday’s wipeout than on today’s miraculous recovery.
What does it all mean Basil?
My take is this:
Friday was driven by some proper risk off stuff… something spooked the global fund managers, and they wanted out of risk assets like stocks in a hurry… Price didn’t matter so much as getting their orders filled… i.e., contributing to the massive black candle (= motivation) and above average volume (= size). Candle + Volatility + Volume = Supply-side control = ⚠️
Today was driven by the fact that whatever risk event feared on Friday (i.e., geopolitical, political, earnings, credit crunch-vs-exposure… Who knows what… 🤷?) clearly didn’t transpire over the weekend. So, the fundies had to cover short positions in terms of holding less exposure than benchmark weightings — or literal short positions aimed at profiting from expected lower prices.
Today’s long white candle suggests that motivation was high among the traders scrambling to re-risk, but positional buying, i.e., the important buy the dip and hold for the long term stuff that usually carries significant size — was possibly lacking (hence only below-average volume).
Or there could be some other explanation. What do I know!? 😉
Let’s wait for some confirmation either way. 8944-8979 is the clear supply zone to watch. A close above there would be both impressive and a signal that 9110-9116 is possible.
Alternatively, the long term uptrend ribbon is critical now… much like it is on the Comp. A close below it (in either case) would likely be lights out for the current bull market.
View
On the fence here too… let’s hope we’re not stuck here for too long! I am at 1/2RP portfolio risk limit 🪣 (i.e., my personal allowable capital allocation limit for my investments in Australian stocks is now 67%).
Key levels
8675 is the closest point of demand, but far more important, is the dynamic demand we'd typically associate with the long term trend ribbon (presently 8614-8717) . A close below 8614 would neutralise the present long term uptrend. 8944-8979 is the next key zone of supply.
ChartWatch *LIVE* Webinar
ChartWatch *LIVE* Webinars – WEEKLY Wednesday's @ 12pm AEDT
Learn more about technical analysis and trend following through real case studies on ASX stocks. Australia's premier technical analyst, Carl Capolingua, shares his unique insights on stocks as requested by viewers. Ask about a company in your portfolio or anything related to trading and investing and get Carl's expert opinion.
Places are limited so >REGISTER NOW!<
Economy
Today
10:30 AUS February Westpac Consumer Sentiment (-1.7% m/m in December)
14:30 AUS February NAB Business Confidence
Later this week
Tuesday
22:00 USA January NFIB Small Business Index (99.9 forecast vs 99.5 in December)
Wednesday
00:30 USA January Core Retail Sales m/m (+0.4% m/m forecast vs +0.5% m/m in December)
00:30 USA January Employment Cost Index q/q (+0.8% m/m forecast vs +0.8% m/m in December)
12:30 AUS RBA Deputy Gov Hauser Speaks
Thursday
00:30 USA January Non-Farm Payrolls
Employment Change: 70k m/m forecast vs 50k m/m in December
Average Hourly Earnings: +0.3% m/m forecast vs +0.3% m/m in December
Unemployment Rate: +4.4% forecast vs +4.4% in December
Friday
00:30 USA Weekly Unemployment Rate (222k forecast vs 231k in December)
02:30 AUS CB Leading Index m/m (+0.2% in December)
Saturday
00:30 USA January Core Consumer Price Index (CPI) (+0.3% m/m forecast vs +0.2% m/m in December)
Latest News
Interesting Movers
Trading higher
+29.4% Bravura Solutions (BVS) – Guidance Update and Change in substantial holding (Camac Fund 7% from 6%), general strength across the broader Information Technology sector today.
+28.4% Pepper Money (PPM) – Response to media speculation.
+18.6% Web Travel Group (WEB) – Bounced after sharp falls on Friday due to Response to ASX Price Query and Receipt of audit notice, general strength across the broader Information Technology sector today.
+16.3% Sun Silver (SS1) – No news, general strength across the broader Silver sector today.
+16.3% Metallium (MTM) – No news, general strength across the broader Critical Minerals sector today.
+16.0% Manuka Resources (MKR) – No news, general strength across the broader Silver sector today.
+15.6% BetaShares Crypto Innovators ETF (CRYP) – No news (large rebound in major cryptocurrencies over the weekend).
+15.0% Investigator Resources (IVR) – No news, general strength across the broader Silver sector today.
+15.0% Weebit Nano (WBT) – No news, general strength across the broader Information Technology sector today.
+14.9% Resolution Minerals (RML) – New Gold Discovery at Golden Gate South, general strength across the broader Gold sector today.
+14.1% Minerals 260 (MI6) – Minerals 260 Appoints Adam Smits as Non-Executive Director, general strength across the broader Precious Metals sector today.
+13.8% Unico Silver (USL) – No news, general strength across the broader Silver sector today.
+13.8% Appen (APX) – No news, general strength across the broader Information Technology sector today.
+13.0% Energy One (EOL) – No news, general strength across the broader Defence sector today.
+12.9% Boab Metals (BML) – No news, general strength across the broader Silver sector today.
+10.0% Car Group (CAR) – FY26 Half Year Results Presentation.
Trading lower
-5.1% (HMC) – Continued negative response to 06-Feb Energy Transition Strategic Partnership with KKR, fall is consistent with prevailing short and long term downtrends, a regular in ChartWatch ASX Scans Downtrends list 🔎📉
-5.1% BetaShares US EQY Strong Bear CCY H Complex ETF (BBUS) – No news (short US stocks ETF).
-5.0% Australian Clinical Labs (ACL) – No news, fall is consistent with prevailing short and long term downtrends, a regular in ChartWatch ASX Scans Downtrends list 🔎📉
-4.3% BetaShares Australian Equities Strong Bear Complex ETF (BBOZ) – No news (short ASX stocks ETF).
-3.8% Tungsten Mining (TGN) – Tungsten Mining Finalises $53M Placement.
-3.6% Challenger (CGF) – Response to speculation on acquisition of Pepper Money.
-3.3% Ioneer (INR) – Change in substantial holding (The Bank of New York Mellon Corporation 7% from 8.5%).
Broker Moves
Life360 Inc (360)
Retained at buy at Bell Potter; Price Target: $41.50 from $45.00
Aeris Resources (AIS)
Retained at outperform at Macquarie; Price Target: $0.70
Aurelia Metals (AMI)
Retained at outperform at Macquarie; Price Target: $0.40
AMP (AMP)
Retained at neutral at UBS; Price Target: $1.90
ANZ Group Holdings (ANZ)
Retained at buy at Citi; Price Target: $40.30
Retained at sell at UBS; Price Target: $35.00
Bendigo and Adelaide Bank (BEN)
Retained at underweight at Morgan Stanley; Price Target: $10.40 from $9.60
Retained at neutral at UBS; Price Target: $10.95
Bellevue Gold (BGL)
Retained at outperform at Macquarie; Price Target: $2.10 from $2.00
BHP Group (BHP)
Retained at neutral at Macquarie; Price Target: $51.00 from $48.00
Boss Energy (BOE)
Retained at neutral at UBS; Price Target: $1.60 from $1.30
Bank of Queensland (BOQ)
Retained at equal-weight at Morgan Stanley; Price Target: $7.00 from $6.80
Retained at buy at UBS; Price Target: $7.50
CAR Group (CAR)
Retained at buy at Citi; Price Target: $39.95 from $39.65
Commonwealth Bank of Australia (CBA)
Retained at sell at UBS; Price Target: $125.00
Champion Iron (CIA)
Retained at neutral at Macquarie; Price Target: $6.25 from $5.75
Carnaby Resources (CNB)
Retained at outperform at Macquarie; Price Target: $0.70
Computershare (CPU)
Retained at neutral at UBS; Price Target: $36.20
Charter Hall Retail REIT (CQR)
Retained at neutral at Macquarie; Price Target: $4.15
Retained at equal-weight at Morgan Stanley; Price Target: $4.35
Upgraded to accumulate from hold at Ord Minnett; Price Target: $4.10 from $4.00
Retained at neutral at UBS; Price Target: $4.09 from $4.20
Coronado Global Resources Inc (CRN)
Retained at underperform at Macquarie; Price Target: $0.40
Capstone Copper Corp. (CSC)
Retained at outperform at Macquarie; Price Target: $19.60
Centaurus Metals (CTM)
Retained at outperform at Macquarie; Price Target: $0.68
DPM Metals Inc. (DPM)
Retained at outperform at Macquarie; Price Target: $59.00 from $52.00
Elevra Lithium (ELV)
Retained at outperform at Macquarie; Price Target: $9.00 from $8.50
Evolution Mining (EVN)
Retained at underperform at Macquarie; Price Target: $11.00 from $10.20
FINEOS Corporation Holdings PLC (FCL)
Upgraded to buy from hold at Moelis Australia; Price Target: $3.27
FireFly Metals (FFM)
Retained at outperform at Macquarie; Price Target: $2.30
Fortescue (FMG)
Upgraded to neutral from underperform at Macquarie; Price Target: $22.00
Greatland Resources (GGP)
Retained at neutral at Macquarie; Price Target: $13.30 from $13.00
Global Lithium Resources (GL1)
Retained at outperform at Macquarie; Price Target: $0.65
Genesis Minerals (GMD)
Retained at buy at Citi; Price Target: $10.10
Retained at outperform at Macquarie; Price Target: $9.40 from $8.70
GQG Partners Inc. (GQG)
Downgraded to equal-weight from overweight at Morgan Stanley; Price Target: $1.75 from $2.65
Retained at buy at UBS; Price Target: $2.10
HMC Capital (HMC)
Retained at equal-weight at Morgan Stanley; Price Target: $3.85
HUB24 (HUB)
Retained at neutral at UBS; Price Target: $107.00
Insurance Australia Group (IAG)
Retained at buy at UBS; Price Target: $9.00
IGO (IGO)
Upgraded to outperform from neutral at Macquarie; Price Target: $9.50 from $9.00
Iluka Resources (ILU)
Retained at outperform at Macquarie; Price Target: $6.50
Judo Capital Holdings (JDO)
Retained at overweight at Morgan Stanley; Price Target: $2.20 from $2.15
Retained at buy at UBS; Price Target: $2.20
Jupiter Mines . (JMS)
Retained at outperform at Macquarie; Price Target: $0.29
Lotus Resources (LOT)
Retained at speculative buy at Bell Potter; Price Target: $3.70 from $4.00
Upgraded to neutral from underweight at JPMorgan; Price Target: $2.10 from $2.06
Retained at speculative buy at Ord Minnett; Price Target: $3.90 from $4.20
Liontown (LTR)
Retained at neutral at Macquarie; Price Target: $1.75 from $1.70
Lynas Rare Earths (LYC)
Retained at outperform at Macquarie; Price Target: $17.50
Meteoric Resources NL (MEI)
Retained at outperform at Macquarie; Price Target: $0.39
Magellan Financial Group (MFG)
Retained at underweight at Morgan Stanley; Price Target: $8.10 from $7.85
Retained at neutral at UBS; Price Target: $10.00
Mineral Resources (MIN)
Retained at outperform at Macquarie; Price Target: $75.00 from $70.00
Midas Minerals (MM1)
Initiated at speculative buy at Canaccord Genuity; Price Target: $1.35
Macquarie Group (MQG)
Retained at neutral at Citi; Price Target: $210.00
Retained at buy at UBS; Price Target: $235.00
MyState (MYS)
Retained at buy at Ord Minnett; Price Target: $5.06 from $4.94
National Australia Bank (NAB)
Retained at buy at UBS; Price Target: $47.00
Newmont Corporation (NEM)
Retained at outperform at Macquarie; Price Target: $185.00 from $175.00
New Hope Corporation (NHC)
Retained at underperform at Macquarie; Price Target: $4.20 from $4.00
Nickel Industries (NIC)
Retained at outperform at Macquarie; Price Target: $1.10
Northern Star Resources (NST)
Retained at outperform at Macquarie; Price Target: $32.00 from $31.00
Netwealth Group (NWL)
Retained at neutral at UBS; Price Target: $28.50
News Corporation (NWS)
Retained at neutral at Macquarie; Price Target: $44.40 from $50.50
Retained at buy at UBS; Price Target: $65.50 from $64.40
PLS Group (PLS)
Upgraded to outperform from neutral at Macquarie; Price Target: $5.00
PMET Resources Inc (PMT)
Retained at outperform at Macquarie; Price Target: $0.70
Perpetual (PPT)
Retained at equal-weight at Morgan Stanley; Price Target: $19.70 from $22.40
Retained at neutral at UBS; Price Target: $20.60
QBE Insurance Group (QBE)
Retained at buy at UBS; Price Target: $22.50
REA Group (REA)
Retained at neutral at Jarden; Price Target: $177.00 from $196.00
Retained at overweight at JPMorgan; Price Target: $215.00 from $225.00
Retained at neutral at Macquarie; Price Target: $200.00 from $210.00
Upgraded to buy from accumulate at Morgans; Price Target: $230.00
Retained at buy at Ord Minnett; Price Target: $225.00 from $260.00
Retained at sector perform at RBC Capital Markets; Price Target: $200.00 from $225.00
Ramelius Resources (RMS)
Retained at neutral at Macquarie; Price Target: $4.80
Resolute Mining (RSG)
Retained at outperform at Macquarie; Price Target: $1.85 from $1.55
South32 (S32)
Retained at outperform at Macquarie; Price Target: $4.80 from $4.60
Sandfire Resources (SFR)
Retained at neutral at Macquarie; Price Target: $20.10
Sheffield Resources (SFX)
Retained at hold at Ord Minnett; Price Target: $0.06 from $0.11
St George Mining (SGQ)
Retained at outperform at Macquarie; Price Target: $0.20
Sigma Healthcare (SIG)
Retained at hold at Bell Potter; Price Target: $3.00 from $2.85
Suncorp Group (SUN)
Retained at buy at UBS; Price Target: $20.55
Sovereign Metals (SVM)
Retained at neutral at Macquarie; Price Target: $0.65
Turaco Gold (TCG)
Retained at outperform at Macquarie; Price Target: $1.10
Tower (TWR)
Initiated at buy at Citi; Price Target: $1.85
Westpac Banking Corporation (WBC)
Retained at neutral at UBS; Price Target: $40.00
Westgold Resources (WGX)
Retained at outperform at Macquarie; Price Target: $9.90 from $8.20
Whitehaven Coal (WHC)
Retained at neutral at Macquarie; Price Target: $10.00
Worley (WOR)
Retained at buy at Morgans; Price Target: $16.40 from $16.80
Wisetech Global (WTC)
Retained at outperform at Macquarie; Price Target: $108.50
Scans
Top Gainers
Code | Company | Last | % Chg |
|---|---|---|---|
| JAV | Javelin Minerals Ltd | $0.14 | +33.33% |
| ATS | Australis Oil & Gas Ltd | $0.025 | +31.58% |
| BVS | Bravura Solutions Ltd | $2.33 | +29.44% |
| AGD | Austral Gold Ltd | $0.225 | +28.57% |
| PPM | Pepper Money Ltd | $2.26 | +28.41% |
Top Fallers
Code | Company | Last | % Chg |
|---|---|---|---|
| I88 | Infini Resources Ltd | $0.19 | -22.45% |
| IPD | Impedimed Ltd | $0.015 | -21.05% |
| CHRCB | Charger Metals NL | $0.04 | -20.00% |
| IAM | Income Asset Management Group Ltd | $0.021 | -16.00% |
| MRZ | Mont Royal Resources Ltd | $0.215 | -14.00% |
52 Week Highs
Code | Company | Last | % Chg |
|---|---|---|---|
| TKM | Trek Metals Ltd | $0.195 | +25.81% |
| AS1 | Asara Resources Ltd | $0.12 | +14.29% |
| SNM | Sentinel Metals Ltd | $0.62 | +13.76% |
| SHN | Sunshine Metals Ltd | $0.042 | +13.51% |
| AII | Almonty Industries Inc | $19.85 | +12.27% |
52 Week Lows
Code | Company | Last | % Chg |
|---|---|---|---|
| IPD | Impedimed Ltd | $0.015 | -21.05% |
| CHRCB | Charger Metals NL | $0.04 | -20.00% |
| CLU | Cluey Ltd | $0.053 | -11.67% |
| AXP | AXP Energy Ltd | $0.012 | -7.69% |
| KNB | Koonenberry Gold Ltd | $0.026 | -7.14% |
Near Highs
Code | Company | Last | % Chg |
|---|---|---|---|
| GLPR | iShares Ftse GBL Property Ex Aus (Aud Hedged) ETF | $27.80 | +1.16% |
| AN3PI | Australia and New Zealand Banking Group Ltd | $103.801 | -0.02% |
| WVOL | iShares MSCI World Ex Aust Minimum Volatility ETF | $44.52 | 0.00% |
| AII | Almonty Industries Inc | $19.85 | +12.27% |
| IAGPF | Insurance Australia Group Ltd | $105.90 | -0.01% |
Relative Strength Index (RSI) Oversold
Code | Company | Last | % Chg |
|---|---|---|---|
| IRE | Iress Ltd | $7.59 | +1.88% |
| GAME | Betashares Video Games and Esports ETF | $15.37 | +0.39% |
| CD2 | CD Private Equity Fund Ii | $0.48 | 0.00% |
| BUGG | Global X Cybersecurity ETF | $9.30 | +1.31% |
| SEK | Seek Ltd | $18.07 | -1.31% |
