News | Market Wraps
Evening Wrap: ASX 200 fades as gold and lithium stocks melt down; futures pullback sees NEM -8%, LTR -10%
The S&P/ASX 200 closed 58.4 points lower, down 0.65%.

Mentioned
The S&P/ASX 200 closed 58.4 points lower, down 0.65%.
The ASX 200 flipped from an early gain to a sharp fade as a brutal unwind hit commodities in Asian trade, with copper, gold and silver sliding — and lithium sliding hardest, down 11% at the time of writing.
Gold stocks wore the brunt of it, with the biggest losers being Genesis Minerals (GMD) (-9.8%) and Newmont (NEM) (-8%). Lithium also caved, led by Ioneer (INR) (-26.1%) and Liontown (LTR) (-9.5%).
Potentially compounding today's bearishness more generally, late morning, reports began emerging around hawkish former US Fed governor Kevin Warsh as Trump’s likely Fed chair pick. US futures are currently trading down around 0.5%, as this pick is potentially driving a flight to safety that's pulled risk dollars out of ASX stocks and frothy commodities markets.
BHP (BHP) (-1.8%) and Fortescue (FMG) (-2.7%) as base metals stocks also retreated, while Tech continued its sell off.
In stock specific news, Nine Entertainment Co. (NEC) (+5.1%) confirmed it has sold its radio arm, including 3AW and 2GB, to Arthur Laundy for $56 million, well below the roughly $275 million valuation cited seven years ago.
Be sure to click/scroll through for the usual reporting of the major sector and stock-specific moves, the broker responses to them, as well as all the key economic data in tonight's Evening Wrap.
Also, I have detailed technical analysis on the Nasdaq Composite and the S&P/ASX 200 in today's ChartWatch.
Let's dive in!
Today in Review
Fri 30 Jan 26, 5:13pm (AEST)
Name | Value | % Chg |
|---|---|---|
Major Indices | ||
| ASX 200 | 8,869.1 | -0.65% |
| All Ords | 9,164.8 | -0.78% |
| Small Ords | 3,869.6 | -2.13% |
| All Tech | 3,126.2 | -1.80% |
| Emerging Companies | 3,266.7 | -3.86% |
Currency | ||
| AUD/USD | 0.7 | -0.70% |
US Futures | ||
| S&P 500 | 6,960.25 | -0.46% |
| Dow Jones | 48,950.0 | -0.45% |
| Nasdaq | 25,851.25 | -0.57% |
Name | Value | % Chg |
|---|---|---|
Sector | ||
| Health Care | 34,463.5 | +1.05% |
| Consumer Staples | 11,789.8 | +0.73% |
| Financials | 9,167.6 | +0.48% |
| Real Estate | 3,844.5 | +0.25% |
| Communication Services | 1,710.2 | +0.21% |
| Energy | 9,324.0 | +0.07% |
| Utilities | 9,718.7 | -0.08% |
| Industrials | 8,396.7 | -0.18% |
| Consumer Discretionary | 3,956.8 | -0.19% |
| Information Technology | 1,960.3 | -1.89% |
| Materials | 23,254.5 | -3.36% |
Markets
%20intraday%20chart_30%20Jan.png)
ASX 200 Session Chart
The S&P/ASX 200 (XJO) finished 58.4 points higher at 8,860.1, 0.28% from its session high and 0.23% from its low. In the broader-based S&P/ASX 300 (XKO) decliners beat advancers lagged decliners by a dismal 101 to 174.
For the week, the XJO finished down 113 points or 0.6% lower, 0.09% from its intraweek low and 1.18% from its intraweek high.
Fund flows: Against the flow... 🌊
On the way up, commodity bull markets are underpinned by absolute conviction in demand-side narratives. Slide decks fill with bottom-left-to-top-right forecasts stretching neatly out to the end of the decade… or the next one. Electric vehicles, AI, defence, geopolitical uncertainty — pick your theme.
The story is always compelling, the maths seems irrefutable, and belief hardens into certainty. For many investors, that certainty becomes an anchor: demand is growing, therefore prices must keep rising.
The trap, of course, is forgetting the other half of the price-setting equation: supply. Commodity markets don’t turn because demand collapses — they turn because supply arrives. New mines, expansions, substitutions, inventory releases, policy shifts.
When supply shows up, prices can fall sharply even as demand continues to grow exactly as forecast. Investors anchored to demand narratives are left scratching their heads, wondering how they “got the call right” but still lost money — often because they never sold, convinced that the story itself was enough.
But even within a bull market, the journey is rarely smooth. Pullbacks serve a purpose. They test conviction. They separate belief from blind faith. And occasionally, they arrive with real violence.
Like today. When markets wobble, everyone seems to head for the exit at once. If all are selling, none are buying = a wall of supply and a vacuum of demand — prices gap lower, and equities exaggerate every move.
(Great sigh 😔!)
And here we are: the prices of commodities such as gold, silver, copper and lithium are pulling back modestly during Asian trade — a few per cent in most cases, but with lithium closer to ten (⚠️) — while ASX-listed producers and hopefuls have generally fallen much harder.
It feels chaotic in the moment. But this, too, is part of the cycle! What we must determine as investors is whether these moments of maximum discomfort coincide with the end of a move, or merely the middle of it! 🤔
Whether today proves to be one of those moments will only be clear in hindsight. All we can do in the meantime is:
Analyse = What do the trends, price action, candles, and volume tell us about how demand and supply are interacting: Who is in control of the price? This will determine our view of the MOTN outcome (More Often Than Not).
Accept = The analysis and MOTN assessment may not coincide with our prevailing views — often anchored to our interpretation of value and or the strength of the demand-side narrative of which we’re convinced… Good traders accept MOTN doesn’t equal certainty — that it carries with it the chance of adverse outcome. But they still accept the market likely knows more than they do — and so they commit to it nonetheless!
Act = Manage risk accordingly. MOTN will imply one of three alternatives: +R (add risk), =R (maintain risk), -R (reduce risk).
Adopting such an approach doesn’t expunge emotions from our investing — but it does create a framework for managing them. We become process-focussed rather than outcomes-focused. This simply means we focus on the elements of the investing equation within our control, i.e. the application of our strategy and its execution. At the same time, we let go of the illusion that we control the outcome, i.e., where the price goes next.
Accepting we only have control over ourselves and not the outcomes — and a total dedication and focus on applying our strategy consistently — gives us the greatest chance of ensuring our outcomes are favourable over the long run.
Today's best blue chip gainers
Company | Last Price | Change $ | Change % | 1mo % | 1yr % |
|---|---|---|---|---|---|
Resmed Inc (RMD) | $37.54 | +$1.14 | +3.1% | +3.7% | -6.8% |
AMP (AMP) | $1.695 | +$0.05 | +3.0% | -7.1% | -3.7% |
Santos (STO) | $7.01 | +$0.17 | +2.5% | +14.7% | -0.1% |
Downer EDI (DOW) | $8.05 | +$0.17 | +2.2% | +0.9% | +42.5% |
Cochlear (COH) | $269.10 | +$5.25 | +2.0% | +3.3% | -14.6% |
ALS (ALQ) | $24.64 | +$0.47 | +1.9% | +11.0% | +55.8% |
Worley (WOR) | $13.41 | +$0.25 | +1.9% | +6.4% | -7.6% |
Stockland (SGP) | $5.39 | +$0.08 | +1.5% | -7.1% | +5.1% |
Telstra Group (TLS) | $4.88 | +$0.07 | +1.5% | +0.4% | +22.6% |
Pro Medicus (PME) | $184.12 | +$2.43 | +1.3% | -17.4% | -31.5% |
Mirvac Group (MGR) | $2.00 | +$0.025 | +1.3% | -2.9% | +2.6% |
Suncorp Group (SUN) | $17.00 | +$0.21 | +1.3% | -4.2% | -14.5% |
Fisher & Paykel Healthcare Corp. (FPH) | $33.65 | +$0.41 | +1.2% | +3.4% | -2.2% |
Atlas Arteria (ALX) | $4.97 | +$0.06 | +1.2% | +2.1% | +0.8% |
GPT Group (GPT) | $5.29 | +$0.06 | +1.1% | -3.8% | +16.8% |
Woolworths Group (WOW) | $30.94 | +$0.35 | +1.1% | +5.3% | +2.7% |
CSL (CSL) | $181.42 | +$2.02 | +1.1% | +5.2% | -33.4% |
Coles Group (COL) | $21.28 | +$0.23 | +1.1% | -0.8% | +9.7% |
Sonic Healthcare (SHL) | $22.95 | +$0.22 | +1.0% | +2.2% | -18.4% |
Nextdc (NXT) | $13.32 | +$0.12 | +0.9% | +6.7% | -9.7% |
Today's worst blue chip losers
Company | Last Price | Change $ | Change % | 1mo % | 1yr % |
|---|---|---|---|---|---|
Genesis Minerals (GMD) | $7.59 | -$0.83 | -9.9% | +5.4% | +153.0% |
Newmont Corp. (NEM) | $173.28 | -$15.19 | -8.1% | +16.2% | +161.8% |
Capricorn Metals (CMM) | $14.79 | -$1.26 | -7.9% | +3.4% | +95.9% |
Perseus Mining (PRU) | $5.90 | -$0.5 | -7.8% | +5.2% | +116.1% |
Sandfire Resources (SFR) | $19.85 | -$1.46 | -6.9% | +12.8% | +104.2% |
Whitehaven Coal (WHC) | $8.83 | -$0.63 | -6.7% | +13.4% | +46.0% |
PLS Group (PLS) | $4.29 | -$0.3 | -6.5% | +2.6% | +88.2% |
Evolution Mining (EVN) | $14.71 | -$1.01 | -6.4% | +17.1% | +165.0% |
Ramelius Resources (RMS) | $4.72 | -$0.32 | -6.3% | +15.4% | +103.4% |
Mineral Resources (MIN) | $57.15 | -$3.87 | -6.3% | +5.1% | +61.5% |
Life360 (360) | $27.42 | -$1.55 | -5.4% | -18.6% | +12.5% |
Telix Pharmaceuticals (TLX) | $10.55 | -$0.53 | -4.8% | -9.2% | -62.7% |
Car Group (CAR) | $27.60 | -$1.33 | -4.6% | -10.0% | -31.1% |
Lynas Rare Earths (LYC) | $14.90 | -$0.7 | -4.5% | +18.3% | +128.5% |
Eagers Automotive (APE) | $26.83 | -$1.17 | -4.2% | +7.8% | +125.4% |
Block (XYZ) | $87.64 | -$3.64 | -4.0% | -10.8% | -35.7% |
Rio Tinto (RIO) | $151.55 | -$5.49 | -3.5% | +3.1% | +28.8% |
IGO (IGO) | $8.32 | -$0.25 | -2.9% | +3.6% | +61.6% |
Fortescue (FMG) | $21.00 | -$0.59 | -2.7% | -4.8% | +11.2% |
Seek (SEK) | $20.97 | -$0.58 | -2.7% | -9.6% | -5.4% |
ChartWatch
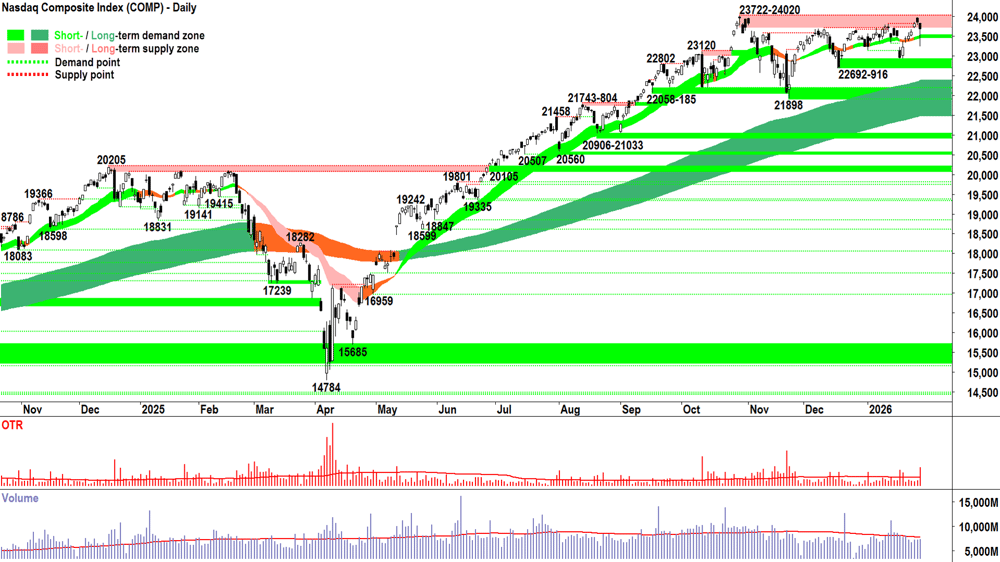
Nasdaq Composite Index
Analysis
Thursday’s candle is what you call a “shot across the bow” by the supply-side.
They had a crack, with prices falling quite substantially after the open… But! Then the demand-side stood firm… supply had little follow-through… yet the demand-side had plenty of follow through… The Comp price closed much closer to the top of the candle’s range than the bottom. ✅
Volume was benign, suggesting a bit of supply panicked out in the morning, and a bit of demand soaked them up. The long lower shadow speaks both to the initial motivation of that early excess supply — and the demand that came into meet, then exceed it. ⚖️
The short term uptrend ribbon appears to have done its job of acting as a zone of dynamic demand. ✅
The 22692-9016 demand zone remains largely unchallenged. ✅
The long term trend is very much intact. ✅
Really, all we’ve witnessed is a modest bout of supply — exactly from a zone where we’d expect there to be at least a modest lingering of supply (23722-24020).
In light of the above factors, I can’t see that very much has changed within the Comp’s technicals. As in, they remain indicative of both short and long term demand-side control. ✅
We must remain watchful for the manifestation of supply in the 23722-24020 supply zone — and we know that this will take the form of black-bodied candles and or upward pointing shadows.
The greater the size of such candles, the greater the motivation of the supply-side that’s causing them, and the greater the simultaneous withdrawal of motivation among the demand-side = ⚠️.
Also, the greater the volume that might accompany such a supply-side manifestation, the greater the size of the supply involved… so watch that too! 🧐
That’s it for now… next candle please!
View
I remain at a 2/3RP portfolio risk limit 🪣 (RP = Risk Position — it reflects my personal allowable capital allocation limit for my investments in US stocks. So 1/2RP is 50%, 2/3RP is 67% and FRP is 100%). A credible demand-side candle from here will trigger a move to FRP vs a close below 22692 would trigger a move to 1/2RP.
Key levels
The next zone of demand is 22692-916. If the Comp closes below that zone, we can assume the supply side is in control. On a close below 21898 the long term uptrend is likely under significant pressure = ⚠️. 23722-24020 is the nearest critical zone of supply — the Comp must close within/above this zone with a strong demand-side candle to confirm the demand-side is unequivocally back in control of the Comp's price.
S&P/ASX 200 (XJO)
%20chart_30%20Jan.png)
Analysis
Oh, Old Tin Pot… once again you have promised us so much — yet delivered so little. 😭
Why do I keep getting seduced by your displays of apparent demand-side control? 🤦
If you’ve been reading my waffle here for long enough, you know exactly what that black candle with its upward pointing shadow means. Hmmm… looks like a bit of volume there too… 👎
And then there’s the…
No… I can’t… I’m too disappointed to go on…
Bloody OTP! 😡
(Have a great weekend everyone… and let’s hope that short term uptrend ribbon (presently 8790-8825) holds! 😉)
View
I remain comfortable at 2/3RP 🪣 (i.e., my personal allowable capital allocation limit for my investments in Australian stocks is now 67%).
Key levels
The short term trend ribbon is the closest zone of (dynamic) demand (presently 8790-8825). 8765 is the closest static point of demand. A close below it/the short term uptrend ribbon would neutralise the present short term uptrend, while a close below 8675 almost certainly would end it. The October all-time highs around 9110-9116 is the next key zone of supply.
💥 ChartWatch *LIVE* Webinars are BACK for 2026! 💥
ChartWatch *LIVE* Webinar
ChartWatch *LIVE* Webinars – WEEKLY Wednesday's @ 12pm AEDT
Learn more about technical analysis and trend following through real case studies on ASX stocks. Australia's premier technical analyst, Carl Capolingua, shares his unique insights on stocks as requested by viewers. Ask about a company in your portfolio or anything related to trading and investing and get Carl's expert opinion.
Places are limited so >REGISTER NOW!<
Economy
Today
11:30 AUD December Producer Price Index (PPI) q/q
Result: -0.8% q/q vs +1.1% q/q forecast and +1% q/q in September
11:30 AUD December Private Sector Credit m/m
Result: +0.8% m/m vs +0.6% m/m forecast and +0.6% m/m in November
Later this week
Saturday
12:30 USA December Core PPI m/m (+0.2% m/m forecast vs 0% m/m in November)
Latest News
Interesting Movers
Trading higher
+31.2% Appen (APX) – Continued positive response to 29-Jan Q4 FY25 Quarterly Activity Report and Appendix 4C and Investor Presentation, rise is consistent with prevailing short- and long-term uptrends, a recent regular in ChartWatch ASX Scans Uptrends list 🔎📈
+8.1% Tungsten Mining (TGN) – Quarterly Activities/Appendix 5B Cash Flow Report, rise is consistent with prevailing short- and long-term uptrends, a recent regular in ChartWatch ASX Scans Uptrends list 🔎📈
+5.9% IDP Education (IEL) – No news, upgraded to overweight from neutral at JPMorgan and price target increased to $7.00 from $5.80.
+5.0% Nine Entertainment Co. Holdings (NEC) – Nine accelerates strategic transformation.
+4.3% Dateline Resources (DTR) – No news, rebounded after yesterday’s sharp sell-off due to Quarterly Activities/Appendix 5B Cash Flow Report.
+3.7% Flight Centre Travel Group (FLT) – No news, rise is consistent with prevailing short-term uptrend and long-term trend is transitioning from down to up, a regular in ChartWatch ASX Scans Uptrends list 🔎📈
Trading lower
-26.2% Ioneer (INR) – Ioneer Secures US$50 Million to Advance U.S. Onshoring, general weakness across the broader Lithium sector today.
-20.6% Energy Transition Minerals (ETM) – Successful A$24.7m Placement and Update on Shenghe Top-Up Right, general weakness across the broader Lithium sector today.
-17.0% Southern Palladium (SPD) – Quarterly Activities/Appendix 5B Cash Flow Report, general weakness across the broader Precious Metals sector today.
-16.9% Felix Gold (FXG) – Quarterly Activities and Cashflow Reports, general weakness across the broader Precious Metals sector today.
-15.6% The Star Entertainment Group (SGR) – Quarterly Activities & Appendix 4C Cash Flow Report.
-13.6% Elsight (ELS) – No news, pulled back in the wake of recent sharp rally.
-13.6% Alpha HPA (A4N) – Successful A$225M Capital Raising Supports Stage 2 Project.
-12.0% Argent Minerals (ARD) – Quarterly Activities/Appendix 5B Cash Flow Report, general weakness across the broader Silver sector today.
-11.8% Boab Metals (BML) – No news, general weakness across the broader Silver sector today, pulled back in the wake of recent sharp rally.
-11.7% Ora Banda Mining (OBM) – No news since 29-Jan Investment Approved to Advance Key Growth Projects, general weakness across the broader Precious Metals sector today.
-11.0% Sun Silver (SS1) – Quarterly Activities/Appendix 5B Cash Flow Report, general weakness across the broader Silver sector today.
Broker Moves
AIC Mines (A1M)
Retained at speculative buy at Ord Minnett; Price Target: $0.80 from $0.75
Aeris Resources (AIS)
Retained at speculative buy at Ord Minnett; Price Target: $0.85
Ampol (ALD)
Retained at buy at Ord Minnett; Price Target: $35.50 from $37.00
Alkane Resources (ALK)
Retained at buy at Bell Potter; Price Target: $1.95 from $1.40
ALS (ALQ)
Upgraded to buy from neutral at Goldman Sachs; Price Target: $28.00 from $20.95
AMP (AMP)
Retained at buy at Citi; Price Target: $2.10
Retained at overweight at Morgan Stanley; Price Target: $2.20 from $2.10
Ansell (ANN)
Retained at neutral at UBS; Price Target: $36.00 from $38.20
Arafura Rare Earths (ARU)
Retained at speculative buy at Canaccord Genuity; Price Target: $0.35
Bannerman Energy (BMN)
Retained at speculative buy at Canaccord Genuity; Price Target: $4.95 from $4.27
Black Pearl Group (BPG)
Retained at speculative buy at Bell Potter; Price Target: $1.91 from $1.45
Brazilian Rare Earths (BRE)
Retained at speculative buy at Canaccord Genuity; Price Target: $7.30
CAR Group (CAR)
Retained at accumulate at Morgans; Price Target: $35.50 from $40.80
Capricorn Metals (CMM)
Retained at buy at Argonaut Securities; Price Target: $24.50 from $21.50
Retained at buy at Goldman Sachs; Price Target: $17.60 from $17.20
Retained at neutral at Jarden; Price Target: $11.00
Retained at neutral at Macquarie; Price Target: $15.20 from $15.80
Comet Ridge (COI)
Retained at speculative buy at Morgans; Price Target: $0.25
Elevra Lithium (ELV)
Initiated at outperform at BMO Capital Markets; Price Target: $12.50
FINEOS Corporation Holdings PLC (FCL)
Retained at outperform at Macquarie; Price Target: $3.48
Genesis Minerals (GMD)
Retained at buy at Canaccord Genuity; Price Target: $9.70 from $9.60
Retained at buy at Citi; Price Target: $10.10 from $7.60
IDP Education (IEL)
Upgraded to overweight from neutral at JPMorgan; Price Target: $7.00 from $5.80
Retained at neutral at Macquarie; Price Target: $6.00
IGO (IGO)
Retained at neutral at Citi; Price Target: $9.30
Retained at neutral at Macquarie; Price Target: $9.00
Retained at underweight at Morgan Stanley; Price Target: $7.50 from $8.40
ikeGPS Group (IKE)
Retained at buy at Bell Potter; Price Target: $1.17
Iluka Resources (ILU)
Retained at hold at Argonaut Securities; Price Target: $6.10 from $6.30
Retained at buy at Canaccord Genuity; Price Target: $7.30
Retained at buy at Goldman Sachs; Price Target: $7.90 from $8.30
Retained at neutral at JPMorgan; Price Target: $6.20 from $6.40
Upgraded to outperform from neutral at Macquarie; Price Target: $6.50 from $7.10
Retained at overweight at Morgan Stanley; Price Target: $6.73 from $7.30
Retained at sell at Ord Minnett; Price Target: $5.00 from $6.00
Retained at neutral at UBS; Price Target: $5.25 from $5.45
ImpediMed (IPD)
Retained at speculative buy at Bell Potter; Price Target: $0.04 from $0.07
Retained at speculative buy at Morgans; Price Target: $0.10 from $0.13
Lotus Resources (LOT)
Retained at speculative buy at Canaccord Genuity; Price Target: $3.57
Liontown (LTR)
Retained at buy at Bell Potter; Price Target: $2.42 from $2.48
Retained at buy at Canaccord Genuity; Price Target: $2.40
Retained at sell at Citi; Price Target: $1.70
Retained at sell at Goldman Sachs; Price Target: $1.45 from $1.35
Retained at neutral at JPMorgan; Price Target: $2.30 from $2.25
Retained at underperform at Macquarie; Price Target: $1.70 from $1.00
Lynas Rare Earths (LYC)
Retained at buy at Canaccord Genuity; Price Target: $18.10
Microba Life Sciences (MAP)
Retained at speculative buy at Bell Potter; Price Target: $0.13 from $0.14
Retained at speculative buy at Morgans; Price Target: $0.29
Meteoric Resources NL (MEI)
Retained at speculative buy at Canaccord Genuity; Price Target: $0.40
Mineral Resources (MIN)
Retained at buy at Bell Potter; Price Target: $70.00 from $68.00
Retained at sell at Jarden; Price Target: $21.70 from $20.00
Retained at underperform at Jefferies; Price Target: $37.50 from $36.50
Upgraded to outperform from neutral at Macquarie; Price Target: $70.00 from $56.00
Retained at hold at Morgans; Price Target: $67.00 from $66.00
Retained at outperform at RBC Capital Markets; Price Target: $67.00 from $65.00
Mesoblast (MSB)
Retained at speculative buy at Bell Potter; Price Target: $4.45 from $4.00
Northern Star Resources (NST)
Downgraded to sell from neutral at UBS; Price Target: $28.30 from $26.90
Ora Banda Mining (OBM)
Retained at buy at Argonaut Securities; Price Target: $1.90
Retained at buy at Canaccord Genuity; Price Target: $1.60 from $1.70
Retained at buy at Euroz Hartleys; Price Target: $1.80 from $1.85
Retained at hold at Moelis Australia; Price Target: $1.27 from $1.37
Omega Oil & Gas (OMA)
Retained at speculative buy at Morgans; Price Target: $0.56 from $0.64
Pro Medicus (PME)
Retained at overweight at Morgan Stanley; Price Target: $350.00
Perpetual (PPT)
Retained at buy at Bell Potter; Price Target: $22.80 from $25.00
Retained at neutral at Citi; Price Target: $19.70 from $20.60
Downgraded to neutral from overweight at JPMorgan; Price Target: $20.00 from $22.50
Retained at outperform at Macquarie; Price Target: $22.25 from $23.70
Retained at neutral at UBS; Price Target: $20.60 from $22.40
Perseus Mining (PRU)
Retained at neutral at Macquarie; Price Target: $6.40
Downgraded to neutral from buy at UBS; Price Target: $7.10 from $6.65
REA Group (REA)
Upgraded to overweight from neutral at JPMorgan; Price Target: $225.00
Retained at overweight at Morgan Stanley; Price Target: $290.00
Retained at accumulate at Morgans; Price Target: $236.00 from $247.00
Downgraded to sector perform from outperform at RBC Capital Markets; Price Target: $225.00 from $270.00
Ramelius Resources (RMS)
Retained at buy at Argonaut Securities; Price Target: $7.60 from $7.00
Retained at overweight at JPMorgan; Price Target: $6.10 from $6.00
Downgraded to neutral from outperform at Macquarie; Price Target: $4.80 from $4.60
Downgraded to accumulate from buy at Morgans; Price Target: $5.50 from $4.50
Downgraded to neutral from buy at UBS; Price Target: $5.20 from $4.20
Sea Forest (SEA)
Retained at buy at Ord Minnett; Price Target: $3.05
SEEK (SEK)
Retained at accumulate at Morgans; Price Target: $27.50 from $30.80
Viva Energy Group (VEA)
Retained at hold at Jefferies; Price Target: $2.00 from $2.25
Retained at overweight at JPMorgan; Price Target: $2.20 from $2.30
Retained at outperform at Macquarie; Price Target: $3.10 from $3.20
Retained at equal-weight at Morgan Stanley; Price Target: $2.13
Retained at buy at Ord Minnett; Price Target: $2.40 from $3.20
Retained at buy at UBS; Price Target: $2.60 from $2.65
Vitrafy Life Sciences (VFY)
Retained at speculative buy at Bell Potter; Price Target: $2.28 from $2.10
Woodside Energy Group (WDS)
Retained at hold at Ord Minnett; Price Target: $23.25 from $24.25
Whitehaven Coal (WHC)
Downgraded to sell from hold at Bell Potter; Price Target: $8.40
Downgraded to neutral from positive at E&P; Price Target: $9.60 from $8.00
Retained at buy at Jefferies; Price Target: $11.00 from $9.00
Downgraded to neutral from outperform at Macquarie; Price Target: $10.00 from $8.75
Retained at equal-weight at Morgan Stanley; Price Target: $8.75
Downgraded to hold from accumulate at Morgans; Price Target: $9.75 from $7.95
Retained at accumulate at Ord Minnett; Price Target: $9.90 from $9.50
Retained at sell at UBS; Price Target: $8.95 from $8.45
Wisetech Global (WTC)
Retained at overweight at Morgan Stanley; Price Target: $130.00
Scans
Top Gainers
Code | Company | Last | % Chg |
|---|---|---|---|
| AKN | Auking Mining Ltd | $0.013 | +62.50% |
| NAG | Nagambie Resources Ltd | $0.015 | +50.00% |
| XPN | Xpon Technologies Group Ltd | $0.019 | +46.15% |
| BAK | BARKLY Rare EARTHS Ltd | $0.28 | +40.00% |
| AON | Apollo Minerals Ltd | $0.041 | +36.67% |
Top Fallers
Code | Company | Last | % Chg |
|---|---|---|---|
| TRP | Tissue Repair Ltd | $0.205 | -33.87% |
| 5EA | 5E Advanced Materials Inc | $0.37 | -30.19% |
| MCA | Murray Cod Australia Ltd | $0.76 | -27.27% |
| INR | Ioneer Ltd | $0.155 | -26.19% |
| GT1 | Green Technology Metals Ltd | $0.033 | -21.43% |
52 Week Highs
Code | Company | Last | % Chg |
|---|---|---|---|
| AKN | Auking Mining Ltd | $0.013 | +62.50% |
| BAK | BARKLY Rare EARTHS Ltd | $0.28 | +40.00% |
| AON | Apollo Minerals Ltd | $0.041 | +36.67% |
| FSUB | Vaneck Australian Fixed Rate Subordinated Debt ETF | $28.50 | +12.60% |
| IME | Imexhs Ltd | $0.45 | +12.50% |
52 Week Lows
Code | Company | Last | % Chg |
|---|---|---|---|
| 5EA | 5E Advanced Materials Inc | $0.37 | -30.19% |
| MCA | Murray Cod Australia Ltd | $0.76 | -27.27% |
| AXI | Axtec Ltd | $0.012 | -14.29% |
| ENL | Enlitic Inc | $0.012 | -14.29% |
| SLVM | Global X Silver Miners ETF | $48.51 | -8.82% |
Near Highs
Code | Company | Last | % Chg |
|---|---|---|---|
| IAGPF | Insurance Australia Group Ltd | $105.561 | -0.04% |
| GCI | Gryphon Capital Income Trust | $2.06 | 0.00% |
| VVLU | Vanguard Global Value Equity Active ETF | $79.80 | +1.57% |
| IHD | iShares S&P/ASX DIV Opportunities Esg Screened ETF | $16.64 | -0.24% |
| MGX | MGX Resources Ltd | $0.49 | 0.00% |
Relative Strength Index (RSI) Oversold
Code | Company | Last | % Chg |
|---|---|---|---|
| FANG | Global X Fang+ ETF | $32.09 | -0.86% |
| ETHI | Betashares Global Sustainability Leaders ETF | $15.59 | +0.45% |
| RAC | Racura Oncology Ltd | $2.23 | +0.45% |
| BRN | Brainchip Holdings Ltd | $0.145 | -6.45% |
| CD2 | CD Private Equity Fund Ii | $0.49 | -2.97% |
