News | Market Wraps
Evening Wrap: ASX 200 dumps 115 points as oil tops US$100 — sinks tech, gold. Dirty coal big winner, WHC +7%
The S&P/ASX 200 closed 114.5 points lower, down 1.31%.

Mentioned
The S&P/ASX 200 closed 114.5 points lower, down 1.31%.
The ASX 200 fell sharply as rising geopolitical tensions in the Middle East sent oil prices surging and rattled global markets. Higher energy costs and tightening financial conditions triggered broad risk-off sentiment and dragged most sectors lower, with the energy sector the only winner.
In stock specific news:
Collins Foods (CKF) (+5.2%) — surged after agreeing to acquire eight KFC restaurants in Bavaria as part of its expansion strategy in Germany.
Alcoa (AAI) (+4.4%) — rallied after UBS lifted aluminium forecasts amid supply risks linked to Middle East tensions and named the stock its preferred Australian exposure to the metal.
IperionX (IPX) (-14.3%) — plunged after reporting a sharply wider half-year loss driven by higher research and exploration spending.
Liontown Resources (LTR) (-0.9%) — edged lower after reporting a half-year loss tied partly to a large non-cash accounting charge linked to a convertible note.
Atlas Arteria (ALX) (-1.3%) — slipped despite new legislation in Virginia that could allow toll road operators to seek approval for longer-term toll increases.
Be sure to click/scroll through for the usual reporting of the major sector and stock-specific moves, the broker responses to them, as well as all the key economic data in tonight's Evening Wrap.
Also, I have detailed technical analysis on the Nasdaq Composite and the S&P/ASX 200 in today's ChartWatch.
Let's dive in!
Today in Review
Thu 12 Mar 26, 4:55pm (AEST)
Name | Value | % Chg |
|---|---|---|
Major Indices | ||
| ASX 200 | 8,629.0 | -1.31% |
| All Ords | 8,851.4 | -1.40% |
| Small Ords | 3,436.5 | -2.49% |
| All Tech | 2,736.5 | -2.67% |
| Emerging Companies | 3,114.7 | -3.17% |
Currency | ||
| AUD/USD | 0.7126 | -0.37% |
US Futures | ||
| S&P 500 | 6,719.5 | -0.89% |
| Dow Jones | 46,945.0 | -1.06% |
| Nasdaq | 24,758.75 | -0.90% |
Name | Value | % Chg |
|---|---|---|
Sector | ||
| Energy | 10,439.9 | +2.08% |
| Utilities | 9,701.4 | -0.26% |
| Consumer Staples | 12,279.8 | -0.42% |
| Communication Services | 1,673.5 | -0.71% |
| Industrials | 8,017.3 | -1.04% |
| Consumer Discretionary | 3,457.6 | -1.11% |
| Financials | 9,498.8 | -1.45% |
| Health Care | 28,257.4 | -1.48% |
| Materials | 22,552.3 | -1.60% |
| Real Estate | 3,352.4 | -2.58% |
| Information Technology | 1,698.3 | -3.45% |
Markets
%20intraday%20chart_12%20Mar.png)
ASX 200 Session Chart
The S&P/ASX 200 (XJO) finished 114.5 points lower at 8,629.0, 1.3% from its session high and just 0.4% from its low. In the broader-based S&P/ASX 300 (XKO) advancers lagged decliners by a devastating 37 to 247.
Little was spared the rod today as investors sought refuge in cash. Disturbingly, the rout in the Information Technology (XIJ) (-3.4%) sector appears to have resumed, with today its second day of heavy falls — as well as notching the dubious honour of worst performing ASX sector.
Also disturbingly, investors continued to exit bonds, particularly the local 10-year risk-free’s whose yield again nudged 5%.
High-P/E, "long-duration" sectors such as Information Technology often struggle when risk-free bond yields rise. In equity terms, long duration refers to companies whose expected cash flows lie further into the future rather than the near term — typical of growth firms investing today for profits tomorrow.
Investors value those future earnings by discounting them back to today using a discount rate, usually anchored to the risk-free government bond yield plus a risk premium. When bond yields rise, the discount rate rises as well, reducing the present value of those distant cash flows — effectively lowering the stock price investors are willing to pay for those earnings.
Bond proxy sectors like Real Estate (XPJ) (-2.5%) were hit hard because these risky investments, which typically deliver bond-like returns, now look less attractive against higher-yielding risk-free bonds. Gold Sub-Index (XGD) (-2.0%) stocks were also weaker — the metal doesn’t produce a yield, so higher risk-free yields raise the opportunity cost of holding gold.
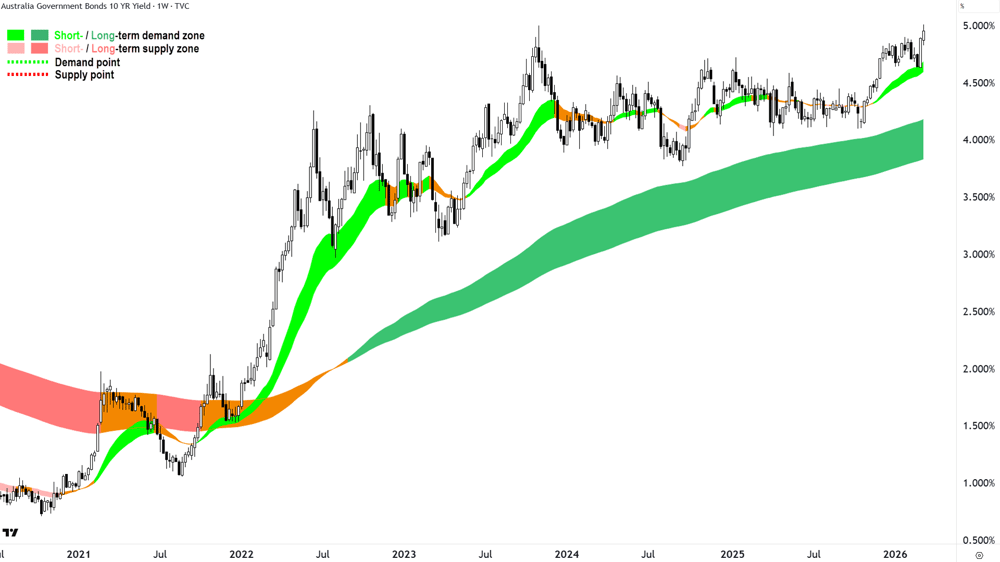
Australian 10-year Government Bond yield weekly chart — if this was a stock, what would you be looking to do? Higher risk-free yields are a drag on economic growth and undermine how much investors are prepared to pay for a future dollar's worth of earnings.
Big banks / Financials (XFJ) (-1.4%) and Resources (XJR) (-1.0%) finished with roughly in-line-with-market losses, as arguably larger, defensive, and more liquid stocks were less heavily dealt with by investors.
In commodities, benchmark Brent Crude Oil futures on ICE rose 7.7% to US$99.08/bbl after trading above US$100/bbl for most of the Asian session. Benchmark COMEX gold and silver futures continued their softer overnight tone, trading down 0.52% to US$5,152/oz and down 0.56% to US$85.06/oz respectively.
Lithium prices weakened in China trade, with spodumene concentrate falling 3.5% to around 154,300 CNY/t. The decline dragged on lithium producers including IGO (IGO) (-4.9%), Mineral Resources (MIN) (-3.4%) and PLS Group (PLS) (-2.4%).
Energy (XEJ) (+2.1%) was the only place to hide following attacks on tankers in Iraqi waters and the evacuation of vessels from a key export terminal in Oman. Ampol (ALD) (+2.9%), Woodside Energy Group (WDS) (+2.1%) and Santos (STO) (+1.5%) were all winners, but it was coal's big day to shine — as Yancoal Australia (YAL) (+10.5%), Whitehaven Coal (WHC) (+6.7%), and New Hope Corp. (NHC) (+4.2%) did very well indeed.
So in summary, it was another day of stocks down + bonds down + gold down...
Which = Investors raising cash levels 💰💰💰
And in my experience, that usually happens when it’s getting a bit too hard and the smart money’s getting outta Dodge! 🤠
Today's best blue chip gainers
Company | Last Price | Change $ | Change % | 1mo % | 1yr % | Context |
|---|---|---|---|---|---|---|
Whitehaven Coal (WHC) | $9.29 | +$0.58 | +6.7% | +5.1% | +58.0% | Whitehaven Coal (WHC) (+6.7%) |
Telix Pharmaceuticals (TLX) | $11.23 | +$0.47 | +4.4% | +15.2% | -58.5% | Telix Pharmaceuticals (TLX) (+4.4%) |
Ampol (ALD) | $30.27 | +$0.85 | +2.9% | +2.4% | +26.3% | Ampol (ALD) (+2.9%) |
Lynas Rare Earths (LYC) | $21.17 | +$0.58 | +2.8% | +34.3% | +202.0% | Lynas Rare Earths (LYC) (+2.8%) |
Woodside Energy (WDS) | $31.05 | +$0.63 | +2.1% | +19.1% | +36.8% | Woodside Energy Group (WDS) (+2.1%) |
Insurance Australia (IAG) | $7.02 | +$0.14 | +2.0% | -3.7% | -7.6% | Insurance Australia Group (IAG) (+2.0%) |
Santos (STO) | $7.49 | +$0.11 | +1.5% | +8.1% | +21.4% | Santos (STO) (+1.5%) |
Suncorp Group (SUN) | $15.23 | +$0.22 | +1.5% | -5.7% | -20.0% | Suncorp Group (SUN) (+1.5%) |
Bluescope Steel (BSL) | $26.57 | +$0.37 | +1.4% | -8.2% | +20.1% | Bluescope Steel (BSL) (+1.4%) |
Amcor PLC (AMC) | $59.58 | +$0.42 | +0.7% | -12.6% | -25.0% | Amcor PLC (AMC) (+0.7%) |
SGH (SGH) | $42.22 | +$0.27 | +0.6% | -17.1% | -11.3% | SGH (SGH) (+0.6%) |
Coles Group (COL) | $20.42 | +$0.07 | +0.3% | -6.2% | +7.1% | Coles Group (COL) (+0.3%) |
The Lottery Corp. (TLC) | $5.39 | +$0.01 | +0.2% | +3.1% | +13.0% | The Lottery Corp. (TLC) (+0.2%) |
Woolworths Group (WOW) | $35.87 | +$0.05 | +0.1% | +13.0% | +27.3% | Woolworths Group (WOW) (+0.1%) |
APA Group (APA) | $9.13 | +$0.01 | +0.1% | +3.0% | +20.9% | APA Group (APA) (+0.1%) |
Northern Star (NST) | $26.77 | +$0.02 | +0.1% | -5.3% | +57.7% | Northern Star Resources (NST) (+0.1%) |
Aristocrat Leisure (ALL) | $45.65 | +$0.03 | +0.1% | -13.9% | -32.0% | Aristocrat Leisure (ALL) (+0.1%) |
Today's worst blue chip losers
Company | Last Price | Change $ | Change % | 1mo % | 1yr % |
|---|---|---|---|---|---|
Hub24 (HUB) | $82.42 | -$4.92 | -5.6% | -5.7% | +16.5% |
Netwealth Group (NWL) | $21.84 | -$1.26 | -5.5% | -9.0% | -19.2% |
Capricorn Metals (CMM) | $12.42 | -$0.65 | -5.0% | -12.0% | +66.9% |
Pinnacle Investment (PNI) | $14.35 | -$0.75 | -5.0% | -23.4% | -19.3% |
Charter Hall Group (CHC) | $19.00 | -$0.99 | -5.0% | -18.5% | +17.3% |
IGO (IGO) | $7.55 | -$0.39 | -4.9% | -13.0% | +97.6% |
Life360 (360) | $20.39 | -$1.03 | -4.8% | -23.7% | -4.6% |
Block (XYZ) | $89.04 | -$3.84 | -4.1% | +9.8% | +0.6% |
Xero (XRO) | $78.48 | -$3.37 | -4.1% | -6.6% | -50.5% |
Endeavour Group (EDV) | $3.76 | -$0.15 | -3.8% | -1.3% | -8.3% |
Light & Wonder (LNW) | $122.15 | -$4.63 | -3.7% | -25.6% | -25.1% |
Mineral Resources (MIN) | $58.25 | -$2.08 | -3.4% | +10.2% | +175.9% |
Lendlease Group (LLC) | $3.52 | -$0.12 | -3.3% | -23.8% | -41.0% |
Goodman Group (GMG) | $26.18 | -$0.89 | -3.3% | -15.1% | -14.8% |
Resmed Inc (RMD) | $33.14 | -$1.07 | -3.1% | -9.9% | -7.2% |
Mirvac Group (MGR) | $1.840 | -$0.055 | -2.9% | -6.1% | -10.7% |
Newmont Corp. (NEM) | $160.95 | -$4.73 | -2.9% | -6.1% | +133.9% |
Challenger (CGF) | $7.39 | -$0.21 | -2.8% | -19.1% | +39.4% |
Technology One (TNE) | $26.41 | -$0.73 | -2.7% | +13.3% | -2.5% |
ChartWatch
Nasdaq Composite Index
Analysis
What does one do...? ⏳

Source imageresizer.com
There's not really much one can do — when one is a trend follower — except wait.
This is going to be a very short Comp write up today because Wednesday's candle adds very little to the existing brief of evidence.
Think about that for a second: there's apparently so much uncertainty in the world... blah blah risks this... blah blah escalation that... blah blah but what if... and blah blah perhaps... 🙉
And here we are, sitting on our garden swing, absolutely assured of our course of action.
With — I put to you — nary a care in the world (assuming one's risk allocations are appropriately accounted for: Me = 50% cash vs 50% invested with a suitable proportion of that long and short).
How much simpler is life with charts compared to whatever everyone else is doing!? 💪
View
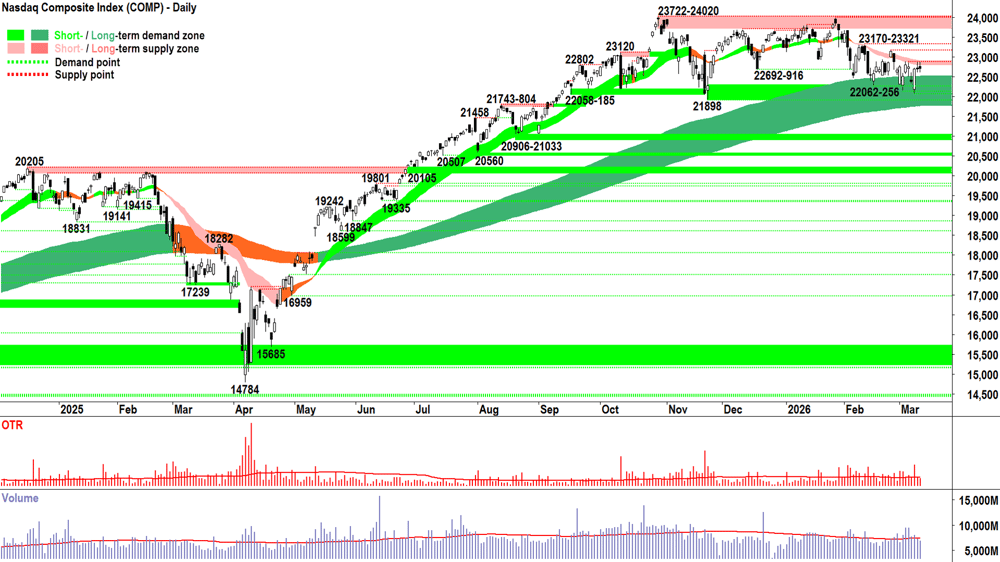
1/2RP feels valid with respect to my US portfolio risk limit (RP = Risk Position — it reflects my personal allowable capital allocation limit for my investments in US stocks — how full I can fill my US "Risk Bucket" if you prefer. 1/2RP is 50%, 2/3RP is 67% and FRP is 100% 🪣).
Key levels
21898-22256 is the critical zone of demand — a close below it implies the long term uptrend is likely under significant pressure (over!?) = ⚠️. The short term downtrend ribbon (presently 22799-22906) is the nearest critical zone of point supply, and 22877-23170-23321 aren't far beyond that.
S&P/ASX 200 (XJO)
%20chart_12%20Mar.png)
Analysis
FLIPPING hell!
No, not “flipping,” as in the euphemism for that other naughty F-word… although…😉
I mean “flipping” as in the colour of the long-term trend ribbon just flipped again!
Remember how yesterday I remarked that such one-day flips "Almost never happen". You know, how the long term trend ribbon is supposed be boring and reliable — how it’s supposed to flag long term shifts in market sentiment.
Well, we're now at:
Monday = 🟩
Tuesday = 🟧
Wednesday = 🟩
Thursday = 🟧
One could argue the long term uptrend ribbon is broken, it's not set up right. Uh-uh, it's set up just fine, simply that the Old Tin Pot's massive daily gyrations are occurring at a sensitive point for the long term trend ribbon — a tipping (and flipping!) point, as it were.
Put simply: this is potentially the tipping point between long term uptrend and long term downtrend.
Today's very credible supply-side candle, with its above average size/volatility (note today's OTR), and close near the session's low, sets 8760 as a lower point of supply to 9201 = supply reinforcement.
Importantly, 8760 occurs inside the long term trend ribbon — which suggests a substantial threat of it transitioning from a zone of dynamic demand to a zone of dynamic supply = ⚠️.
Really, all that's standing in the way of confirming the beginning of a new long term downtrend are the static demand points at 8383-8457.
I'm never a bull nor a bear. I'm a pragmatist.
Bulls and bears argue about what the market should do. Pragmatists simply observe what it is doing — assign probabilities to those observations — and allocate their risk accordingly.
In my experience, the MOTN (More Often Than Not) of the present set of OTP technicals lies with ➡️ or ⬇️ — probably quite equally so.
Ergo, 50% cash vs 50% invested with a suitable proportion of that long and short feels like the right place to be.
I note that ChartWatch ASX Scans has been pumping out potential shorts in the Downtrends lists for weeks heading into the last 9-days tumult (yes, it's just 9 days since the OTP made a record high! 🤦).
So, as sudden as the reversal has been — it's not like you weren't warned something wasn't quite right with the Old Tin Pot!
View
1/2RP, logically, feels like the right place for me to be 🪣 (i.e., my personal allowable capital allocation limit for my investments in Australian stocks is 50%).
Key levels
8383-8457 is the closest zone of demand (static). Beyond it — the bear market awaits...⚠️🚨 The ASX 200 must at least close back above the long term uptrend ribbon (presently 8675 - 8783) to reclaim any semblance of demand-side control.
ChartWatch *LIVE* Webinar
ChartWatch *LIVE* Webinars – WEEKLY Wednesday's @ 12pm AEDT
Learn more about technical analysis and trend following through real case studies on ASX stocks. Australia's premier technical analyst, Carl Capolingua, shares his unique insights on stocks as requested by viewers. Ask about a company in your portfolio or anything related to trading and investing and get Carl's expert opinion.
Places are limited so >REGISTER NOW!<
Economy
Today
AUS February MI Inflation Expectations
Result: +5.2% p.a. vs +5.0% p.a. in January
Comment: >5% p.a.? Hmmm... just a tad north of the RBA's 2-3% average target! 🚀
Later this week
Friday
00:30 GB GDP m/m (+0.2% p.a. forecast vs +0.1% p.a. previous)
11:30 USA Core PCE Price Index m/m (+0.4% m/m forecast vs -0.1% m/m previous)
Saturday
01:00 USA JOLTS Job Openings (+6.84 million m/m forecast vs +6.54 million m/m previous)
Latest News
Interesting Movers
Trading higher
+12.3% BetaShares Crude Oil ETF (OOO) – No news (long crude oil ETF), general strength across the broader Energy sector today, rise is consistent with prevailing short and long term uptrends, a regular in ChartWatch ASX Scans Uptrends list 🔎📈
+10.5% Yancoal Australia (YAL) – No news, general strength across the broader Energy / coal sector today, rise is consistent with prevailing short and long term uptrends, a regular in ChartWatch ASX Scans Uptrends list 🔎📈
+6.7% Whitehaven Coal (WHC) – Credit Ratings Published, general strength across the broader Energy / coal sector today, rise is consistent with prevailing short and long term uptrends, a regular in ChartWatch ASX Scans Uptrends list 🔎📈
+5.2% Collins Foods (CKF) – Europe Developments & Trading Update - Investor Presentation, upgraded to overweight from neutral at Jarden and price target raised to $12.10 from $11.40.
+4.8% Karoon Energy (KAR) – No news, general strength across the broader Energy sector today.
+4.4% Alcoa Corp. (AAI) – No company news, but likely a positive response to a bullish research note on aluminium from UBS.
+4.4% Telix Pharmaceuticals (TLX) – Becoming a substantial holder from CGF (CGF +5.1%).
+4.2% New Hope Corp. (NHC) – No news, general strength across the broader Energy / coal sector today, rise is consistent with prevailing short and long term uptrends, a regular in ChartWatch ASX Scans Uptrends list 🔎📈
+3.6% Beach Energy (BPT) – No news, general strength across the broader Energy sector today.
+3.4% BetaShares US EQY Strong Bear CCY H Complex ETF (BBUS) – No news (short US stocks ETF).
+3.2% BetaShares Australian Equities Strong Bear Complex ETF (BBOZ) – No news (short ASX stocks ETF).
+2.9% Ampol (ALD) – No news, general strength across the broader Energy sector today.
+2.8% Lynas Rare Earths (LYC) – Continued positive response to 10-Mar Enhanced JARE Agreement for Japanese Industry, rise is consistent with prevailing short and long term uptrends, a regular in ChartWatch ASX Scans Uptrends list 🔎📈
+2.7% BetaShares Energy ETF (FUEL) – No news (global energy stocks ETF), general strength across the broader Energy sector today, rise is consistent with prevailing short and long term uptrends, a regular in ChartWatch ASX Scans Uptrends list 🔎📈
+2.5% Viva Energy Group (VEA) – No news, general strength across the broader Energy sector today.
+2.1% Woodside Energy Group (WDS) – No news, general strength across the broader Energy sector today, rise is consistent with prevailing short and long term uptrends, a regular in ChartWatch ASX Scans Uptrends list 🔎📈
+1.5% Santos (STO) – No news, general strength across the broader Energy sector today, rise is consistent with prevailing short and long term uptrends, a regular in ChartWatch ASX Scans Uptrends list 🔎📈
Trading lower
-14.3% Iperionx (IPX) – Half Year Accounts.
-10.6% Myer (MYR) – No news, general weakness across the broader Consumer Discretionary sector today, fall is consistent with prevailing short and long term downtrends, a regular in ChartWatch ASX Scans Downtrends list 🔎📉
-9.5% Forrestania Resources (FRS) – Half Yearly Report and Accounts
-9.2% WA1 Resources (WA1) – Half Year Accounts.
-9.1% Brazilian Rare Earths (BRE) – No news since 11-Mar Sulista Rare Earth District Grows to 17 km Strike.
-8.4% Weebit Nano (WBT) – No news, general weakness across the broader Information Technology sector today.
-8.2% Wildcat Resources (WC8) – No news, general weakness across the broader Lithium sector today.
-8.1% Siteminder (SDR) – Ceasing to be a substantial holder from MUFG (previously 5.1%), general weakness across the broader Information Technology sector today, fall is consistent with prevailing short and long term downtrends, a regular in ChartWatch ASX Scans Downtrends list 🔎📉
-7.8% St Barbara (SBM) – No news, general weakness across the broader Gold sector today.
-7.8% Catapult Sports (CAT) – No news, general weakness across the broader Information Technology sector today, fall is consistent with prevailing short and long term downtrends, a regular in ChartWatch ASX Scans Downtrends list 🔎📉
-7.8% McMillan Shakespeare (MMS) – No news, fall is consistent with prevailing short and long term downtrends, a regular in ChartWatch ASX Scans Downtrends list 🔎📉
-7.7% Temple & Webster Group (TPW) – No news, general weakness across the broader Consumer Discretionary sector today, fall is consistent with prevailing short and long term downtrends, a regular in ChartWatch ASX Scans Downtrends list 🔎📉
-7.3% G8 Education (GEM) – Change in substantial holding from MQG (Macquarie 7.2% from 8.8%), general weakness across the broader Consumer Discretionary sector today, fall is consistent with prevailing short and long term downtrends, a regular in ChartWatch ASX Scans Downtrends list 🔎📉
-7.0% Lovisa (LOV) – No news, general weakness across the broader Consumer Discretionary sector today, fall is consistent with prevailing short and long term downtrends, a regular in ChartWatch ASX Scans Downtrends list 🔎📉
-6.8% Accent Group (AX1) – No news, general weakness across the broader Consumer Discretionary sector today, fall is consistent with prevailing short and long term downtrends, a regular in ChartWatch ASX Scans Downtrends list 🔎📉
-6.8% Elevra Lithium (ELV) – No news, general weakness across the broader Lithium sector today.
-6.1% Zip Co. (ZIP) – No news, general weakness across the broader Information Technology sector today, fall is consistent with prevailing short and long term downtrends, a regular in ChartWatch ASX Scans Downtrends list 🔎📉
-5.5% Guzman Y Gomez (GYG) – No news, general weakness across the broader Consumer Discretionary sector today, fall is consistent with prevailing short and long term downtrends, a regular in ChartWatch ASX Scans Downtrends list 🔎📉
-5.5% Vulcan Energy Resources (VUL) – No news, general weakness across the broader Lithium sector today, fall is consistent with prevailing short and long term downtrends, a regular in ChartWatch ASX Scans Downtrends list 🔎📉
-5.5% Netwealth Group (NWL) – No news, general weakness across the broader Information Technology sector today, fall is consistent with prevailing short and long term downtrends, a regular in ChartWatch ASX Scans Downtrends list 🔎📉
Broker Moves
Alcoa Corporation (AAI)
Retained at neutral at UBS; Price Target: $95.00 from $71.00
Brazilian Rare Earths (BRE)
Retained at speculative buy at Ord Minnett; Price Target: $7.50
Brambles (BXB)
Retained at neutral at UBS; Price Target: $25.40
Collins Foods (CKF)
Retained at buy at Citi; Price Target: $12.85
Upgraded to overweight from neutral at Jarden; Price Target: $12.10 from $11.40
Coronado Global Resources Inc (CRN)
Downgraded to neutral from buy at UBS; Price Target: $0.40 from $0.36
FINEOS Corporation Holdings PLC (FCL)
Retained at buy at Citi; Price Target: $3.25
Goodman Group (GMG)
Retained at buy at Citi; Price Target: $40.00
GQG Partners Inc. (GQG)
Retained at buy at UBS; Price Target: $2.00 from $2.08
Lynas Rare Earths (LYC)
Upgraded to hold from sell at Bell Potter; Price Target: $19.00 from $11.60
Retained at sell at Ord Minnett; Price Target: $14.00
Retained at buy at UBS; Price Target: $23.90 from $17.70
Ora Banda Mining (OBM)
Retained at buy at Euroz Hartleys; Price Target: $1.85 from $1.80
Retained at outperform at Macquarie; Price Target: $1.70
Propel Funeral Partners (PFP)
Initiated at overweight at Jarden; Price Target: $5.00
PlaySide Studios (PLY)
Retained at buy at Shaw and Partners; Price Target: $0.44
Pantoro Gold (PNR)
Retained at buy at Morgans; Price Target: $6.53 from $6.83
REA Group (REA)
Retained at buy at Citi; Price Target: $199.00
Rio Tinto (RIO)
Upgraded to hold from trim at Morgans; Price Target: $147.00 from $146.00
Resolute Mining (RSG)
Initiated at speculative buy at Argonaut Securities; Price Target: $3.00
South32 (S32)
Retained at buy at UBS; Price Target: $5.20 from $5.10
Sonic Healthcare (SHL)
Retained at hold at Ord Minnett; Price Target: $24.00
Serko (SKO)
Retained at buy at Ord Minnett; Price Target: $4.98 from $5.00
Sunstone Metals (STM)
Retained at buy at Shaw and Partners; Price Target: $2.10
Turaco Gold (TCG)
Retained at speculative buy at Canaccord Genuity; Price Target: $1.45
Telix Pharmaceuticals (TLX)
Retained at buy at Bell Potter; Price Target: $19.00 from $23.00
Whitehaven Coal (WHC)
Retained at sell at UBS; Price Target: $7.90 from $7.70
Scans
Top Gainers
Code | Company | Last | % Chg |
|---|---|---|---|
| AGR | Aguia Resources Ltd | $0.02 | +33.33% |
| LSR | Lodestar Minerals Ltd | $0.016 | +33.33% |
| ICE | Icetana Ltd | $0.04 | +29.03% |
| NME | NEX Metals Exploration Ltd | $0.018 | +28.57% |
| TSK | Tusker Minerals Ltd | $0.083 | +27.69% |
Top Fallers
Code | Company | Last | % Chg |
|---|---|---|---|
| 3PL | 3P Learning Ltd | $0.37 | -17.78% |
| IR1 | Iris Metals Ltd | $0.11 | -15.39% |
| PKD | Parkd Ltd | $0.028 | -15.15% |
| EGY | Energy Technologies Ltd | $0.017 | -15.00% |
| BHL | Black Horse Mining Ltd | $0.325 | -14.47% |
52 Week Highs
Code | Company | Last | % Chg |
|---|---|---|---|
| YAL | Yancoal Australia Ltd | $7.71 | +10.46% |
| IOD | Iodm Ltd | $0.195 | +5.41% |
| FOOD | Betashares GLB Agriculture Comp Currency HDGD ETF | $8.62 | +4.11% |
| EM3 | Emc Gold Corporation | $0.27 | +3.85% |
| AII | Almonty Industries Inc | $30.89 | +3.24% |
52 Week Lows
Code | Company | Last | % Chg |
|---|---|---|---|
| 3PL | 3P Learning Ltd | $0.37 | -17.78% |
| EGY | Energy Technologies Ltd | $0.017 | -15.00% |
| BHL | Black Horse Mining Ltd | $0.325 | -14.47% |
| MYR | Myer Holdings Ltd | $0.295 | -10.61% |
| GDR | Golden Dragon Mining Ltd | $0.175 | -7.90% |
Near Highs
Code | Company | Last | % Chg |
|---|---|---|---|
| HGBL | Betashares Global Shares Currency Hedged ETF | $76.68 | -1.55% |
| MQGPG | Macquarie Group Ltd | $103.25 | +0.10% |
| COI | Comet Ridge Ltd | $0.145 | 0.00% |
| AZJ | Aurizon Holdings Ltd | $3.98 | -0.25% |
| DCOR | Daintree Core Income Active ETF | $51.68 | -0.17% |
Relative Strength Index (RSI) Oversold
Code | Company | Last | % Chg |
|---|---|---|---|
| VVLU | Vanguard Global Value Equity Active ETF | $75.77 | -2.02% |
| FLT | Flight Centre Travel Group Ltd | $11.61 | -2.76% |
| HVN | Harvey Norman Holdings Ltd | $5.16 | -3.37% |
| AMP | AMP Ltd | $1.16 | -1.70% |
| IIND | Betashares India Quality ETF | $9.60 | -2.34% |
