News | Market Wraps
Evening Wrap: ASX 200 dumps 100 points on unhealthy Cochlear and CSL news, banks bashed as BOQ outlook sours
The S&P/ASX 200 closed 105.8 points lower, down 1.18%.

Mentioned
The S&P/ASX 200 closed 105.8 points lower, down 1.18%.
The ASX 200 recorded its biggest single-day fall in over a month after Cochlear's shock profit guidance cut — slashing its FY26 earnings outlook by roughly 30% — triggered a devastating rout across the healthcare sector and dragged the broader market lower.
Trump's indefinite ceasefire extension barely registered against the damage, with financials piling on further losses as a string of weak quarterly updates compounded the pain.
In stock specific news:
Treasury Wine Estates (TWE) (+16.5%) — flagged a major corporate restructure that will see Penfolds no longer operate as a standalone division.
South32 (S32) (+2.0%) — stronger-than-expected cash performance offset production misses driven by weak manganese output and softer copper production.
Scentre Group (SCG) (+1.7%) — reported 3.1% growth in customer visitation and occupancy of 99.8%, with Citi noting the Westfield operator is well placed to manage macro volatility.
BHP (BHP) (+1.2%) — reached a supply agreement with China's state-backed iron ore buyer China Mineral Resources Group, ending a long-running dispute, with its March quarter production update also delivering copper guidance lifted to the upper end of its range and iron ore beating forecasts.
Cochlear (COH) (-40.7%) — cut FY26 underlying net profit guidance to $290–330 million from $435–460 million previously, citing weaker developed market demand, Middle East tensions and softer US conditions, in its worst share price session on record.
Generation Development Group (GDG) (-22.6%) — delivered a mixed March quarter with weaker net flows in managed accounts.
Bank of Queensland (BOQ) (-9.1%) — first-half cash profit fell 4% to $176 million, missing expectations, as it flagged margin pressure, tougher conditions and rising competition.
CSL (CSL) (-5.7%) — fell to a nine-year low after the US military scrapped its annual flu shot mandate for service members, removing a key market for the biotech giant which generates nearly half its revenue from the US.
Macquarie Group (MQG) (-3.8%) — Goldman Sachs downgraded its rating to Neutral following a recent surge in the share price.
Be sure to click/scroll through for the usual reporting of the major sector and stock-specific moves, the broker responses to them, as well as all the key economic data in tonight's Evening Wrap.
Also, I have detailed technical analysis on the Nasdaq Composite and the S&P/ASX 200 in today's ChartWatch.
Let's dive in!
Today in Review
Wed 22 Apr 26, 7:20pm (AEST)
Name | Value | % Chg |
|---|---|---|
Major Indices | ||
| ASX 200 | 8,843.6 | -1.18% |
| All Ords | 9,074.3 | -1.12% |
| Small Ords | 3,534.8 | -0.74% |
| All Tech | 2,884.4 | -0.59% |
| Emerging Companies | 3,171.0 | -1.15% |
Currency | ||
| AUD/USD | 0.7166 | +0.17% |
US Futures | ||
| S&P 500 | 7,131.5 | +0.44% |
| Dow Jones | 49,510.0 | +0.35% |
| Nasdaq | 26,792.25 | +0.59% |
Name | Value | % Chg |
|---|---|---|
Sector | ||
| Consumer Staples | 12,922.1 | +1.07% |
| Information Technology | 1,807.5 | +0.34% |
| Utilities | 10,412.8 | +0.13% |
| Materials | 23,956.2 | +0.12% |
| Communication Services | 1,746.1 | -0.13% |
| Industrials | 8,051.2 | -0.28% |
| Real Estate | 3,564.7 | -0.44% |
| Energy | 10,377.3 | -0.74% |
| Consumer Discretionary | 3,485.1 | -0.82% |
| Financials | 9,605.5 | -2.26% |
| Health Care | 26,184.9 | -6.01% |
Markets
%20intraday%20chart_22%20Apr.png)
ASX 200 Session Chart
The S&P/ASX 200 (XJO) finished 105.8 points lower at 8,843.6, 1.2% from its session high and just 0.06% from its low. Reflecting the one-way traffic in the benchmark, in the broader-based S&P/ASX 300 (XKO) advancers lagged decliners by a disappointing 99 to 173.
Consumer Staples (XSJ) (+1.1%) was the session's standout as investors sought shelter in the market's most defensive corner. Treasury Wine Estates (TWE) (+16.5%) was the headline mover after announcing a major corporate restructure. The broader staples cohort also held firm, with Woolworths (WOW) (+0.9%) and Coles (COL) (+0.4%) both edging higher.
Agricultural stocks continued the strong bid from yesterday's Macquarie sector note, with GrainCorp (GNC) (+0.9%), Cobram Estate Olives (CBO) (+0.8%), and a2 Milk Company (A2M) (+0.5%) all firmer.
Information Technology (XIJ) (+0.3%) managed a slim positive finish, continuing its recent run without making noise about it on a day when most investors had bigger concerns.
Resources (XJR) was flat, masking meaningful divergence underneath. Industrial metals stocks were broadly firmer as metals prices edged higher — COMEX copper futures rose 1.0% to US$6.067/lb and SGX iron ore futures gained 0.6% to US$107.25/t. BHP (BHP) (+1.2%), South32 (S32) (+2.0%), Champion Iron (CIA) (+1.8%), Nickel Industries (NIC) (+2.0%), and Alcoa (AAI) (+1.5%) were all stronger.
NdPr prices in China rose 0.7% to 822,500 CNY/t, supporting Iluka Resources (ILU) (+3.5%) and Arafura Rare Earths (ARU) (+1.5%). Elsewhere, Lynas Rare Earths (LYC) (-1.3%) slipped as broker reports published today reflected broad disappointment with yesterday's quarterly results.
Health Care (XHJ) (-6.0%) suffered its worst session in recent memory. Cochlear (COH) (-40.7%) was the epicentre — a guidance cut of roughly 30%, blaming weaker developed market demand, Middle East tensions, and softer US conditions sent the stock to a 10-year low of $99.58, wiping approximately $4.5 billion from its market capitalisation.
The selling spread rapidly across the sector, with few buyers prepared to stand in the way of the momentum. CSL (CSL) (-5.7%) fell to a nine-year low after the US military scrapped its annual flu shot mandate. ResMed (RMD) (-2.5%) was also lower.
Financials (XFJ) (-2.3%) extended a week of pain as another round of poorly received quarterly updates compounded sentiment that was already fragile. Bank of Queensland (BOQ) (-9.1%) led the regional bank rout after a first-half cash profit miss.
Generation Development Group (GDG) (-22.6%) was savaged on weaker managed accounts flows, fellow fund manager MA Financial (MAF) (-8.8%) also fell sharply.
Macquarie Group (MQG) (-3.8%) was hit by a Goldman Sachs downgrade to neutral. The major banks were uniformly lower on BOQ's lead — Commonwealth Bank (CBA) (-2.5%), National Australia Bank (NAB) (-2.4%), ANZ (ANZ) (-2.3%), and Westpac (WBC) (-2.1%) all declined.
The Gold Sub-Index (XGD) (-1.7%) was mixed at the stock level but net negative, as the sector's heavier-weighted names outweighed the gainers. COMEX gold futures rose 1.4% to US$4,785/oz and silver futures gained 2.6% to US$78.47/oz — a supportive commodity backdrop — but the sector-level result reflected the composition of weightings rather than broad selling. St Barbara (SBM) (-5.0%), Northern Star Resources (NST) (-3.6%), and Pantoro Gold (PNR) (-3.6%) were lower.
Energy (XEJ) was mixed. Uranium stocks were hit by a bearish lead from global uranium major Cameco, which tumbled 5.7% overnight — Paladin Energy (PDN) (-5.4%), Bannerman Energy (BMN) (-5.1%), and Boss Energy (BOE) (-3.9%) all fell.
Woodside Energy (WDS) (-1.3%) also dragged. Offsetting those moves, Ampol (ALD) (+3.8%) surged after a strong first-quarter trading update showing higher refining margins and resilient fuel demand, with the company also confirming fuel supplies secured through to end of June. New Hope Corp. (NHC) (+5.5%) and Karoon Energy (KAR) (+1.5%) were also firmer.
In commodities moves, SGX Australian Premium Coking Coal futures edged up 0.4% to $226.50/t, Newcastle coal futures rose 2.9% to $124.35/t and Brent crude slipped 0.9% to US$97.59/bbl. Australian spodumene concentrate in China was little changed at US$2,485/t.
Fund flows: An unhealthy obsession... 🤢
What is the unhealthy obsession Aussie investors (and their financial advisers) have with CSL? Ask just about any finance professional for a blue chip portfolio stalwart, and they'll usually say: "Why, CSL is in healthcare, everyone needs healthcare!"
But the last 12 months has taught us that not everyone needs healthcare stocks. There's a big difference. The Health Care sector index is down over 30% over the last year, and that's adding back dividends. If one loses 30% on one's investment, one must make around 43% to recoup it. That's some heavy lifting for a broad-market average of roughly +10% p.a. in a good year.
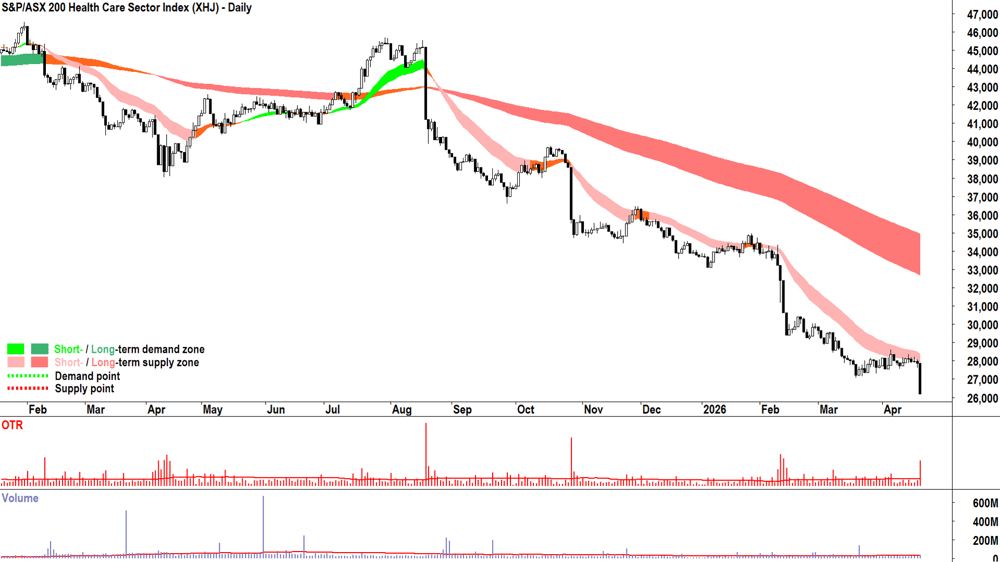
The chart above is the clearest-cut picture of excess supply in a sector index that I believe I've seen in over 30 years of watching sector meltdowns. Okay, Information Technology back in 2000 would have been worse! 😉 Anyways, it's not like one can say: Well, I didn't see today's fall coming!
I know I'm largely preaching to the converted here, so I know you no longer look at the above chart, or the two below, and think:
Ooh — that must be cheap! 🚫
It's gone down too much... 🚫
It can't go any lower from here... 🚫
Surely it's oversold!? Surely it must bounce!? 🚫
It's not fair! The market has gone crazy! 🚫
Hopefully, if the rantings here and in the webinars have done one thing for you over the last little while, they've helped you follow the trend in Australia's bluest-of-blue chip healthcare stocks (or avoid the trend in this case!) 🙅
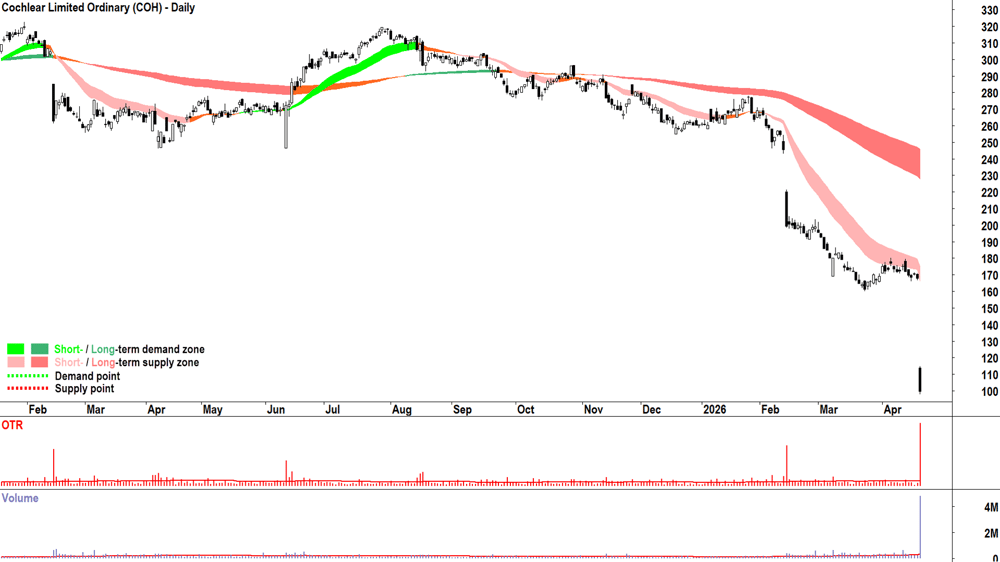
50 times. That's how many times Cochlear appeared in my ASX ChartWatch Scans downtrends watchlist during the period shown in the chart above (approx. 18 months).
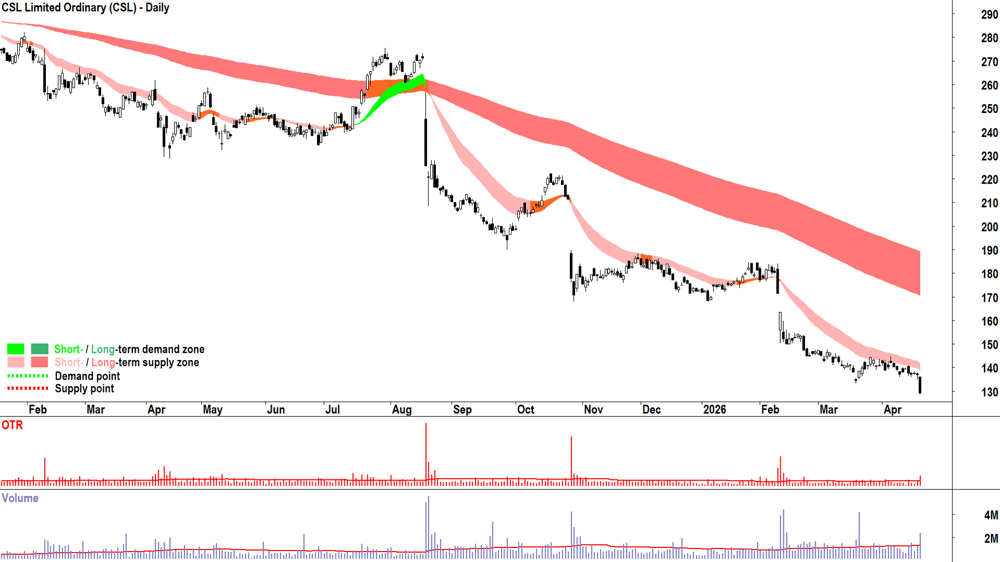
84 times. That's how many times CSL appeared in my ASX ChartWatch Scans downtrends watchlist during the period shown in the chart above.
You kinda have to remember: I ignore all fundamentals. I am 100% chart-based. If a chart doesn't go my way after getting in — well I had no idea about the fundamentals in the first place — bad luck / stupid me!
I have to ask, though, for all the smarty pants that do follow the fundamentals on these company's — whose very business it is to do so — why didn't they call these stocks an exit a combined 134 times in the last 18 months? 🤔
Today's best blue chip gainers
Company | Last Price | Change $ | Change % | 1mo % | 1yr % |
|---|---|---|---|---|---|
Treasury Wine Estates (TWE) | $4.72 | +$0.67 | +16.5% | +29.7% | -43.7% |
Ampol (ALD) | $32.80 | +$1.19 | +3.8% | -0.9% | +50.0% |
Cleanaway Waste (CWY) | $2.45 | +$0.07 | +2.9% | +6.1% | -4.3% |
Nextdc (NXT) | $14.30 | +$0.402 | +2.9% | +6.0% | +32.9% |
Downer EDI (DOW) | $7.64 | +$0.2 | +2.7% | +1.2% | +39.7% |
South32 (S32) | $4.50 | +$0.09 | +2.0% | +13.1% | +72.4% |
Dyno Nobel (DNL) | $3.27 | +$0.06 | +1.9% | +9.4% | +50.7% |
Scentre (SCG) | $3.64 | +$0.06 | +1.7% | +4.6% | +5.8% |
Worley (WOR) | $11.62 | +$0.19 | +1.7% | +9.3% | -0.3% |
Orica (ORI) | $20.98 | +$0.27 | +1.3% | +8.0% | +35.5% |
BHP (BHP) | $56.17 | +$0.66 | +1.2% | +18.3% | +53.8% |
Technology One (TNE) | $30.31 | +$0.3 | +1.0% | +13.2% | +9.9% |
Woolworths (WOW) | $38.15 | +$0.33 | +0.9% | +4.8% | +20.2% |
Medibank Private (MPL) | $4.71 | +$0.04 | +0.9% | +11.9% | +4.9% |
Bluescope Steel (BSL) | $29.51 | +$0.24 | +0.8% | +8.1% | +41.9% |
Aurizon (AZJ) | $4.12 | +$0.03 | +0.7% | +6.2% | +34.2% |
The A2 Milk Company (A2M) | $7.39 | +$0.04 | +0.5% | -22.0% | -9.0% |
PLS Group (PLS) | $5.92 | +$0.03 | +0.5% | +40.0% | +322.9% |
APA (APA) | $9.96 | +$0.05 | +0.5% | +5.2% | +20.9% |
Wisetech Global (WTC) | $45.79 | +$0.2 | +0.4% | +6.9% | -42.8% |
Today's worst blue chip losers
Company | Last Price | Change $ | Change % | 1mo % | 1yr % |
|---|---|---|---|---|---|
Cochlear (COH) | $99.58 | -$68.36 | -40.7% | -39.5% | -61.7% |
Bank of Queensland (BOQ) | $6.61 | -$0.66 | -9.1% | -4.3% | -8.8% |
CSL (CSL) | $129.19 | -$7.81 | -5.7% | -6.7% | -45.4% |
Bendigo and Adelaide Bank (BEN) | $10.61 | -$0.46 | -4.2% | +5.6% | 0% |
Macquarie (MQG) | $232.03 | -$9.24 | -3.8% | +19.0% | +28.3% |
Northern Star Resources (NST) | $22.80 | -$0.86 | -3.6% | +23.2% | -0.9% |
Westgold Resources (WGX) | $6.24 | -$0.19 | -3.0% | +18.0% | +92.0% |
Evolution Mining (EVN) | $13.20 | -$0.4 | -2.9% | +6.4% | +48.8% |
Charter Hall (CHC) | $20.60 | -$0.62 | -2.9% | +9.2% | +28.3% |
Life360 (360) | $21.68 | -$0.61 | -2.7% | +19.9% | +12.0% |
Commonwealth Bank of Australia (CBA) | $175.04 | -$4.54 | -2.5% | -0.3% | +4.2% |
Resmed (RMD) | $30.76 | -$0.78 | -2.5% | -4.3% | -6.2% |
National Australia Bank (NAB) | $40.22 | -$0.99 | -2.4% | -11.7% | +18.9% |
ANZ (ANZ) | $36.41 | -$0.87 | -2.3% | -0.5% | +30.7% |
Qantas Airways (QAN) | $8.87 | -$0.21 | -2.3% | +6.4% | +7.0% |
Seek (SEK) | $15.00 | -$0.33 | -2.2% | +3.9% | -23.9% |
Westpac Banking Corp (WBC) | $39.40 | -$0.85 | -2.1% | -3.2% | +26.4% |
Regis Resources (RRL) | $7.52 | -$0.16 | -2.1% | +21.5% | +53.5% |
AMP (AMP) | $1.440 | -$0.03 | -2.0% | +17.1% | +25.2% |
ChartWatch
Nasdaq Composite Index
Analysis
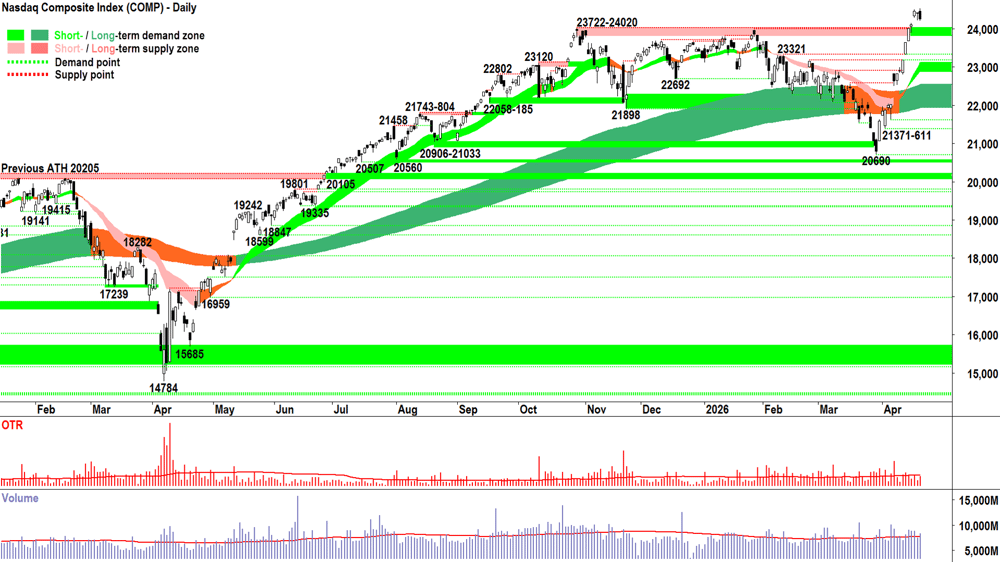
An outside bar occurs when a candle’s high is higher than its predecessor’s high, and its low is lower than its predecessor’s low. Its whole range sits outside its predecessor's range.
Tuesday’s Comp candle was an outside bar. It sets a new candidate point of supply at 24538, eclipsing Friday’s candle’s high of 24520.
That’s all jargon — I’m simply pointing out the new point of supply is 24538. We say now that as long as we remain below that point, the dink remains underway!
We’re now two days of supply sided influence on price. 🤔
Modest on Monday (i.e., downward pointing shadow indicated BTD remained healthy in the system), and more confident and impactful on Tuesday (i.e., black candle, modest, but closing near the low).
For those wondering, the engulfing nature of the candle means little without the context of its size and close. This is contrary to much writing on candles that claims engulfing candles always mean something!
If Tuesday’s candle had engulfed but closed on its high — what then? Bullish. If it engulfed, but the prior candle was small and the current candle is also small — then neither candle is of very much significance.
Tuesday’s engulfing candle is interesting to me, because it speaks to the demand side’s early optimism — which continued the prevailing trend to print a new all time high (i.e., signs of optimism, reaction to good news, whatever… it doesn’t really matter!).
But then, the supply side entered with some intent — and this time based on the above average volume — some size! ⚠️
The low close tells us the supply side had control of the Comp’s price by the close. Still, Tuesday’s candle was hardly what you’d call massive — it wasn’t a wall of highly motivated supply wiping out fleeing demand — it was simply a modest signal that the tide in the very short term is likely changing.
The MOTN for the next candle is down (not the 38th candle from here — zero relevance there — because that's not what candles do!).
It’s that simple. The dink that started Monday remains afoot, and so, we remain vigilant to the warning signs that the supply side is growing in motivation (i.e., longer and longer supply side candles = black-bodied and or upward pointing shadows) and or size (i.e., greater volume).
We’ll also be on the lookout for the tell-tale signs that the dink has run its course and the demand side has stepped back in with sizeable motivation (i.e., longer and longer demand side candles = white-bodied and or downward pointing shadows) and or size (i.e., greater volume).
That’s it!
But that’s what we do every day. No fuss… No “Oh dear, what if that happens or what if this happens…” No care for the headlines that are deliberately written to hoover up clicks and make you emotionally involved in your investing!
Nope, not us! New candle? Easy: Analyse, Accept, Act!
View
2/3RP (RP = Risk Position — it reflects my personal allowable capital allocation limit for my investments in US stocks. So 1/2RP is 50%, 2/3RP is 67% and FRP is 100% 🪣). I'm waiting to assess this dink before committing to FRP.
Key levels
24538 is the only point of supply to contend with. The old all-time high supply zone of 23722-24020 will likely act as a short term zone of demand, however the short-term trend ribbon (presently 22879-23098) is now the key zone of demand. If the price closes back below this range, the supply-side is very likely back in control of the Comp's price.
S&P/ASX 200 (XJO)
%20chart_22%20Apr.png)
Analysis
And that’s kinda why we’re still at 1/2RP on the S&P/ASX 200 (also very aptly known as The Old Tin Pot). It simply didn't deliver the strong demand side confirmation I like to see after a dink.
As many of you know, ‘dink’ is the very technical term I use to describe the first supply side challenge-vs-demand side reply in a new trend phase.
In this case, it was both the short- and long-term trends that required dink confirmation as the OTP’s price moved from below to above the pair earlier this month.
Note the dink trough set at 8889 — show me even one strong demand side signal following it. You can’t because there isn’t. 🙅
The demand side didn’t have the ammunition or the motivation to keep the 8262-8987 rally going. It’s not there in the price action (i.e., note the tell-tale cluster of upward pointing shadows and black-bodied candles), nor was it there in the below average volume.
The supply side, on the other hand, remained peskily vigilant, nagging away at three attempts to proceed higher (i.e., note the upward pointing shadows on 14-16-Apr) — nope, STR each time! 👎
Today, with just a hint of a negative lead from Wall St. — the OTP crumbled back into excess supply mode.
This doesn’t mean all is lost for the bulls, as today’s candle remains modest within the context of the rally that preceded it. Simply, we must await further confirmation that this is only a temporary and shallow retracement (i.e., 'healthy dink'!).
The short- and long term trend ribbons are now critical. MOTN during uptrends, both act as zones of dynamic excess demand — helping trampoline the price back up. Presently, the short term trend ribbon sits at 8806-8830, and the long term at 8684-8764. Let’s call it 8684-8830.
You know the drill… if we see in that range:
White-bodied candles and or those with downward pointing shadows (the longer these candle traits — the greater the motivation among the demand side) = FOMO + HOFU + BTD ✅
Black-bodied candles and or those with upward pointing shadows (the longer these candle traits — the greater the motivation among the supply side) = 🚫FOMO + 🚫HOFU + STR ⚠️
View
Feeling pretty vindicated at not taking the bait and sticking with 1/2RP. Still, the broader techincals remain constructive, and it would only take close above 9022 with a strong demand side candle to commit to a move to 2/3RP 🪣 (i.e., my personal allowable capital allocation limit for my investments in Australian stocks would increase from the present 50% to 67%).
Key levels
9201, the all time high, is the key point of supply. Below it there likely remains a degree of trepidation among market participants. A close above the last peak at 9022 would be constructive.
8889 melted today, meaning the short-term trend ribbon (presently 8806-8830) is now the key zone of demand. If the price closes back below this range, the supply-side is very likely back in control of the OTP's price.
(Glossary of acronyms! MOTN: More Often Than Not | FOMO: Fear Of Missing Out | HOFU: Holding On For Upside | BTD: Buy The Dip | STR: Sell The Rally | RP: Risk Position)
***UNFORTUNATELY DUE TO TECHNICAL ISSUES TODAY'S CHARTWATCH *LIVE* WEBINAR WAS NOT RECORDED 😭***
I will make the necessary adjustments 🤜💻 and ensure everything is in full working order next week!
ChartWatch *LIVE* Webinar
ChartWatch *LIVE* Webinars – WEEKLY Wednesday's @ 12pm AEDT
Learn more about technical analysis and trend following through real case studies on ASX stocks. Australia's premier technical analyst, Carl Capolingua, shares his unique insights on stocks as requested by viewers. Ask about a company in your portfolio or anything related to trading and investing and get Carl's expert opinion.
Places are limited so >REGISTER NOW!<
Economy
Today
There weren't any major economic data releases in our time zone today
Later this week
Thursday
09:00 AUS April Flash Purchasing Managers Index (PMI)
Manufacturing: was 49.8 in March
Services: was 46.3 in March
09:00 USA April Flash PMIs
Manufacturing: 52.5 forecast vs 49.8 in March
Services: was 50.1 forecast vs 46.3 in March
Friday
No major economic data scheduled for release on this day
Latest News
Interesting Movers
Trading higher
+16.5% Treasury Wine Estates (TWE) – New regional operating model and 3Q26 depletions update, upgraded to overweight from neutral at Jarden, and to neutral from sell at Citi.
+5.9% Kingsgate Consolidated (KCN) – No news.
+5.5% New Hope Corp. (NHC) – No news.
+4.3% Predictive Discovery (PDI) – Becoming a substantial holder (Cohen family +7.4%) .
+4.3% Develop Global (DVP) – No news.
+3.8% Ampol (ALD) – 1Q2026 Trading Update and Update on Fuel Supply Arrangements.
+3.5% Iluka Resources (ILU) – Quarterly Review to 31 March 2026.
Trading lower
-40.7% Cochlear (COH) – Trading update and reduction to FY26 earnings guidance, general weakness across the broader HealthCare sector today, fall is consistent with prevailing short and long term downtrends, a regular in ChartWatch ASX Scans Downtrends list 🔎📉
-22.6% Generation Development (GDG) – March 2026 quarterly update, general weakness across the broader Financials sector today, fall is consistent with prevailing short and long term downtrends, a regular in ChartWatch ASX Scans Downtrends list 🔎📉
-9.1% Bank of Queensland (BOQ) – 2026 Half Year Results, general weakness across the broader Financials sector today.
-8.8% MA Financial (MAF) – No news, general weakness across the broader Financials sector today, fall is consistent with prevailing short and long term downtrends, a regular in ChartWatch ASX Scans Downtrends list 🔎📉
-8.1% Judo Capital (JDO) – No news, general weakness across the broader Financials sector today, fall is consistent with prevailing short and long term downtrends, a regular in ChartWatch ASX Scans Downtrends list 🔎📉
-5.7% CSL (CSL) – No news from the company, US military scrapped its annual flu shot, general weakness across the broader HealthCare sector today, fall is consistent with prevailing short and long term downtrends, one of the most Featured (highest conviction) stocks in ChartWatch ASX Scans Downtrends list 🔎📉
-5.4% Paladin Energy (PDN) – March 2026 Quarter Presentation, general weakness across the broader Uranium sector today.
-5.1% Bannerman Energy (BMN) – No news, general weakness across the broader Uranium sector today.
-5.0% Bapcor (BAP) – Ceasing to be a substantial holder (The Vanguard Group), general weakness across the broader Consumer Discretionary sector today, fall is consistent with prevailing short and long term downtrends, one of the most Featured (highest conviction) stocks in ChartWatch ASX Scans Downtrends list 🔎📉
-4.8% Ebos (EBO) – Impact of elevated fuel costs on FY26 earnings outlook, general weakness across the broader HealthCare sector today, fall is consistent with prevailing short and long term downtrends, a regular in ChartWatch ASX Scans Downtrends list 🔎📉
-4.4% Accent Group (AX1) – No news, general weakness across the broader Consumer Discretionary sector today, fall is consistent with prevailing short and long term downtrends, one of the most Featured (highest conviction) stocks in ChartWatch ASX Scans Downtrends list 🔎📉
Broker Moves
4DMedical (4DX)
Downgraded to hold from buy at Jefferies; Price Target: $5.90 from $4.90
Ampol (ALD)
Retained at outperform at Macquarie; Price Target: $40.00
Atlas Arteria (ALX)
Retained at buy at Jefferies; Price Target: $5.43 from $5.56
Retained at outperform at Macquarie; Price Target: $5.02 from $5.43
Retained at equal-weight at Morgan Stanley; Price Target: $4.96
Retained at sector perform at RBC Capital Markets; Price Target: $4.75 from $5.00
Retained at neutral at UBS; Price Target: $4.50 from $5.15
ANZ Group Holdings (ANZ)
Retained at sell at Morgans; Price Target: $30.72 from $32.65
BHP Group (BHP)
Retained at neutral at Macquarie; Price Target: $53.00
Bank of Queensland (BOQ)
Retained at buy at Citi; Price Target: $7.15
Retained at buy at UBS; Price Target: $7.50
Black Pearl Group (BPG)
Retained at speculative buy at Bell Potter; Price Target: $1.82 from $1.76
CAR Group (CAR)
Retained at buy at UBS; Price Target: $33.80 from $39.60
Challenger (CGF)
Retained at buy at Citi; Price Target: $10.00
Retained at neutral at Jarden; Price Target: $8.70 from $8.60
Retained at overweight at JPMorgan; Price Target: $10.00
Retained at outperform at Macquarie; Price Target: $9.40 from $10.00
Retained at equal-weight at Morgan Stanley; Price Target: $8.55
Retained at buy at Ord Minnett; Price Target: $9.85
Retained at buy at UBS; Price Target: $10.10 from $10.05
Cochlear (COH)
Retained at neutral at Macquarie; Price Target: $239.00
CSL (CSL)
Retained at hold at Ord Minnett; Price Target: $186.00 from $198.00
Cleanaway Waste Management (CWY)
Retained at overweight at Morgan Stanley; Price Target: $2.91
Retained at buy at Morgans; Price Target: $2.80 from $2.95
Retained at outperform at RBC Capital Markets; Price Target: $3.20
Retained at buy at UBS; Price Target: $3.05
Dalrymple Bay Infrastructure (DBI)
Initiated at buy at Ord Minnett; Price Target: $6.00
Elementos (ELT)
Retained at speculative buy at Morgans; Price Target: $0.51 from $0.30
Generation Development Group (GDG)
Retained at buy at Citi; Price Target: $6.40 from $6.80
Gemlife Communities Group (GLF)
Upgraded to buy from accumulate at Morgans; Price Target: $5.66 from $5.84
HUB24 (HUB)
Retained at buy at Bell Potter; Price Target: $110.00 from $120.00
Retained at positive at E&P; Price Target: $132.10 from $144.30
Downgraded to neutral from outperform at Macquarie; Price Target: $94.70 from $92.75
Retained at buy at Moelis Australia; Price Target: $119.12 from $123.04
Retained at overweight at Morgan Stanley; Price Target: $126.00
Retained at accumulate at Morgans; Price Target: $96.50 from $112.40
Retained at accumulate at Ord Minnett; Price Target: $99.00 from $112.00
IGO (IGO)
Retained at equal-weight at Morgan Stanley; Price Target: $7.50
Lovisa Holdings (LOV)
Retained at buy at Citi; Price Target: $32.00
Lynas Rare Earths (LYC)
Retained at outperform at CLSA; Price Target: $22.00 from $19.30
Retained at buy at Jefferies; Price Target: $25.50
Retained at overweight at JPMorgan; Price Target: $22.00
Retained at neutral at Macquarie; Price Target: $20.00 from $20.50
Retained at sell at Ord Minnett; Price Target: $14.00
Retained at buy at UBS; Price Target: $23.65 from $23.90
MA Financial Group (MAF)
Retained at buy at Morgans; Price Target: $10.93 from $11.69
Retained at buy at Ord Minnett; Price Target: $9.20 from $10.05
Macmahon Holdings (MAH)
Downgraded to hold from buy at Argonaut Securities; Price Target: $0.80
Meteoric Resources NL (MEI)
Retained at speculative buy at Ord Minnett; Price Target: $0.25
Mitchell Services (MSV)
Upgraded to accumulate from hold at Morgans; Price Target: $0.55 from $0.50
National Storage REIT (NSR)
Retained at neutral at Macquarie; Price Target: $2.63
NEXTDC (NXT)
Retained at buy at Citi; Price Target: $18.60
Retained at overweight at Morgan Stanley; Price Target: $18.00 from $19.00
Predictive Discovery (PDI)
Retained at speculative buy at Canaccord Genuity; Price Target: $1.64
REA Group (REA)
Retained at buy at UBS; Price Target: $209.00
Rio Tinto (RIO)
Retained at neutral at Citi; Price Target: $170.00
Retained at outperform at CLSA; Price Target: $190.00 from $182.00
Retained at neutral at Goldman Sachs; Price Target: $165.30 from $164.90
Retained at outperform at Macquarie; Price Target: $186.00 from $183.00
Retained at accumulate at Ord Minnett; Price Target: $172.00
Retained at sector perform at RBC Capital Markets; Price Target: $141.00 from $143.00
Regal Partners (RPL)
Retained at buy at Morgans; Price Target: $4.20 from $5.00
SEEK (SEK)
Retained at buy at UBS; Price Target: $18.20 from $24.30
Sunstone Metals (STM)
Retained at buy at Shaw and Partners; Price Target: $2.10
Treasury Wine Estates (TWE)
Upgraded to neutral from sell at Citi; Price Target: $4.25
Upgraded to overweight from neutral at Jarden; Price Target: $5.00
Retained at neutral at Macquarie; Price Target: $5.30
Worley (WOR)
Retained at accumulate at Ord Minnett; Price Target: $12.80 from $13.10
Scans
Top Gainers
Code | Company | Last | % Chg |
|---|---|---|---|
| T3D | 333D Ltd | $0.043 | +79.17% |
| SLM | Solis Minerals Ltd | $0.079 | +46.30% |
| MIO | Macarthur Minerals Ltd | $0.031 | +29.17% |
| C29 | C29 Metals Ltd | $0.032 | +23.08% |
| SRJ | SRJ Technologies Group Plc | $0.011 | +22.22% |
Top Fallers
Code | Company | Last | % Chg |
|---|---|---|---|
| COH | Cochlear Ltd | $99.58 | -40.71% |
| GDG | Generation Development Group Ltd | $3.56 | -22.61% |
| DXN | DXN Ltd | $0.02 | -20.00% |
| EPX | EPX Ltd | $0.23 | -17.86% |
| SQX | SQX Resources Ltd | $0.105 | -16.00% |
52 Week Highs
Code | Company | Last | % Chg |
|---|---|---|---|
| RNT | Rent.com.Au Ltd | $0.069 | +13.12% |
| GA8 | Goldarc Resources Ltd | $0.079 | +12.86% |
| BOA | BOA Resources Ltd | $0.049 | +11.36% |
| SPN | Sparc Technologies Ltd | $0.36 | +10.77% |
| PR1 | Pure Resources Ltd | $0.57 | +9.62% |
52 Week Lows
Code | Company | Last | % Chg |
|---|---|---|---|
| COH | Cochlear Ltd | $99.58 | -40.71% |
| GDG | Generation Development Group Ltd | $3.56 | -22.61% |
| TIO | Temas Resources Corp | $0.115 | -11.54% |
| KNG | Kingsland Minerals Ltd | $0.071 | -11.25% |
| MAG | Magmatic Resources Ltd | $0.03 | -9.09% |
Near Highs
Code | Company | Last | % Chg |
|---|---|---|---|
| IHD | iShares S&P/ASX DIV Opportunities Esg Screened ETF | $17.13 | 0.00% |
| AYLD | Global X S&P/ASX 200 Covered Call Complex ETF | $10.27 | +0.10% |
| MVB | Vaneck Australian Banks ETF | $44.97 | -0.62% |
| HGBL | Betashares Global Shares Currency Hedged ETF | $80.03 | -0.04% |
| AHL | Adrad Holdings Ltd | $1.255 | +2.45% |
Relative Strength Index (RSI) Oversold
Code | Company | Last | % Chg |
|---|---|---|---|
| DGL | DGL Group Ltd | $0.38 | -3.80% |
| HVN | Harvey Norman Holdings Ltd | $4.57 | -2.97% |
| EVO | Embark Early Education Ltd | $0.40 | -1.24% |
| EML | EML Payments Ltd | $0.395 | +5.33% |
| ORA | Orora Ltd | $1.465 | -0.34% |
