News | Market Wraps
Evening Wrap: ASX 200 slumps on panic selling in gold and silver stocks, NEM -10%, NST -8%
The S&P/ASX 200 closed 90.5 points lower, down -1.02%.

Mentioned
The S&P/ASX 200 closed 90.5 points lower, down -1.02%.
The ASX 200 drifted toward a one-month low as whipsaw price action in precious metals and base metals triggered forced selling in Resources (XJR) (-3.1%) and turbocharged intraday volatility. Markets were also pricing tomorrow’s first RBA meeting of 2026, with indications of a 72% chance of hike in the cash rate to 3.85%.
Contrasting weakness in miners, banks held up well, with the Financials (XFJ) (+0.1%) sector notched its second gain in two losing sessions for the benchmark. Commonwealth Bank (CBA) (+2.3%) closed off its highs but still logged a healthy gain.
Meanwhile, Information Technology (XIJ) (-1.1%) extended a five-session slide to its lowest level since February 2024.
BHP (BHP) (-2.2%) and Rio Tinto (RIO) (-1.0%) held up reasonably well among the major miners, but South32 (S32) (-4.3%) and Sandfire Resources (SFR) (-3.9%) weren't as lucky.
In stock-specific news, GrainCorp (GNC) (-14%) slid sharply after it cut its EBITDA guidance to $200–240 million, well short of consensus estimates.
Be sure to click/scroll through for the usual reporting of the major sector and stock-specific moves, the broker responses to them, as well as all the key economic data in tonight's Evening Wrap.
Also, I have detailed technical analysis on the Nasdaq Composite and the S&P/ASX 200 in today's ChartWatch.
Let's dive in!
Today in Review
Mon 02 Feb 26, 5:30pm (AEST)
Name | Value | % Chg |
|---|---|---|
Major Indices | ||
| ASX 200 | 8,778.6 | -1.02% |
| All Ords | 9,068.8 | -1.05% |
| Small Ords | 3,793.7 | -1.96% |
| All Tech | 3,089.8 | -1.16% |
| Emerging Companies | 3,156.7 | -3.37% |
Currency | ||
| AUD/USD | 0.6924 | -0.56% |
US Futures | ||
| S&P 500 | 6,874.25 | -1.31% |
| Dow Jones | 48,592.0 | -0.85% |
| Nasdaq | 25,212.5 | -1.78% |
Name | Value | % Chg |
|---|---|---|
Sector | ||
| Communication Services | 1,718.8 | +0.50% |
| Financials | 9,180.0 | +0.14% |
| Utilities | 9,720.5 | +0.02% |
| Consumer Staples | 11,785.9 | -0.03% |
| Consumer Discretionary | 3,944.4 | -0.31% |
| Real Estate | 3,830.0 | -0.38% |
| Industrials | 8,347.8 | -0.58% |
| Information Technology | 1,938.1 | -1.13% |
| Health Care | 33,896.2 | -1.65% |
| Energy | 9,137.2 | -2.00% |
| Materials | 22,535.9 | -3.09% |
Markets
%20intraday%20chart_2%20Feb.png)
ASX 200 Session Chart
The S&P/ASX 200 (XJO) finished 90.5 points lower at 8,778.6, 1.0% from its session high and just 0.37% from its low. In the broader-based S&P/ASX 300 (XKO) decliners outnumbers advancers by a disturbing 187 to 94.
Fund flows: Investors thrown into the Warshing machine!
Trump, Warsh, gold and silver melt down...
Any number of excuses can be applied to today’s dumping of precious metals and resources stocks. Ultimately, as usual, it comes down to fund flows.
The flow of capital into those assets over the last 6-months was extreme — to say is has been “all demand and no supply” during that period would only be a modest exaggeration!
Those fund flows were being driven by certain narratives of which those of us who are 100% technical analysis + trend following would care little about:
Falling real yields
De-dollarisation / divestment of US risk-free assets
Central-bank buying
Persistent geopolitical unease
Fears about US Fed independence
etc. etc!
It was the same narrative-believing buyers buying from the same reluctant narrative-believing sellers. (With a bunch of speculative narrative-believing traffic over the top! 🚀)
Then you get a bit of news, i.e., new information, that halts demand and forces a bit of supply. Hot money demand dries up, weak hands get margin calls, and then get liquidated. Positional demand stopped buying about 20% ago… waiting for the pullback… so they're not supporting the first 20% dump... which means you're left with a demand-side vacuum.
To say the last two trading sessions have been “all supply and no demand” would only be a modest exaggeration!
Where does this leave our up-until-Thursday’s-all-time-high Resources (XJR) (-3.1%) sector? On alert for me... Bruised but not broken... Yet! (see chart below)
%20chart_2%20Feb.png)
ASX 200 Resources Sector Index (XJR) chart
You can see some demand creeping in at the short term uptrend ribbon, but also a couple of decent warning signals in Friday's and Monday's candles. Pullbacks within strong trends are very normal, you can see several since the XJR’s present long term uptrend began back in September.
However, what’s not normal, is the pullback in precious metals — which have been critical drivers of the XJR’s rally.
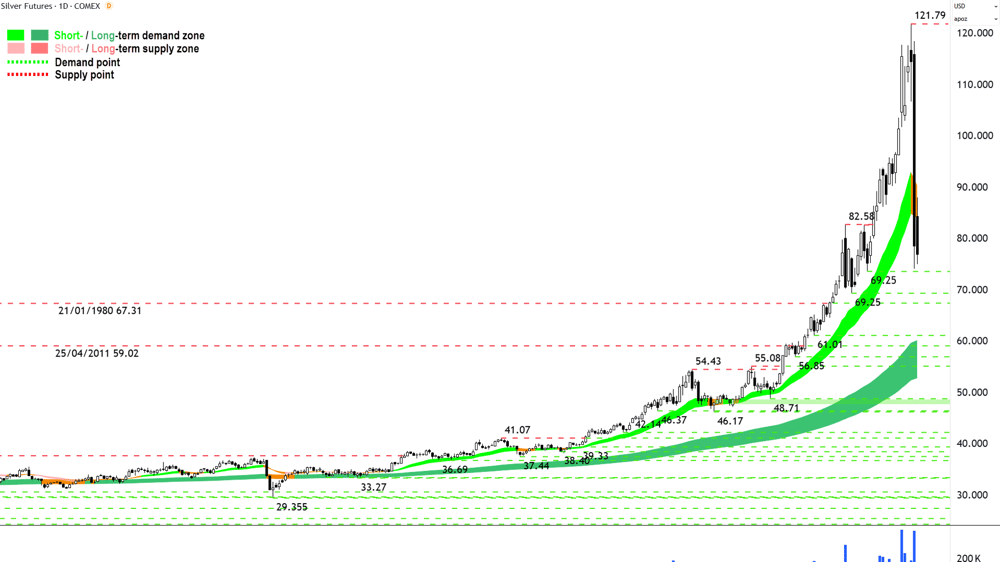
Silver Futures (Front month, back-adjusted) COMEX chart
“That candle” on silver is nothing like normal — it's a generational outlier. In my experience, such candles signal the end of the cycle FMOTN (Far More Often Than Not! 😉). This is how the silver and gold commodity price moves have spilled into the ASX — via the Gold Sub-index (XGD) (-7.2%):
%20chart_2%20Feb.png)
All Ordinaries Gold Sub-index (XGD) chart
But the XJR is far more than just a few silver and gold stocks. Look at BHP Group (BHP) (-2.3%) and Rio Tinto (RIO) (-1.0%) charts below. Arguably far less damage. So, I suggest that silver’s FMOTN death-knell is far from a corresponding death sentence for the XJR.
%20chart%20_2%20Feb.png)
%20chart%20%20_2%20Feb.png)
BHP Group (BHP) chart (TOP), Rio Tinto (RIO) chart (bottom)
If you watch my ChartWatch *LIVE* Webinars, you’ll be familiar with my views on incremental risk management — i.e., adjusting risk little by little as the demand-supply dynamics change for or against a position.
I’ll leave you with a question for now, but I'll aim to answer it with my charts in Wednesday's webinar: What do the charts above say about how one should manage their risks? +R, =R, or -R!? 🤔
Today's best blue chip gainers
Company | Last Price | Change $ | Change % | 1mo % | 1yr % |
|---|---|---|---|---|---|
Whitehaven Coal (WHC) | $9.12 | +$0.29 | +3.3% | +17.7% | +50.7% |
PLS Group (PLS) | $4.39 | +$0.1 | +2.3% | +4.0% | +86.0% |
Amcor PLC (AMC) | $63.48 | +$0.99 | +1.6% | +1.2% | -20.2% |
The A2 Milk Company (A2M) | $8.60 | +$0.13 | +1.5% | -6.6% | +47.8% |
Commonwealth Bank of Australia (CBA) | $151.48 | +$2.12 | +1.4% | -5.7% | -4.8% |
IGO (IGO) | $8.43 | +$0.11 | +1.3% | +2.8% | +63.7% |
Metcash (MTS) | $3.36 | +$0.04 | +1.2% | +1.8% | +7.3% |
APA Group (APA) | $8.96 | +$0.1 | +1.1% | -0.1% | +30.6% |
JB HI-FI (JBH) | $81.99 | +$0.84 | +1.0% | -14.8% | -17.5% |
Qantas Airways (QAN) | $10.17 | +$0.1 | +1.0% | -2.0% | +9.5% |
AGL Energy (AGL) | $9.13 | +$0.08 | +0.9% | -1.9% | -22.6% |
Fortescue (FMG) | $21.18 | +$0.18 | +0.9% | -3.8% | +10.9% |
Medibank Private (MPL) | $4.65 | +$0.03 | +0.6% | -2.9% | +19.8% |
Telstra Group (TLS) | $4.91 | +$0.03 | +0.6% | +0.8% | +22.4% |
Coles Group (COL) | $21.39 | +$0.11 | +0.5% | -0.2% | +10.5% |
Car Group (CAR) | $27.71 | +$0.11 | +0.4% | -9.9% | -30.5% |
Life360 (360) | $27.52 | +$0.1 | +0.4% | -17.9% | +10.2% |
Bank of Queensland (BOQ) | $6.81 | +$0.02 | +0.3% | +4.3% | -0.4% |
Bendigo and Adelaide Bank (BEN) | $11.00 | +$0.03 | +0.3% | +4.6% | -17.9% |
Brambles (BXB) | $22.46 | +$0.06 | +0.3% | -2.2% | +15.1% |
Today's worst blue chip losers
Company | Last Price | Change $ | Change % | 1mo % | 1yr % |
|---|---|---|---|---|---|
Newmont Corp. (NEM) | $155.96 | -$17.32 | -10.0% | +3.8% | +134.1% |
Genesis Minerals (GMD) | $6.97 | -$0.62 | -8.2% | -3.9% | +126.3% |
Northern Star Resources (NST) | $26.60 | -$2.34 | -8.1% | -0.5% | +57.0% |
Capricorn Metals (CMM) | $13.65 | -$1.14 | -7.7% | -5.1% | +80.1% |
Ramelius Resources (RMS) | $4.41 | -$0.31 | -6.6% | +6.0% | +84.5% |
Evolution Mining (EVN) | $13.88 | -$0.83 | -5.6% | +9.5% | +146.1% |
Perseus Mining (PRU) | $5.63 | -$0.27 | -4.6% | -0.9% | +98.9% |
South32 (S32) | $4.42 | -$0.2 | -4.3% | +24.2% | +34.3% |
Sandfire Resources (SFR) | $19.07 | -$0.78 | -3.9% | +6.4% | +95.4% |
Hub24 (HUB) | $97.58 | -$3.91 | -3.9% | +1.4% | +22.8% |
Santos (STO) | $6.78 | -$0.23 | -3.3% | +9.9% | -3.4% |
Pro Medicus (PME) | $178.15 | -$5.97 | -3.2% | -19.3% | -33.7% |
Block (XYZ) | $85.10 | -$2.54 | -2.9% | -13.0% | -39.8% |
Atlas Arteria (ALX) | $4.83 | -$0.14 | -2.8% | -1.0% | -3.8% |
Wisetech Global (WTC) | $56.41 | -$1.59 | -2.7% | -17.6% | -53.1% |
Washington H. Soul Pattinson (SOL) | $37.59 | -$1. | -2.6% | +1.2% | +11.3% |
CSL (CSL) | $177.08 | -$4.34 | -2.4% | +2.6% | -36.2% |
Nextdc (NXT) | $13.01 | -$0.31 | -2.3% | +3.8% | -11.1% |
BHP Group (BHP) | $49.42 | -$1.15 | -2.3% | +8.6% | +26.3% |
Eagers Automotive (APE) | $26.24 | -$0.59 | -2.2% | +6.5% | +119.3% |
ChartWatch
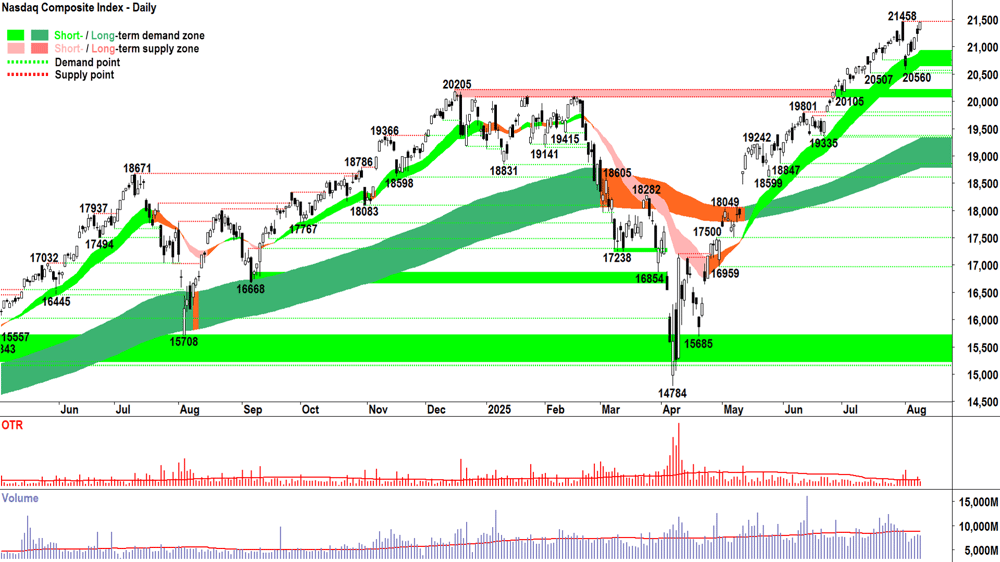
Nasdaq Composite Index
Analysis
You know all that supply we’ve been tracking / fretting in the 23722-24020 zone?
It looks like it got a tad more motivated on Friday… and that motivation was compounded with a little more size = first above average volume day in the last 6 candles.
The buy the dip demand didn’t completely dissolve: above average volume represents sellers and the buyers that took on their risk. But the demand-side’s lack of motivation to compete on price hardly inspires confidence.
Silver’s move on Friday is a perfect example of one of really, only a couple of chinks in the trend follower’s armour: the inability to see what one cannot see — i.e., an impending massive trend reversal — when there are few signals in the price action and candles that one is coming.
Basically, the biggest flaw in trend following is one’s inability to tell the future! 🔮
No doubt, though, there are many out there spouting useless idioms like “Blind Freddy could have seen that fall coming”.
I don’t know about Blind Freddy, but no doubt even professional idiom spouters have perfect 20-20 hindsight! 🤓
If you’re wondering why I haven’t been running regular commentary on silver and other commodities, it’s because ChartWatch Markets is on hiatus. I’m working on replacing it with a series of short videos that one can watch instead of having to read. Stay tuned for those in the near future. 📺
As for silver, I did manage to provide some insights into the potential for a major reversal in Wednesday's ChartWatch *LIVE* Webinar. Watch the recording from roughly 7-10 minutes. I couldn’t “call it” because I didn’t have enough information in the candles.
Then, there was that candle — the 30-Jan wipeout ⬛🕯️! Which brings me to the other chink: A one-candle move that’s so big, there’s just no time to manage one’s risk to any great magnitude in advance.
No model is infallible. Mine certainly isn’t. But I take solace in the fact that neither are those of our favourite idiom spouters!
Anyways, what’s the relevance of all of this with respect to the Comp chart? 🤔
It’s this:
The technicals we can see are still demand-side control biased.
There are some credible signals in the last few candles that the supply-side’s influence is growing (bullet dodged with Thursday’s long downward pointing shadow and grazed on Friday).
If today’s ASX 200 move is a precursor to shifting global risk appetite, we may see a big candle tonight that doesn’t allow a pre-emptive strike on managing risk.
Given the above, and given that unlike idiom spouters, I refuse to make predictions, I must stay the course on the Comp.
On the last point, clearly though — at a heightened level of alertness — preferring not to add any new long-side risk for the time-being.
I argue, however, that there isn’t enough evidence in the chart above that the supply-side actually has control of the Comp’s price to require a move away from my present portfolio risk limit.
But consider this: the average balanced fund typically holds between 5-10% cash. Index funds are 0% cash by definition. So, my present portfolio risk limit of 2/3RP implies an already super-conservative-by-regular-industry-standards one-third cash allocation.
That's even more reason to sit on the couch with my old mate Blind Freddy and a box of popcorn tonight and watch how the candles play out! 🍿
View
I am on hold for the addition of new long-side portfolio risk, but officially, remain at my 2/3RP portfolio risk limit 🪣 (RP = Risk Position — it reflects my personal allowable capital allocation limit for my investments in US stocks. So 1/2RP is 50%, 2/3RP is 67% and FRP is 100%). A close below 22692 would trigger a move to 1/2RP.
Key levels
The next zone of demand is 22692-916. If the Comp closes below that zone, we can assume the supply side is in control. On a close below 21898 the long term uptrend is likely under significant pressure = ⚠️. 23722-24020 is the nearest critical zone of supply — the Comp must close within/above this zone with a strong demand-side candle to confirm the demand-side is unequivocally back in control of the Comp's price.
S&P/ASX 200 (XJO)
%20chart_2%20Feb.png)
Analysis
Okay Fred my old mate, what do we think about this chart? 🙈
Black candle + Decent length + Close near the low of the session = Supply-side control + highly motivated supply + motivated excess supply steady through day, little impact of bargain hunters… likely therefore unrequited supply remaining in the system!
Volume? (As with Friday's supply-side candle) Above average showing = decent whack of supply finding its way into the system = ⚠️
There’s a few other bits… like the complete uselessness of the short term uptrend ribbon — that’s MOTN (More Often Than Not) associated with a market devoid of buy-the-dippers… plus a rather forceful tickle of the 8765 point of demand = ditto on buy-the-dippers are on strike! ⚠️
Put it all together and you get a giant pile of steaming…
HO-HUM.
You thought I was going to say something else there, didn’t you! I have way too much decorum for that! 😉
Okay, portfolio risk management call time. I’m at 2/3RP. As noted above, that’s a substantial whack of cash compared to industry standards already. But do I take an extra precautionary step and go to 1/2RP? 🤔
If you’re following along at home, you know that I (you?) have been that way-or-lower-risk-rated since mid-October (i.e., 1/2RP and as low as 1/3RP).
Think about how dichotomous our market has been over that time… particularly the underperformance of many of the bluest-of-blue-chip stocks in Financials, Consumer Discretionary, Technology, and Healthcare.
Do you feel like you’ve missed a great deal by being less than fully invested? 🤷
Consider that cash doesn’t earn zero — it earns a few percent (and a bit more if you’re savvy). And if the market tanks from here… then that cash effectively grows in purchasing power by however much the market falls. 10%? 20%? 57% like in the GFC? 🤯
If the HO-HUM hits the fan… I suggest that my model is going to beat most passive and discretionary funds (save for those focussed on going short!).
So: 2/3RP or 1/2RP?
It’s a very close given the short term trend ribbon and 8765 have gone. Let’s go with: I will suspend adding all new long-side risk exposure and let my portfolio risk reduce by “natural attrition” to 1/2RP.
A close below the long term uptrend ribbon (presently 8602-8707) would see me move to my maximum risk-averse setting of 1/3RP. Let’s also be optimists, hey, why the ruddy hell not!? A close above the newly formed point of supply at 8979 would see me move back to 2/3RP again.
Oh, Old Tin Pot… you’ve done it again! 😭
View
I will suspend adding all new long-side risk exposure and let my portfolio risk reduce by “natural attrition” to 1/2RP 🪣.
Key levels
The long term trend ribbon is the closest zone of (dynamic) demand (presently 8602-8707). 8675 remains the closest static point of demand. A close below the long term uptrend ribbon would neutralise the present long term uptrend. 8979 is the next key zone of supply.
ChartWatch *LIVE* Webinar
ChartWatch *LIVE* Webinars – WEEKLY Wednesday's @ 12pm AEDT
Learn more about technical analysis and trend following through real case studies on ASX stocks. Australia's premier technical analyst, Carl Capolingua, shares his unique insights on stocks as requested by viewers. Ask about a company in your portfolio or anything related to trading and investing and get Carl's expert opinion.
Places are limited so >REGISTER NOW!<
Economy
Today
AUS February MI Inflation Gauge
Result: +0.2% m/m vs +1% m/m in January
AUS February ANZ Job Advertisements
Result: +4.4% m/m vs -0.8% m/m in January
Later this week
Tuesday
11:30 AUS February Building Approvals (-6.4% m/m forecast and +15.2% m/m in January)
14:30 AUS February RBA Meeting
Cash Rate: +3.85% m/m forecast and +3.6% m/m in December
RBA Rate Statement and press conference with Governor Michelle Bullock to follow at 3:30pm AEDT.
Wednesday
02:00 USA January JOLTS Job Openings (7.21 million vs 7.15 million in December)
Thursday
11:30 AUS February Goods Trade Balance (+3.45 billion m/m forecast and +2.94 billion m/m in January)
Tentative AUS February NAB Quarterly Business Confidence
Friday
9:30 AUS RBA Gov Bullock Speaks
Saturday
12:30 USA January Non-farm Payrolls
Employment Change: +67,000 forecast vs +50,000 in December
Unemployment Rate: +4.4% forecast vs 4.4% in December
Latest News
Interesting Movers
Trading higher
+7.0% Lumos Diagnostics Holdings (LDX) – No news 🤔.
+6.9% Brainchip Holdings (BRN) – No news 🤔.
+6.6% Nine Entertainment Co. Holdings (NEC) – Continued positive response to 30-Jan Nine accelerates strategic transformation, upgraded to positive from neutral at E&P and price target increased to $1.30 from $1.25.
+6.0% Kelly Partners Group Holdings (KPG) – No news 🤔.
+5.5% Alpha HPA (A4N) – No news, rebounded after Friday’s sharp sell-off due to Successful A$225M Capital Raising Supports Stage 2 Project.
+5.4% Tivan (TVN) – No news, rise is consistent with prevailing short and long term uptrends, a regular in ChartWatch ASX Scans Uptrends list 🔎📈
+3.9% Droneshield (DRO) – No news, bounced in the wake of the recent sharp selloff.
+3.3% Whitehaven Coal (WHC) – No news, general strength across the broader Coal sector today, rise is consistent with prevailing short and long term uptrends, a regular in ChartWatch ASX Scans Uptrends list 🔎📈
+2.7% New Hope Corp. (NHC) – No news, general strength across the broader Coal sector today, rise is consistent with prevailing short and long term uptrends, a recent regular in ChartWatch ASX Scans Uptrends list 🔎📈
Trading lower
-14.3% IVR – No news, general weakness across the broader Silver sector today.
-14.3% Boab Metals (BML) – No news, general weakness across the broader Silver sector today.
-14.0% Graincorp Class A (GNC) – GrainCorp provides FY26 earnings guidance, fall is consistent with prevailing short and long term downtrends, a regular in ChartWatch ASX Scans Downtrends list 🔎📉
-13.2% BetaShares Global Gold Miners Currency Hedged ETF (MNRS) – No news, general weakness across the broader Resources sector today.
-13.0% Polymetals Resources (POL) – No news, general weakness across the broader Silver sector today.
-12.2% Sun Silver (SS1) – No news, general weakness across the broader Silver sector today.
-12.1% Lotus Resources (LOT) – No news, general weakness across the broader Uranium sector today.
-12.0% Silver Mines (SVL) – No news, general weakness across the broader Silver sector today.
-11.6% St Barbara (SBM) – No news, general weakness across the broader Gold sector today.
-11.6% African Gold (A1G) – No news, general weakness across the broader Gold sector today.
-11.5% VanEck Gold Miners ETF (GDX) – No news, general weakness across the broader Gold sector today.
-11.2% Kingsgate Consolidated (KCN) – No news, general weakness across the broader Gold sector today.
-10.0% Newmont Corp. (NEM) – No news, general weakness across the broader Gold sector today.
-9.7% DPM Metals (DPM) – No news, general weakness across the broader Gold sector today.
-9.6% Elevate Uranium (EL8) – No news, general weakness across the broader Uranium sector today.
-9.5% VanEck Gold Bullion ETF (NUGG) – No news, general weakness across the broader Gold sector today.
-9.4% Global X Physical Gold (GOLD) – No news, general weakness across the broader Gold sector today.
-9.3% Emerald Resources (EMR) – No news, general weakness across the broader Gold sector today.
-9.0% Unico Silver (USL) – Investor Presentation, general weakness across the broader Silver sector today.
-9.0% Ora Banda Mining (OBM) – Continued Exploration Success at Round Dam, general weakness across the broader Gold sector today, downgraded to neutral from outperform at Macquarie and price target cut to $1.40 from $1.50.
-8.9% Centaurus Metals (CTM) – No news, general weakness across the broader Gold sector today.
-8.8% Bannerman Energy (BMN) – No news, general weakness across the broader Uranium sector today.
-8.7% Peninsula Energy (PEN) – No news, general weakness across the broader Uranium sector today.
-8.6% BetaShares Crypto Innovators ETF (CRYP) – No news (sharp falls in major cryptocurrencies over the weekend).
-8.5% Boss Energy (BOE) – Ceasing to be a substantial holder (UBS), general weakness across the broader Uranium sector today.
Broker Moves
6K Additive, Inc (6KA)
Retained at speculative buy at Bell Potter; Price Target: $1.45
Aeris Resources (AIS)
Retained at accumulate at Morgans; Price Target: $0.70 from $0.60
Atlas Arteria (ALX)
Retained at outperform at Macquarie; Price Target: $5.55
Retained at equal-weight at Morgan Stanley; Price Target: $5.09
Retained at hold at Morgans; Price Target: $4.58 from $4.74
Retained at neutral at UBS; Price Target: $5.15 from $5.20
BETR Entertainment (BBT)
Retained at buy at Ord Minnett; Price Target: $0.38 from $0.46
Bellevue Gold (BGL)
Retained at buy at UBS; Price Target: $2.25 from $2.05
Brazilian Rare Earths (BRE)
Retained at speculative buy at Ord Minnett; Price Target: $7.50 from $7.00
Bubs Australia (BUB)
Upgraded to speculative buy from hold at Bell Potter; Price Target: $0.18 from $0.17
Retained at accumulate at Ord Minnett; Price Target: $0.18
Chalice Mining (CHN)
Retained at buy at UBS; Price Target: $3.00 from $2.75
Champion Iron (CIA)
Retained at hold at Bell Potter; Price Target: $5.55 from $5.65
Elders (ELD)
Retained at buy at Citi; Price Target: $8.45
Retained at outperform at Macquarie; Price Target: $8.40
Emerald Resources NL (EMR)
Retained at buy at Argonaut Securities; Price Target: $11.00 from $10.70
Retained at buy at Euroz Hartleys; Price Target: $8.40 from $8.15
Retained at buy at SCP Equity Research; Price Target: $10.15
Evolution Mining (EVN)
Retained at sell at UBS; Price Target: $12.90 from $12.20
Genesis Minerals (GMD)
Retained at buy at Bell Potter; Price Target: $9.90 from $8.65
Retained at outperform at Macquarie; Price Target: $8.70 from $8.40
Retained at accumulate at Ord Minnett; Price Target: $8.15 from $8.40
Retained at buy at UBS; Price Target: $10.00 from $8.50
IDP Education (IEL)
Downgraded to underperform from neutral at Bank of America; Price Target: $6.00 from $6.40
Immutep (IMM)
Retained at speculative buy at Bell Potter; Price Target: $0.65 from $0.60
Jupiter Mines . (JMS)
Retained at outperform at Macquarie; Price Target: $0.29
Lotus Resources (LOT)
Retained at speculative buy at Canaccord Genuity; Price Target: $3.60 from $3.57
Retained at speculative buy at Ord Minnett; Price Target: $4.20
Mach7 Technologies (M7T)
Retained at buy at Morgans; Price Target: $0.76
Meeka Metals (MEK)
Retained at buy at Morgans; Price Target: $0.33
Micro-X (MX1)
Retained at speculative buy at Morgans; Price Target: $0.16
Nine Entertainment Co. Holdings (NEC)
Upgraded to positive from neutral at E&P; Price Target: $1.30 from $1.25
Retained at neutral at JPMorgan; Price Target: $1.25 from $1.20
Retained at neutral at UBS; Price Target: $1.22 from $1.24
Noumi (NOU)
Retained at buy at Bell Potter; Price Target: $0.18 from $0.19
Northern Minerals (NTU)
Retained at speculative buy at Ord Minnett; Price Target: $0.05 from $0.05
Neurizon Therapeutics (NUZ)
Retained at speculative buy at Morgans; Price Target: $0.28 from $0.39
Ora Banda Mining (OBM)
Downgraded to neutral from outperform at Macquarie; Price Target: $1.40 from $1.50
Orora (ORA)
Downgraded to underweight from overweight at JPMorgan; Price Target: $1.90 from $2.40
Origin Energy (ORG)
Retained at buy at Citi; Price Target: $13.00
Retained at neutral at Jarden; Price Target: $11.65 from $11.60
Retained at buy at Jefferies; Price Target: $12.87 from $13.23
Retained at neutral at JPMorgan; Price Target: $12.50 from $12.70
Retained at neutral at Macquarie; Price Target: $11.25
Retained at hold at Ord Minnett; Price Target: $11.00 from $10.80
Peninsula Energy (PEN)
Retained at speculative buy at Canaccord Genuity; Price Target: $1.29
PLS Group (PLS)
Retained at hold at Bell Potter; Price Target: $4.60 from $4.55
Retained at neutral at Citi; Price Target: $5.25
Upgraded to outperform from hold at CLSA; Price Target: $5.35 from $4.15
Retained at sell at Goldman Sachs; Price Target: $3.00
Retained at neutral at Jarden; Price Target: $2.50 from $2.40
Retained at neutral at Macquarie; Price Target: $4.50
Retained at overweight at Morgan Stanley; Price Target: $5.25
Perseus Mining (PRU)
Retained at neutral at Citi; Price Target: $6.30 from $5.70
QPM Energy (QPM)
Retained at speculative buy at Ord Minnett; Price Target: $0.10
Qube Holdings (QUB)
Retained at hold at Ord Minnett; Price Target: $5.20
ResMed Inc. (RMD)
Retained at buy at Citi; Price Target: $50.00 from $51.00
Retained at outperform at Macquarie; Price Target: $47.50 from $49.20
Upgraded to buy from accumulate at Morgans; Price Target: $47.73 from $47.04
Retained at buy at Ord Minnett; Price Target: $43.70 from $44.56
Ramelius Resources (RMS)
Retained at buy at Ord Minnett; Price Target: $5.10
RMA Global (RMY)
Retained at speculative buy at Bell Potter; Price Target: $0.10
Regis Resources (RRL)
Retained at buy at UBS; Price Target: $9.50 from $8.55
South32 (S32)
Retained at buy at UBS; Price Target: $5.30
Strickland Metals (STK)
Retained at speculative buy at Canaccord Genuity; Price Target: $0.65
Vault Minerals (VAU)
Retained at buy at UBS; Price Target: $7.75 from $7.25
Viridis Mining and Minerals (VMM)
Retained at speculative buy at Ord Minnett; Price Target: $4.70 from $3.50
Ventia Services Group (VNT)
Downgraded to sector perform from outperform at RBC Capital Markets; Price Target: $6.00
wrkr (WRK)
Retained at buy at Bell Potter; Price Target: $0.18 from $0.16
Scans
Top Gainers
Code | Company | Last | % Chg |
|---|---|---|---|
| RBR | RBR Group Ltd | $0.026 | +36.84% |
| ALM | Alma Metals Ltd | $0.015 | +36.36% |
| EDE | Eden Innovations Ltd | $0.145 | +26.09% |
| LMS | Litchfield Minerals Ltd | $0.695 | +23.01% |
| CR9 | Corella Resources Ltd | $0.011 | +22.22% |
Top Fallers
Code | Company | Last | % Chg |
|---|---|---|---|
| M24 | Mamba Exploration Ltd | $0.028 | -30.00% |
| ETPMAG | Global X Metal Securities Australia Ltd | $103.84 | -28.93% |
| BUR | Burley Minerals Ltd | $0.028 | -24.32% |
| CTO | Citigold Corporation Ltd | $0.013 | -23.53% |
| TXR | Talonx Resources Ltd | $0.017 | -22.73% |
52 Week Highs
Code | Company | Last | % Chg |
|---|---|---|---|
| ALM | Alma Metals Ltd | $0.015 | +36.36% |
| EDE | Eden Innovations Ltd | $0.145 | +26.09% |
| CR9 | Corella Resources Ltd | $0.011 | +22.22% |
| PC2 | PC Gold Ltd | $0.675 | +16.38% |
| BPG | Black Pearl Group Ltd | $1.12 | +14.87% |
52 Week Lows
Code | Company | Last | % Chg |
|---|---|---|---|
| BUR | Burley Minerals Ltd | $0.028 | -24.32% |
| MCA | Murray Cod Australia Ltd | $0.61 | -19.74% |
| FND | Findi Ltd | $0.905 | -15.42% |
| SLVM | Global X Silver Miners ETF | $41.08 | -15.32% |
| GNC | Graincorp Ltd | $6.19 | -14.03% |
Near Highs
Code | Company | Last | % Chg |
|---|---|---|---|
| IAGPF | Insurance Australia Group Ltd | $105.74 | +0.17% |
| GCI | Gryphon Capital Income Trust | $2.07 | +0.49% |
| VVLU | Vanguard Global Value Equity Active ETF | $79.95 | +0.19% |
| IHD | iShares S&P/ASX DIV Opportunities Esg Screened ETF | $16.57 | -0.42% |
| MGX | MGX Resources Ltd | $0.475 | -3.06% |
Relative Strength Index (RSI) Oversold
Code | Company | Last | % Chg |
|---|---|---|---|
| DGGF | Betashares Ethical Diversified Growth ETF | $27.70 | -0.14% |
| XYZ | Block, Inc | $85.10 | -2.90% |
| FANG | Global X Fang+ ETF | $31.78 | -0.97% |
| ETHI | Betashares Global Sustainability Leaders ETF | $15.59 | 0.00% |
| RAC | Racura Oncology Ltd | $2.21 | -0.90% |
