
Do gold and silver bounce back after crashes? Here's what the data shows
Friday's $7 trillion crash was historic. We analysed past selloffs to reveal how gold and silver typically recover.

.jpg)
Source: Shutterstock
Mentioned
KEY POINTS
- Gold has only dropped 5% or more on 16 occasions since 1990, with historical data showing a mixed track record of recovery over the short to medium term
- Silver's post-2000 selloffs demonstrate strong bounce-back potential across all timeframes, while pre-2000 crashes consistently produced negative medium-term returns
- Current conditions are unprecedented due to gold's 29% and silver's 68% year-to-date rallies, record ETF demand up 140%, and RSI reaching 86, the most overbought level since the 1990s
Friday's precious metals crash was historic by any measure. Gold plunged over 12% to fall below US$5,000 an ounce in its steepest decline since the early 1980s, while silver collapsed as much as 36% in the largest intraday drop on record.
More than US$7 trillion evaporated from precious metals markets as a perfect storm converged. Gold had surged 29% year to date and silver had rocketed 68%, leaving both metals severely overbought. Five CME margin hikes within nine days progressively squeezed leveraged longs. When hawkish Kevin Warsh's probability of becoming Fed Chair spiked from 31.5% to over 99% on Friday, it triggered a chain reaction of forced liquidations.
The violence of the selloff has left investors questioning what comes next. While every market cycle is different, history offers some guidance on how gold and silver typically perform after major crashes.
We gathered previous instances where gold and silver suffered major one-day declines to understand the recovery patterns over the short-to-medium term.
Gold after selloffs
Since 1990, gold has dropped by 5% or more on just 16 occasions.
The 1990s selloffs were largely catalyst driven, sparked by fears of large-scale liquidation from major Saudi, Japanese and Soviet holders, and the aftermath of Iraq's invasion of Kuwait
The 2013 declines occurred during a broader 25% fall from January to June that year. This followed a major bull market where prices ran from US$250 to US$1,875 between 2001 and 2011. Key catalysts included heavy selling on Comex futures and Cyprus liquidating gold reserves amid its EU/IMF bailout
The August 2020 selloff came immediately after gold rallied around 20% from US$1,685 to US$2,035 in one month, fuelled by massive Fed quantitative easing and ultra-low rates
The October 2025 tumble followed a roughly 27% surge over four weeks to a record US$4,250
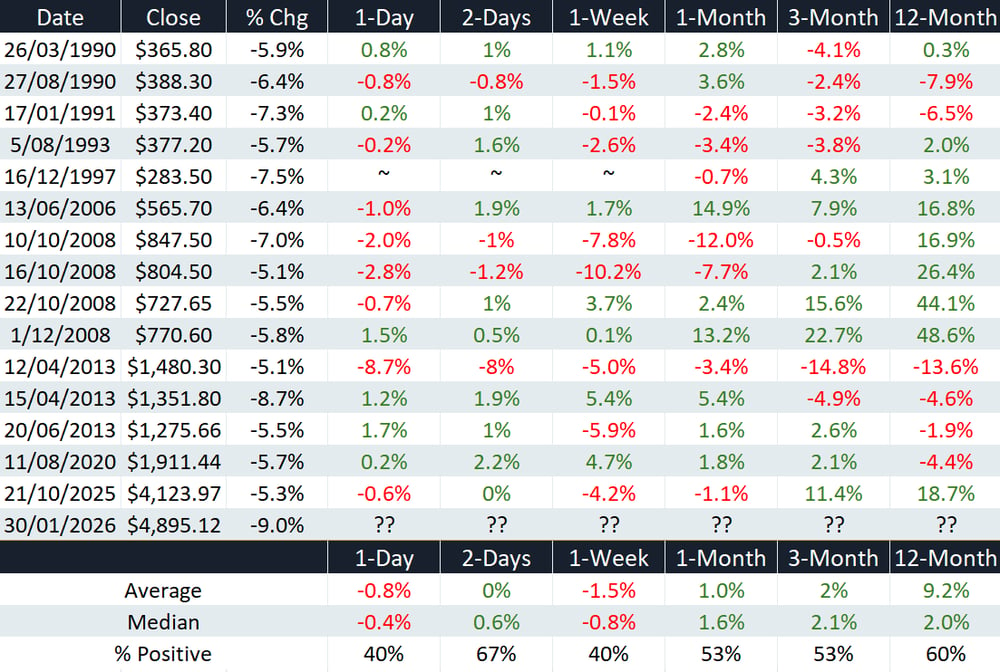
Gold (US$/oz) price performance after selloffs of 5% or more | Source: Author's own calculations (~ indicates gaps in the data source)
Silver after tumbles
Given silver's higher volatility, we tracked selloffs of 10% or more dating back to the 1980s. Modern selloffs appear to bounce back strongly across all timeframes.
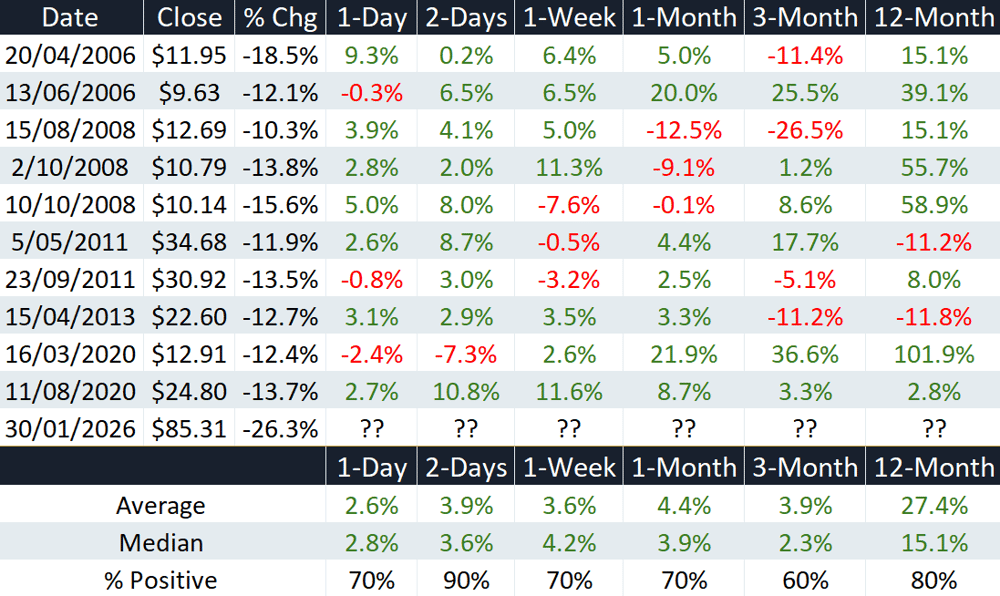
Silver (US$/oz) price performance after selloffs of 10% or more | Source: Author's own calculations
Pre-2000 selloffs, however, consistently produced negative returns over the medium term.
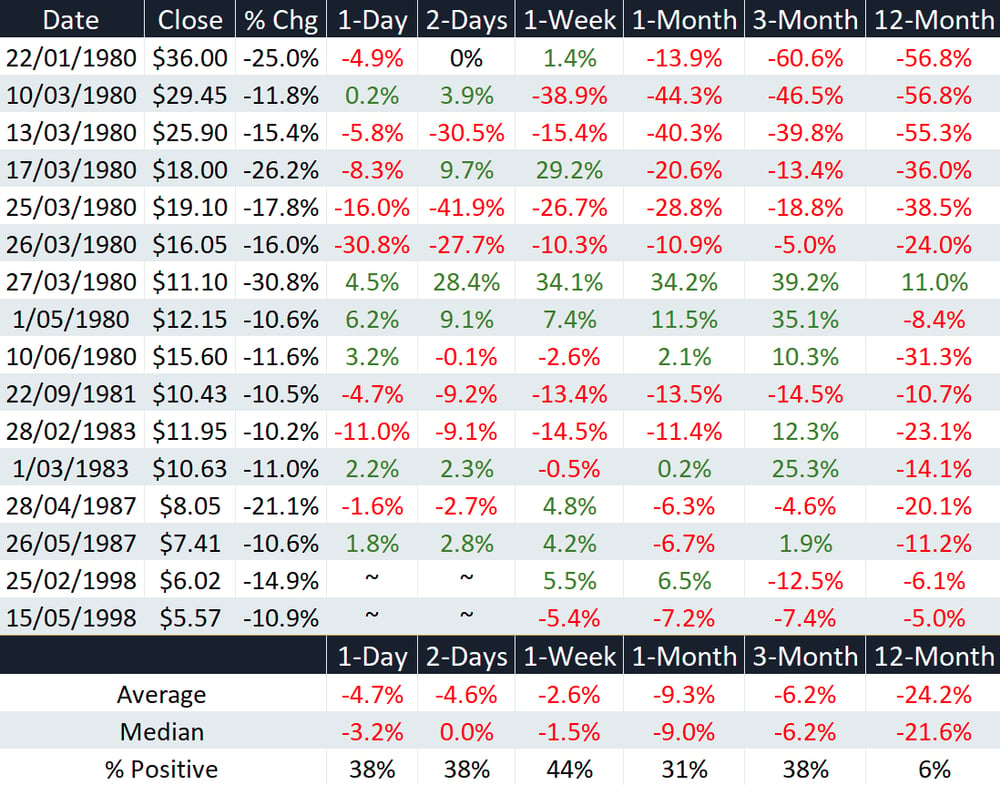
Silver (US$/oz) price performance after selloffs of 10% or more | Source: Author's own calculations
The bottom line
The current environment is truly unprecedented. The ferocity of the rally over the past 12 to 24 months, combined with exceptional buying volumes, creates conditions unlike previous crashes. The World Gold Council noted US gold demand rose 140% year on year in 2025, the highest level since 2020 and driven almost entirely by ETF investments. Gold's RSI hit 86 before the crash, a level of technical overbought conditions not seen since the 1980s.
Historical patterns suggest recoveries are possible, but the scale of the preceding rally and the extreme positioning make simple comparisons difficult. The question is not just whether gold and silver will recover, but whether the structural factors that drove the rally remain intact. With CME margins at elevated levels, speculative froth cleared out, and uncertainty around Fed policy under Warsh, the path forward depends heavily on whether the fundamental drivers that pushed metals to records can reassert themselves against a backdrop of reduced leverage and tighter financial conditions.
