News | Market Wraps
Evening Wrap: ASX 200 slides dangerously towards a bear market as resources, banks and consumer stocks hit
The S&P/ASX 200 closed 69.4 points lower, down 0.82%.

Mentioned
The S&P/ASX 200 closed 69.4 points lower, down 0.82%.
The ASX 200 fell for a third straight week as the war in the Middle East kept energy costs elevated and forced markets to price in a more aggressive interest rate path.
Even with oil pulling back from recent peaks (tipped US$119/bbl overnight vs current US$107/bbl), investors remained focused on the risk that prolonged supply disruption will keep inflation higher for longer and weigh on global growth.
In stock specific news:
Premier Investments (PMV) (-4.3%) — fell after a mixed first-half result, with Peter Alexander strength offset by a double-digit sales decline at Smiggle.
Virgin Australia (VGN) (-5.0%) — dropped after signalling airfare increases of about 5% to offset rising costs including a tighter aviation fuel market.
Humm Group (HUM) (-1.4%) — slipped after former chairman Andrew Abercrombie sought a Takeovers Panel review of its earlier unacceptable circumstances ruling.
Flight Centre Travel Group (FLT) (-0.3%) — eased after acquiring UK-based meetings and events agency Fresh Approach as it expands deeper into corporate services.
Electro Optic Systems (EOS) (+2.6%) — rebounded after confirming its chief executive had completed a 1.5 million-share selldown and that no further sales are planned.
les Group (COL) (+0.8%) — edged higher after saying it will review fuel levies fortnightly rather than monthly in response to oil price volatility.
Be sure to click/scroll through for the usual reporting of the major sector and stock-specific moves, the broker responses to them, as well as all the key economic data in tonight's Evening Wrap.
Also, I have detailed technical analysis on the Nasdaq Composite and the S&P/ASX 200 in today's ChartWatch.
Let's dive in!
Today in Review
Fri 20 Mar 26, 5:08pm (AEST)
Name | Value | % Chg |
|---|---|---|
Major Indices | ||
| ASX 200 | 8,428.4 | -0.82% |
| All Ords | 8,628.3 | -0.72% |
| Small Ords | 3,289.7 | -0.85% |
| All Tech | 2,602.9 | -0.16% |
| Emerging Companies | 2,879.0 | +0.24% |
Currency | ||
| AUD/USD | 0.7088 | +0.02% |
US Futures | ||
| S&P 500 | 6,668.75 | +0.13% |
| Dow Jones | 46,440.0 | +0.21% |
| Nasdaq | 24,598.75 | +0.08% |
Name | Value | % Chg |
|---|---|---|
Sector | ||
| Health Care | 27,530.5 | +1.20% |
| Utilities | 10,049.2 | +0.72% |
| Energy | 11,146.6 | +0.71% |
| Communication Services | 1,688.7 | +0.24% |
| Information Technology | 1,639.3 | -0.08% |
| Consumer Staples | 12,498.8 | -0.25% |
| Real Estate | 3,296.0 | -0.69% |
| Consumer Discretionary | 3,345.0 | -0.84% |
| Industrials | 7,805.4 | -1.02% |
| Financials | 9,548.6 | -1.09% |
| Materials | 20,520.2 | -1.61% |
Markets
%20intraday%20chart_20%20Mar.png)
ASX 200 Session Chart
The S&P/ASX 200 (XJO) finished 69.4 points lower at 8,428.4, 0.8% from its session high and smack–bang at its low of the day. In the broader-based S&P/ASX 300 (XKO) advancers lagged decliners by a disappointing 100 to 181. Ugly...
For the week, the XJO finished down 189 points or 2.2% lower, 2.7% from its intraweek high and also smack-bang at its intraweek low. Uglier still…
Health Care (XHJ) (+1.2%) was the best sector today, but mainly because of one stock — its biggest in CSL (CSL) (+2.9%). Outside of CSL and Telix Pharmaceuticals (TLX) (+2.7%), the sector endured a similar fate to the rest of the market, as Sonic Healthcare (SHL) (-2.4%) and Pro Medicus (PME) (-2.1%) lost ground.
Utilities (XUJ) (+0.7%) held up as another defensive pocket of the market. Whatever the state of the world, people still need power, with Origin Energy (ORG) (+2.1%) a notable winner.
Energy (XEJ) (+0.7%) remains one of the only clear winners from the mess in the Middle East, even with oil pulling back from its recent highs. Whitehaven Coal (WHC) (+3.9%) led the gains, while Woodside Energy Group (WDS) (+1.0%) also pushed higher.
Gold Sub-Index (XGD) (-1.5%) stayed under pressure as one of the superstar sectors of 2025 and early 2026 continued to unravel. Newmont Corp. (NEM) (-2.6%) and Northern Star Resources (NST) (-2.4%) were among the notable losers.
Resources (XJR) (-1.1%) also weighed on the benchmark as the broader retreat in mining stocks continued. Rio Tinto (RIO) (-2.9%) and Lynas Rare Earths (LYC) (-2.2%) were key drags.
Financials (XFJ) (-1.1%) pulled back as last week’s rate-hike boost faded and investors shifted focus to the risk of a sharper economic slowdown. National Australia Bank (NAB) (-2.3%) and ANZ Group (ANZ) (-1.1%) both weakened.
Consumer Discretionary (XDJ) (-0.8%) was also hit as fears of slower growth and pressure on household budgets weighed on spending-linked names. JB HI-FI (JBH) (-4.1%) led the declines.
In commodities, gold rebounded in Asian trade, rising 1.9% to US$4694/oz, while silver climbed 2.6% to $73.05/oz after both suffered savage falls overnight. Copper also recovered 0.7% to $5.51/lb, but the bounce in precious and base metals did little to stop the heavy selling in gold and resources stocks.
Iron ore rose 1.1% in Singapore trade to US$108.30/t, trading near 10-month highs. That support helped Mineral Resources (MIN) (+0.5%) limit the damage despite the broader weakness across the resources complex.
Lithium also bounced in China trade, with GFEX lithium carbonate futures rising 1.7% to 147,780 CNY/t. The rebound supported PLS Group (PLS) (+2.4%) and Elevra Lithium (ELV) (+5.4%).
Today's best blue chip gainers
Company | Last Price | Change $ | Change % | 1mo % | 1yr % |
|---|---|---|---|---|---|
Sigma Healthcare (SIG) | $2.78 | +$0.12 | +4.5% | -6.7% | -4.5% |
Bluescope Steel (BSL) | $27.30 | +$1.13 | +4.3% | -5.7% | +22.9% |
Technology One (TNE) | $26.78 | +$1.02 | +4.0% | +8.5% | -5.7% |
Whitehaven Coal (WHC) | $9.30 | +$0.35 | +3.9% | +15.8% | +58.2% |
Wisetech Global (WTC) | $42.84 | +$1.37 | +3.3% | -12.5% | -49.5% |
CSL (CSL) | $138.50 | +$3.88 | +2.9% | -10.2% | -45.8% |
Telix Pharmaceuticals (TLX) | $12.75 | +$0.34 | +2.7% | +39.7% | -54.1% |
Seek (SEK) | $14.44 | +$0.36 | +2.6% | -12.2% | -37.0% |
PLS Group (PLS) | $4.23 | +$0.1 | +2.4% | -3.4% | +116.9% |
Genesis Minerals (GMD) | $5.63 | +$0.12 | +2.2% | -20.6% | +56.4% |
Origin Energy (ORG) | $12.01 | +$0.25 | +2.1% | -1.1% | +13.2% |
Evolution Mining (EVN) | $12.41 | +$0.2 | +1.6% | -16.9% | +80.4% |
Worley (WOR) | $10.63 | +$0.16 | +1.5% | -20.3% | -28.7% |
Block (XYZ) | $82.86 | +$1.02 | +1.2% | +9.0% | -15.5% |
Aristocrat Leisure (ALL) | $45.27 | +$0.54 | +1.2% | -10.1% | -30.4% |
Perseus Mining (PRU) | $4.81 | +$0.05 | +1.1% | -15.0% | +50.8% |
Woodside Energy (WDS) | $34.04 | +$0.34 | +1.0% | +25.6% | +48.4% |
Insurance Australia (IAG) | $7.26 | +$0.07 | +1.0% | +4.3% | -5.1% |
AMP (AMP) | $1.230 | +$0.01 | +0.8% | -10.2% | -1.6% |
Coles Group (COL) | $21.59 | +$0.16 | +0.7% | -1.3% | +16.3% |
Today's worst blue chip losers
Company | Last Price | Change $ | Change % | 1mo % | 1yr % |
|---|---|---|---|---|---|
Life360 (360) | $18.08 | -$0.89 | -4.7% | -25.4% | -16.1% |
JB HI-FI (JBH) | $71.70 | -$3.08 | -4.1% | -16.5% | -21.0% |
Nextdc (NXT) | $12.86 | -$0.52 | -3.9% | -8.2% | -2.7% |
Amcor PLC (AMC) | $54.13 | -$2.18 | -3.9% | -23.6% | -29.9% |
Ramelius Resources (RMS) | $3.49 | -$0.12 | -3.3% | -22.6% | +60.1% |
James Hardie (JHX) | $27.43 | -$0.94 | -3.3% | -22.9% | -40.9% |
Rio Tinto (RIO) | $146.92 | -$4.43 | -2.9% | -12.8% | +25.0% |
IGO (IGO) | $6.81 | -$0.2 | -2.9% | -13.8% | +57.3% |
ALS (ALQ) | $19.86 | -$0.58 | -2.8% | -19.4% | +31.7% |
Medibank Private (MPL) | $4.21 | -$0.12 | -2.8% | -6.9% | -3.9% |
Dyno Nobel (DNL) | $2.99 | -$0.08 | -2.6% | -9.7% | +9.1% |
Newmont Corp. (NEM) | $142.46 | -$3.79 | -2.6% | -19.2% | +88.3% |
Charter Hall Group (CHC) | $18.86 | -$0.49 | -2.5% | -16.1% | +12.4% |
SGH (SGH) | $39.51 | -$0.99 | -2.4% | -17.4% | -20.3% |
F&P Healthcare (FPH) | $30.00 | -$0.75 | -2.4% | -5.6% | +0.5% |
Northern Star (NST) | $18.50 | -$0.46 | -2.4% | -34.8% | +1.0% |
Treasury Wine (TWE) | $3.64 | -$0.09 | -2.4% | -22.9% | -63.9% |
Sonic Healthcare (SHL) | $20.07 | -$0.49 | -2.4% | -14.0% | -22.2% |
Hub24 (HUB) | $79.26 | -$1.91 | -2.4% | -19.5% | +10.0% |
ChartWatch
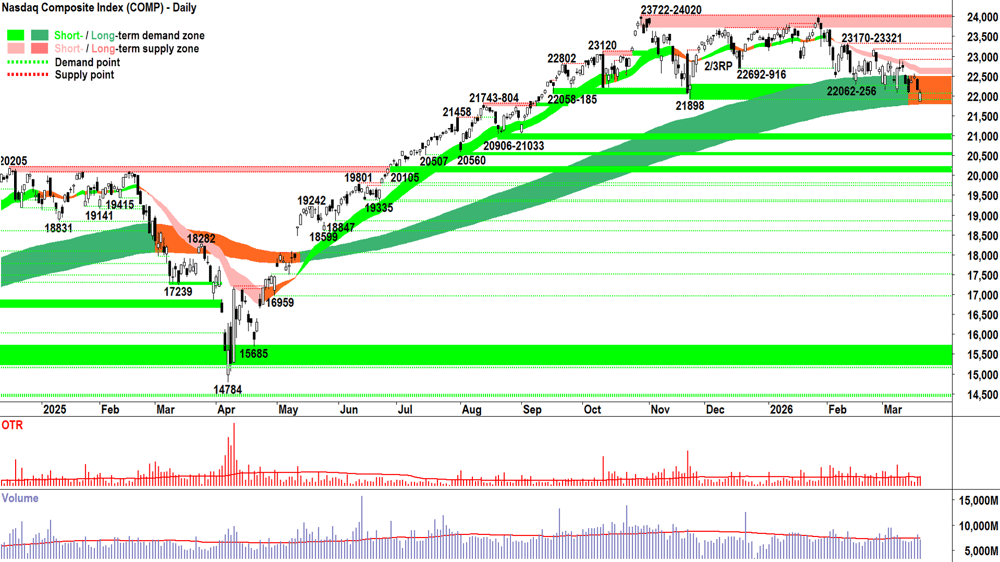
Nasdaq Composite Index
Analysis
Hanging on.
By.
It’s.
Fingernails!
Ace Ventura When Nature Calls: Cliffhanger Scene — How long can the Comp hang on?
The Comp dodged the MOTN bullet on Thursday!
It began the session by probing deep into the long term trend ribbon, nearly breaching it — and then somehow — it found sufficient demand (combined with a supply-side vacuum) to close near its session highs.
Anything can happen in the present market!
Thursday’s session low of 21851 tickled the critical 21898 point of demand — if anything, confirming its / the long term trend ribbons credibility as an area where the dip is still considered worthy to be bought.
The big question is this: At what point do the buy the dippers say “Nope, no price around here looks like a bargain anymore… perhaps at 20906-21033 I’ll have a go, or perhaps at the old all time high at 20205 I’ll re-engage…”
Last night’s candle isn’t all that surprising — because demand in the long term trend ribbon isn’t surprising. Many likely still believe it’s a bull market.
What is surprising about Thursday’s candle, is the lack of supply-side involvement. A full-enough white-bodied candle on below average volume — there just wasn’t much supply around.
When and where will the supply-side re-engage? 🤔
Well, we have a new lower peak set at the 17-Mar high of 22569 — that’s a logical point. Also consider the short term downtrend ribbon (presently 22558-22710), which has done an impeccable job at capping the last 5 rallies straight. It’s shaping up as quite a formidably little “caterpillar” itself! 🐛
The only problem I have with the above chart, is that it looks too obvious to go down! 📉
There’s bound to be a bunch of fundies who are short… sweating on the break… There’s also likely a decent swathe that are underweight… assuming they’ll be able to recoup that weighting at much lower prices.
So, if there isn’t a break… if something happens in the fundamentals to trigger some risk- on back into stocks (e.g. 🌮) — then that short/underweight latent demand could do quite a bit of up-side damage in an environment where there’s little prevailing supply-side engagement.
Much of the unknowns are known. Sure, they’re bad, but they’re known. I get the feeling that something else bad must occur to spark the next wave of selling — which ultimately leads to the decisive break of the long term trend ribbon. (And those shorts and underweight fundies getting what they so dearly want!)
Indeed, these certainly are interesting times we live in!
The upshot of all the excitement though, is risk. How much risk should one apply based on the prevailing short and long term trends, price action, candles, and volume dynamics? 🤷
And, as each day this mess rolls on, I am delighted to say: A big fat who cares! At 1/2RP, I reckon I’m perfectly placed!
View
1/2RP still feels valid with respect to my US portfolio risk limit (RP = Risk Position — it reflects my personal allowable capital allocation limit for my investments in US stocks. So 1/2RP is 50%, 2/3RP is 67% and FRP is 100% 🪣).
Key levels
21851-21898 is the critical zone of demand — a close below it implies the long term uptrend is likely under significant pressure (over!?) = ⚠️. The short term downtrend ribbon (presently 22558-22710) is the nearest critical zone of point supply, and 22569-22907-23170-23321 aren't far beyond that.
S&P/ASX 200 (XJO)
%20chart_20%20Mar.png)
Analysis
Few surprises here today, too — which is great, because when it comes to your investing — who wants surprises!?
Nope, when it comes to our portfolios, boring is often beautiful. At least it is now!
So, that boring little black candle, with its close right on the session's low, tickling into the 8383-8457 "point-of-no-return-last-zone-of-demand" is somewhat moot. It's a clear supply-side showing as much as it's a signal the demand-side wants little part in proceedings.
But, if anything, the ASX 200 (aka, the Old Tin Pot) probably fared better than the technicals — and most of us — might have expected today.
This is because the technicals here are a trainwreck... 💥🚂
There's no sugar coating it: it would take something very special to occur to repair the damage inflicted by the Middle East conflict. It's not impossible — nothing is — and the future is unknown...
Anything can happen, sure, but then there's the stark and cold reality of the MOTN (More Often Than Not) of the current situation. Today's supply-side candle, as modest as it is — simply increases the MOTN = 📉 outcome.
That's the Analysis. I suggest we're all well past Accepting the analysis points to MOTN = 📉. How you Act on it, is up to you — but you know where I'm at 👇
View
1/3RP = My OTP Risk Bucket Limit 🪣 (i.e., my personal allowable capital allocation limit for my investments in Australian stocks is 33%).
Key levels
8383-8457 is the closest zone of demand (static). Beyond it — the bear market awaits...⚠️🚨 The ASX 200 must at least close back above the short- and long term uptrend ribbons (presently 8743-8793. and 8669-8763 respectively) to reclaim any semblance of demand-side control.
ChartWatch *LIVE* Webinar
ChartWatch *LIVE* Webinars – WEEKLY Wednesday's @ 12pm AEDT
Learn more about technical analysis and trend following through real case studies on ASX stocks. Australia's premier technical analyst, Carl Capolingua, shares his unique insights on stocks as requested by viewers. Ask about a company in your portfolio or anything related to trading and investing and get Carl's expert opinion.
Places are limited so >REGISTER NOW!<
Economy
Today
12:00 CHN Peoples Bank of China (PBOC) Long Prime Rate
1-year Loan Prime Rate: No change at 3.0% as per forecast
5-year Loan Prime Rate: No change at 3.5% as per forecast
Latest News
Interesting Movers
Trading higher
+10.5% Tasmea (TEA) – No news 🤔.
+9.4% EQ Resources (EQR) – No news, bounced in the wake of the recent sharp selloff.
+8.4% Catalyst Metals (CYL) – No news, bounced in the wake of the recent sharp selloff.
+7.6% Cobram Estate Olives (CBO) – No news, bounced in the wake of the recent sharp selloff.
+7.3% Turaco Gold (TCG) – No news, bounced in the wake of the recent sharp selloff.
+7.1% Santana Minerals (SMI) – Results of the Share Purchase Plan, bounced in the wake of the recent sharp selloff.
+6.8% Alpha HPA (A4N) – No news, bounced in the wake of the recent sharp selloff.
+6.6% Alkane Resources (ALK) – No news, bounced in the wake of the recent sharp selloff.
+6.2% Aeris Resources (AIS) – No news, bounced in the wake of the recent sharp selloff.
+5.9% Stanmore Resources (SMR) – No news, general strength across the broader Energy sector today.
+5.7% Arafura Rare Earths (ARU) – No news, rise is consistent with prevailing short and long term uptrends, a recent regular in ChartWatch ASX Scans Uptrends list 🔎📈
+5.4% Elevra Lithium (ELV) – Results of Small Shareholding Sale Facility.
+4.4% 4DMedical (4DX) – No news, rise is consistent with prevailing short and long term uptrends, a regular in ChartWatch ASX Scans Uptrends list 🔎📈
+3.9% Whitehaven Coal (WHC) – Sale of shares by Managing Director and CEO, general strength across the broader Energy sector today, rise is consistent with prevailing short and long term uptrends, a regular in ChartWatch ASX Scans Uptrends list 🔎📈
+3.9% Elsight (ELS) – No news, rise is consistent with prevailing short and long term uptrends, a regular in ChartWatch ASX Scans Uptrends list 🔎📈
Trading lower
-11.9% Accent Group (AX1) – No news, general weakness across the broader Consumer Discretionary sector today, fall is consistent with prevailing short and long term downtrends, one of the most Featured (highest conviction) stocks in ChartWatch ASX Scans Downtrends list 🔎📉
-10.9% Adairs (ADH) – No news, general weakness across the broader Consumer Discretionary sector today, fall is consistent with prevailing short and long term downtrends, a regular in ChartWatch ASX Scans Downtrends list 🔎📉
-10.2% G8 Education (GEM) – No news, general weakness across the broader Consumer Discretionary sector today, fall is consistent with prevailing short and long term downtrends, one of the most Featured (highest conviction) stocks in ChartWatch ASX Scans Downtrends list 🔎📉
-9.6% Ausgold (AUC) – No news, general weakness across the broader Precious Metals sector today.
-9.5% Kingsgate Consolidated (KCN) – No news, general weakness across the broader Precious Metals sector today.
-8.9% Benz Mining Corp. (BNZ) – No news, general weakness across the broader Precious Metals sector today.
-7.8% Ora Banda Mining (OBM) – No news, general weakness across the broader Precious Metals sector today.
-7.3% Audinate Group (AD8) – No news, general weakness across the broader Information Technology sector today, fall is consistent with prevailing short and long term downtrends, a regular in ChartWatch ASX Scans Downtrends list 🔎📉
-7.2% Greatland Resources (GGP) – No news, general weakness across the broader Precious Metals sector today, fall is consistent with prevailing short term downtrend and falling peaks and falling troughs, a recent regular in ChartWatch ASX Scans Downtrends list 🔎📉
-7.2% Alcoa Corp. (AAI) – Annual Report to Shareholders, plus aluminium price down 5.9% overnight.
-6.6% Nuix (NXL) – No news, general weakness across the broader Information Technology sector today, fall is consistent with prevailing short and long term downtrends, a regular in ChartWatch ASX Scans Downtrends list 🔎📉
-6.6% Myer (MYR) – No news, general weakness across the broader Consumer Discretionary sector today, fall is consistent with prevailing short and long term downtrends, a regular in ChartWatch ASX Scans Downtrends list 🔎📉
-6.1% Vault Minerals (VAU) – No news, general weakness across the broader Precious Metals sector today, fall is consistent with prevailing short term downtrend and long term trend is transitioning from up to down, added to ChartWatch ASX Scans Downtrends list yesterday 🔎📉
-5.7% Reliance Worldwide Corp. (RWC) – No news, general weakness across the broader Consumer Discretionary sector today, fall is consistent with prevailing short and long term downtrends, a regular in ChartWatch ASX Scans Downtrends list 🔎📉
-5.1% Digico Infrastructure Reit (DGT) – No news, general weakness across the broader Information Technology sector today, fall is consistent with prevailing short and long term downtrends, a regular in ChartWatch ASX Scans Downtrends list 🔎📉
-5.0% Virgin Australia (VGN) – No news, general weakness across the broader Consumer Discretionary sector today, fall is consistent with prevailing short and long term downtrends, a regular in ChartWatch ASX Scans Downtrends list 🔎📉
-4.7% Life360 (360) – No news, general weakness across the broader Information Technology sector today, fall is consistent with prevailing short and long term downtrends, a regular in ChartWatch ASX Scans Downtrends list 🔎📉
-4.5% Guzman Y Gomez (GYG) – No news, general weakness across the broader Consumer Discretionary sector today, fall is consistent with prevailing short and long term downtrends, a regular in ChartWatch ASX Scans Downtrends list 🔎📉
Broker Moves
Alkane Resources (ALK)
Retained at buy at Ord Minnett; Price Target: $2.10
ALS (ALQ)
Retained at outperform at Macquarie; Price Target: $23.50 from $22.85
Cuscal (CCL)
Retained at buy at Ord Minnett; Price Target: $5.13
Core Lithium (CXO)
Retained at overweight at Barrenjoey; Price Target: $0.30 from $0.35
DroneShield (DRO)
Initiated at hold at Jefferies; Price Target: $3.70
EBR Systems Inc (EBR)
Retained at buy at Bell Potter; Price Target: $2.00 from $2.43
Evolution Mining (EVN)
Upgraded to accumulate from hold at Ord Minnett; Price Target: $13.10
Genesis Minerals (GMD)
Upgraded to buy from accumulate at Ord Minnett; Price Target: $8.15
Infotrust (ITS)
Retained at buy at Bell Potter; Price Target: $0.62 from $0.60
Lynas Rare Earths (LYC)
Retained at sell at Ord Minnett; Price Target: $14.00
Northern Star Resources (NST)
Retained at accumulate at Ord Minnett; Price Target: $23.70 from $29.70
Propel Funeral Partners (PFP)
Retained at buy at Bell Potter; Price Target: $5.00 from $5.90
Premier Investments (PMV)
Retained at buy at UBS; Price Target: $18.00
REA Group (REA)
Retained at buy at Citi; Price Target: $199.00
Ricegrowers (SGLLV)
Retained at buy at Bell Potter; Price Target: $17.00 from $18.75
Sonic Healthcare (SHL)
Upgraded to neutral from sell at Citi; Price Target: $21.50 from $22.00
Sigma Healthcare (SIG)
Upgraded to buy from hold at Jefferies; Price Target: $3.05
Strike Energy (STX)
Retained at speculative buy at Bell Potter; Price Target: $0.15
Treasury Wine Estates (TWE)
Upgraded to hold from lighten at Ord Minnett; Price Target: $4.50
Vault Minerals (VAU)
Retained at buy at Ord Minnett; Price Target: $7.40
Viva Energy Group (VEA)
Retained at buy at UBS; Price Target: $2.70 from $2.40
Westpac Banking Corporation (WBC)
Retained at underweight at Morgan Stanley; Price Target: $35.70
Westgold Resources (WGX)
Retained at buy at Ord Minnett; Price Target: $8.75
Scans
Top Gainers
Code | Company | Last | % Chg |
|---|---|---|---|
| LMG | Latrobe Magnesium Ltd | $0.018 | +20.00% |
| C1X | Cosmos Exploration Ltd | $0.245 | +19.51% |
| NSB | Neuroscientific Biopharmaceuticals Ltd | $0.093 | +19.23% |
| OM1 | Omnia Metals Group Ltd | $0.025 | +19.05% |
| RVT | Richmond Vanadium Technology Ltd | $0.165 | +17.86% |
Top Fallers
Code | Company | Last | % Chg |
|---|---|---|---|
| MNC | Merino & Co. Ltd | $0.085 | -29.17% |
| AFA | Asf Group Ltd | $0.052 | -17.46% |
| DWG | Dataworks Group Ltd | $0.13 | -16.13% |
| ATT | Altitude Minerals Ltd | $0.016 | -15.79% |
| ATS | Australis Oil & Gas Ltd | $0.022 | -15.39% |
52 Week Highs
Code | Company | Last | % Chg |
|---|---|---|---|
| AKN | Auking Mining Ltd | $0.014 | +16.67% |
| NGY | Nuenergy Gas Ltd | $0.047 | +9.30% |
| CUP | Count Ltd | $1.20 | +6.20% |
| PL3 | Patagonia Lithium Ltd | $0.195 | +5.41% |
| ECH | Echelon Resources Ltd | $0.43 | +3.61% |
52 Week Lows
Code | Company | Last | % Chg |
|---|---|---|---|
| MNC | Merino & Co. Ltd | $0.085 | -29.17% |
| IRD | Iron Road Ltd | $0.02 | -13.04% |
| MC2 | Marimaca Copper Corp | $8.11 | -12.89% |
| AX1 | Accent Group Ltd | $0.775 | -11.93% |
| ADH | Adairs Ltd | $1.265 | -10.92% |
Near Highs
Code | Company | Last | % Chg |
|---|---|---|---|
| PL3 | Patagonia Lithium Ltd | $0.195 | +5.41% |
| TLS | Telstra Group Ltd | $5.29 | -0.19% |
| TER | Terracom Ltd | $0.11 | +10.00% |
| FUEL | Betashares Global Energy Comp Currency Hedged ETF | $8.74 | +1.75% |
| CUE | CUE Energy Resources Ltd | $0.14 | +3.70% |
Relative Strength Index (RSI) Oversold
Code | Company | Last | % Chg |
|---|---|---|---|
| MGX | MGX Resources Ltd | $0.37 | +2.78% |
| CSC | Capstone Copper Corp | $10.20 | -2.67% |
| AUI | Australian United Investment Company Ltd | $10.43 | -1.60% |
| HVN | Harvey Norman Holdings Ltd | $5.05 | -1.37% |
| GLDN | iShares Physical Gold ETF | $52.90 | -3.34% |
