ASX 200 Live Today - Friday, 20th March
The S&P/ASX 200 is set for a flattish open after tumbling to near four month lows on Thursday. Here are today's top stories.

Today’s ASX 200 Updates
Welcome to our live ASX coverage for Friday, March 20. Expect a high volume of posts pre-market and more periodic updates throughout the day. We'll be wrapping the blog up around 2:00 pm AEST. Let us know how we can make it even better.
A rough week for equities
[2:44 pm] That's a wrap. What a rough week for equities, with the ASX 200 tracking 1.83% lower week-to-date, trading at the lowest since 24 November. From a sector perspective, Energy tops the leaderboards, along with the things we can't live without: Utilities, Staples, Telcos and Mortgages. On the flip side, the once high-flying Materials sector continues to aggressively unwind, and now down 3.2% year-to-date. Growth-y sectors like Discretionary and Tech also took a hit.
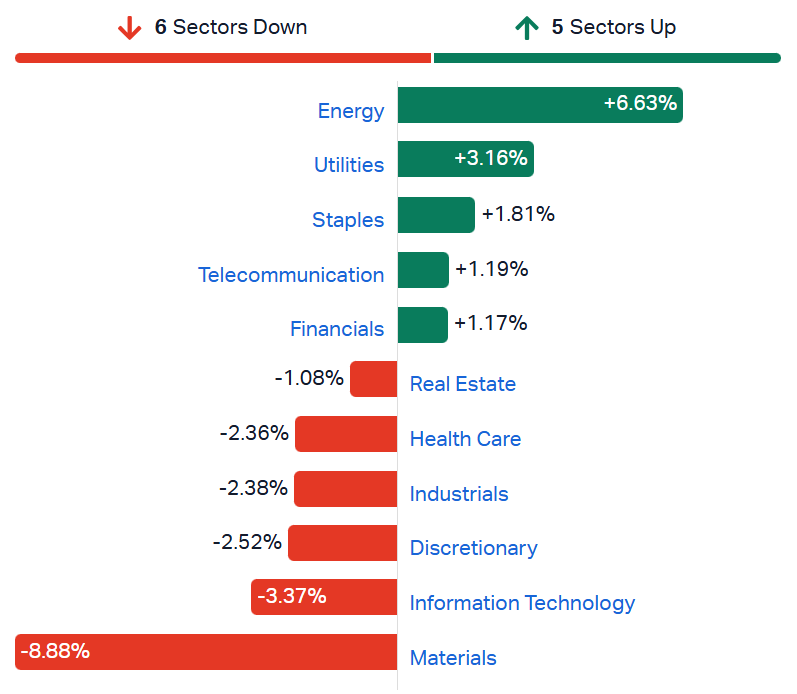
ASX 200 sectors, weekly returns (Source: Market Index)
Overall, the market continues to face a rather binary outcome where it's quick to rally on any hints of de-escalation and improved tanker traffic through the Strait, but grinding steadily lower as the reality plays out in the opposite direction. Commodities and miners are clearly starting to price in the former, while yields continue to pressure rather uncomfortable levels.
Citi upgrades Sonic Healthcare to Neutral from Sell
[2:10 pm] Citi sees a more balanced risk-reward at current levels following share price weakness, though structural concerns around the US business and cost pressures keep conviction limited.
Price target trimmed to $21.50 (from $22.00)
Upgrade to Neutral driven by valuation, with shares trading at 16x FY27 EPS and a 9% discount to the ASX 200
Concerns remain around the US business, where further underperformance is possible despite an operational review underway, alongside persistent group-level cost pressures
Australian pathology volumes in January were slightly softer year-on-year, though SHL outperformed the industry in 1H26
Downward consensus EPS revisions appear to be tapering, which supports the more balanced risk-reward call, but Citi does not rule out further downside from current levels
Company page: Sonic Healthcare (SHL)
Middle East conflict drives record refining margins, UBS lifts VEA estimates materially
[2:09 pm] Escalating attacks on Persian Gulf energy infrastructure and Asian export restrictions are pushing regional crack spreads to record highs, with Australian refiners the key beneficiaries.
UBS lifts VEA's 2026 refining EBITDA to $825m vs consensus at $175m, and group EBITDA to $1.4bn vs consensus at $832m
VEA 2026 EPS lifted 163% and 2027 EPS lifted 53% on revised refining margin assumptions
Price target lifted to $2.70 (from $2.40), with UBS reiterating its Buy rating
The cashflow windfall effectively removes leverage concerns for VEA, with UBS noting the fuel security payment review adds further potential upside
Australia's reliance on imported refined product (roughly 90% of diesel, 80% of jet fuel, 70% of gasoline sourced from Asia) means supply chain pressure will continue building while the Strait of Hormuz remains closed
Company page: Viva Energy (VEA)
Premier Investments back at breakeven
[1:19 pm] Premier Investments rallied as much as 8.3% this morning, now up just 0.6%. The company's 1H26 result was broadly below market expectations, though the stock was quite battered heading into the result, down 9.5% year-to-date and down ~60% in the last 15 months.
The key numbers from the result include:
Revenue down 0.5% to $453.9m vs $463.8m ests (2% miss)
EBIT margin of 26.4% and gross margin of 66.9%
NPAT (continuing ops) of $101.7m vs $103.6m ests (2% miss)
Interim dividend of 45 cps vs. Macquarie ests of 50.2 cps (10% miss)
FY26 full year underlying EBIT guidance of circa $183m vs. Macquarie ests of $213.3m (14% miss)
First 7 weeks of 2H26 are tracking ahead of the 1H26 sales growth trend
Battered miners begin to bounce
[1:16 pm] ASX 200 Materials Index dipped as much as 3.0% in early trade, now down just 1.5%. Starting to see some stocks reverse into positive territory after falling 15-25% since early March.
The below table observes the ASX 200 stocks making the largest move from today's open price.
Ticker | Company | % Chg from Open | Price |
|---|---|---|---|
WAF | West African Resources | 5.54% | $2.96 |
PLS | PLS Group | 5.43% | $4.27 |
PDN | Paladin Energy | 5.38% | $10.96 |
SMR | Stanmore Resources | 5.06% | $2.70 |
ILU | Iluka Resources | 4.49% | $6.29 |
LTR | Liontown | 4.44% | $1.46 |
CNU | Chorus | 4.30% | $8.00 |
MIN | Mineral Resources | 3.91% | $51.60 |
GMD | Genesis Minerals | 3.64% | $5.69 |
LYC | Lynas Rare Earths | 3.61% | $19.67 |
ALK | Alkane Resources | 3.57% | $1.45 |
CYL | Catalyst Metals | 3.25% | $6.04 |
BSL | Bluescope Steel | 3.11% | $26.84 |
MCY | Mercury NZ | 3.07% | $5.37 |
CMM | Capricorn Metals | 2.95% | $10.48 |
ASX 200 breadth check
[12:20 pm] The ASX 200 is down ~8% from recent highs and down 3% YTD but things are far more depressing beneath the surface.
The broad market selloff is significant. 88% of the ASX 200 is more than 10% off its 52-week high, and 42% are more than 30% off.
IT and Health Care are the hardest hit. Both have 100% of members trading >10% off their highs, and over 50% are more than 40% off.
Consumer Discretionary is also deeply under pressure. Every single member is more than 10% off their high, and 80% are down more than 30%.
Energy and Utilities are the clear defensive standouts as only 33% of Energy names are >10% off their highs, and no Utilities member has fallen more than 20%.
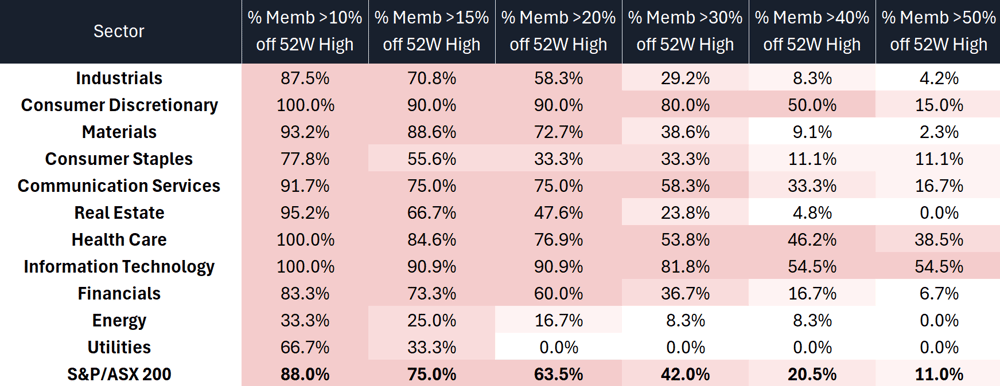
Source: Author's own calculations | Data as at Thursday, 19 March close
ASX 200 lower as miners extend losses
[11:55 am] ASX 200 down 0.48% and still making fresh intraday lows. Most sectors are trying to bounce, offset by another sharp decline for the Materials Index.
The S&P/ASX 200 Materials Index is down 2.3% today, and down 21% since its 2 March record high. Its now given back all of its year-to-date gains (peaked at 21.6%) and now down 4.1% for the year.
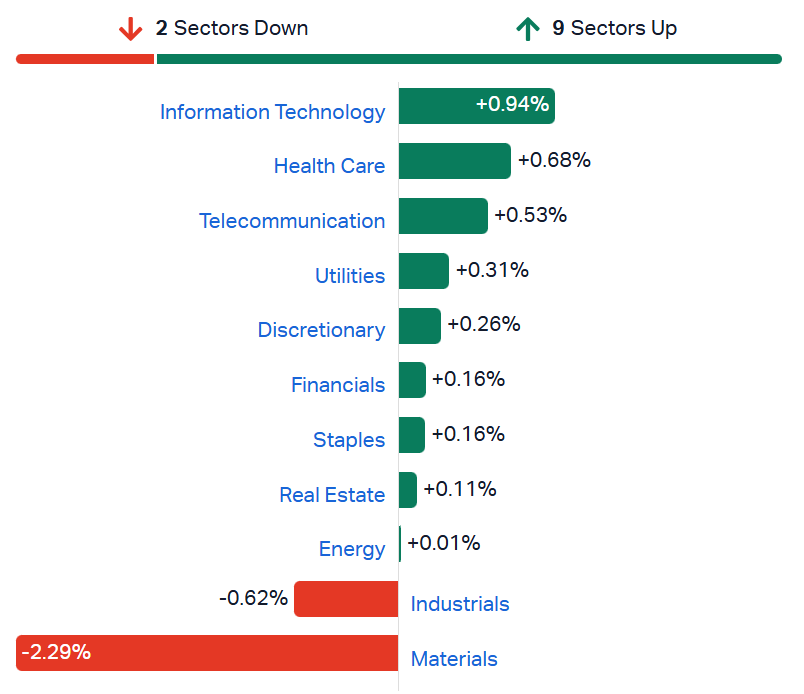
ASX 200 sectors (Source: Market Index)
Iron stocks lower
[11:13 am] Iron stocks are lower despite the iron ore prices holding steady at US$106.20.
Ticker | Company | % Chg | Price |
|---|---|---|---|
CIA | Champion Iron | -4.11% | $4.56 |
RIO | Rio Tinto | -3.40% | $146.21 |
BHP | Bhp Group | -2.54% | $47.12 |
FMG | Fortescue | -2.07% | $18.65 |
MIN | Mineral Resources | -1.65% | $50.57 |
By Stephanie Gardner
Copper stocks dip
[11:07 am] Copper stocks are lower despite reversing a 3.2% selloff overnight to finish the session 0.82% higher at US$5.54/lb.
Ticker | Company | % Chg | Price |
|---|---|---|---|
CPM | Cooper Metals | -9.62% | $0.05 |
29M | 29Metals | -4.48% | $0.32 |
AIS | Aeris Resources | -4.44% | $0.39 |
FFM | Firefly Metals | -2.56% | $1.53 |
BHP | Bhp Group | -2.52% | $47.13 |
CSC | Capstone Copper | -1.81% | $10.29 |
SFR | Sandfire Resources | -1.56% | $15.48 |
AR1 | Austral Resources Australia | -1.28% | $0.08 |
MC2 | Marimaca Copper | -1.17% | $9.31 |
HCH | Hot Chili | -1.12% | $1.33 |
CYM | Cyprium Metals | 2.00% | $0.36 |
HGO | Hillgrove Resources | 2.94% | $0.04 |
TAR | Taruga Minerals | 4.76% | $0.02 |
By Stephanie Gardner
Gold stocks sharply lower
[10:54 am] Gold fell 3.4% overnight to US$4654.23 to its lowest point since mid January, and is down 7% over the last 2 sessions.
Ticker | Company | % Chg | Price |
|---|---|---|---|
OBM | Ora Banda Mining | -7.42% | $1.19 |
BC8 | Black Cat Syndicate | -6.31% | $0.97 |
SBM | St. Barbara | -5.95% | $0.52 |
BGL | Bellevue Gold | -5.78% | $1.39 |
VAU | Vault Minerals | -5.33% | $3.91 |
NEM | Newmont Corporation | -5.05% | $138.86 |
RSG | Resolute Mining | -4.96% | $1.25 |
WGX | Westgold Resources | -4.55% | $5.14 |
EMR | Emerald Resources | -4.10% | $4.91 |
CMM | Capricorn Metals | -3.63% | $10.10 |
RRL | Regis Resources | -3.62% | $6.13 |
ALK | Alkane Resources | -3.46% | $1.40 |
PRU | Perseus Mining | -3.36% | $4.60 |
RMS | Ramelius Resources | -3.32% | $3.49 |
CYL | Catalyst Metals | -3.13% | $5.88 |
EVN | Evolution Mining | -3.07% | $11.84 |
NST | Northern Star Resources | -2.85% | $18.42 |
PNR | Pantoro Gold | -2.61% | $3.36 |
MEK | Meeka Metals | -1.88% | $0.16 |
GMD | Genesis Minerals | -0.73% | $5.47 |
BMR | Ballymore Resources | 0.00% | $0.18 |
AMI | Aurelia Metals | 0.00% | $0.24 |
By Stephanie Gardner
Uranium stocks continue to fall
[10:37 am] Uranium prices have hit a two-month low as prices dropped to US$84.81. After a relatively weak overnight session and ongoing weakness in commodity markets, ASX uranium stocks have continued to fall.
Ticker | Company | % Chg | Price |
|---|---|---|---|
T92 | Terra Critical Minerals | -1.23% | $0.08 |
DEV | Devex Resources | -1.76% | $0.17 |
NXG | Nexgen Energy | -2.38% | $16.01 |
DYL | Deep Yellow | -2.42% | $1.62 |
BMN | Bannerman Energy | -3.38% | $3.43 |
PEN | Peninsula Energy | -4.14% | $0.53 |
BOE | Boss Energy | -4.61% | $1.45 |
AGE | Alligator Energy | -5.13% | $0.04 |
LOT | Lotus Resources | -5.20% | $1.28 |
EL8 | Elevate Uranium | -5.45% | $0.26 |
PDN | Paladin Energy | -5.52% | $10.27 |
AEE | Aura Energy | -6.40% | $0.12 |
By Stephanie Gardner
Top ASX 200 gainers and losers
[10:20 am] Here are today's top gainers and losers on the S&P/ASX 200.
Ticker | Company | % Chg | Price |
|---|---|---|---|
PMV | Premier Investments | 7.75% | $13.49 |
VEA | Viva Energy Group | 6.17% | $2.58 |
CEN | Contact Energy | 3.50% | $7.99 |
TNE | Technology One | 3.49% | $26.66 |
WHC | Whitehaven Coal | 3.13% | $9.23 |
LOV | Lovisa | 3.11% | $20.90 |
ORG | Origin Energy | 2.81% | $12.09 |
GNE | Genesis Energy | 2.77% | $1.86 |
ALL | Aristocrat Leisure | 1.98% | $45.62 |
CSL | CSL | 1.92% | $137.21 |
Ticker | Company | % Chg | Price |
|---|---|---|---|
AAI | Alcoa Corporation | -8.12% | $82.19 |
PDI | Predictive Discovery | -7.50% | $0.74 |
OBM | Ora Banda Mining | -7.42% | $1.19 |
DRO | Droneshield | -7.13% | $3.91 |
BGL | Bellevue Gold | -6.12% | $1.38 |
LYC | Lynas Rare Earths | -6.06% | $18.76 |
DTR | Dateline Resources | -5.83% | $0.45 |
PDN | Paladin Energy | -5.61% | $10.26 |
ILU | Iluka Resources | -4.93% | $5.98 |
NEM | Newmont Corporation | -4.86% | $139.14 |
By Stephanie Gardner
ASX 200 YTD leaders and bleeders
[10:08 am] Here are the leaders and bleeders year to date on the S&P/ASX 200.
Ticker | Company | % Chg | Price |
|---|---|---|---|
DTR | Dateline Resources | 113.95% | $0.46 |
YAL | Yancoal Australia | 63.55% | $8.15 |
LYC | Lynas Rare Earths | 52.62% | $18.94 |
WDS | Woodside Energy Group | 43.83% | $34.13 |
NHC | New Hope Corporation | 41.65% | $5.68 |
DRO | Droneshield | 33.44% | $4.11 |
STO | Santos | 32.20% | $8.15 |
WOW | Woolworths Group | 25.20% | $36.76 |
VEA | Viva Energy Group | 24.64% | $2.58 |
CDA | Codan | 21.39% | $34.50 |
Ticker | Company | % Chg | Price |
|---|---|---|---|
ZIP | Zip Co | -53.67% | $1.52 |
PME | Pro Medicus | -45.38% | $120.51 |
360 | Life360 | -42.12% | $18.65 |
WTC | Wisetech Global | -38.97% | $41.80 |
SEK | Seek | -38.92% | $14.22 |
COH | Cochlear | -35.97% | $167.11 |
LLC | Lendlease Group | -35.48% | $3.36 |
PRN | Perenti | -33.33% | $1.86 |
AMP | Amp | -32.67% | $1.22 |
XRO | Xero | -32.41% | $76.99 |
By Stephanie Gardner
Premier Investments 1H26 results: Peter Alexander shines, Smiggle resets
[9:37 am] Premier Retail delivered in-line with its December guidance, as Peter Alexander's strong momentum offset an ongoing Smiggle reset.
Revenue down 0.5% to $453.9m vs $463.8m ests (2% miss)
EBIT of $119.3m, in line with December 2025 guidance
EBIT margin of 26.4% and gross margin of 66.9%
NPAT (continuing ops) of $101.7m vs $103.6m ests (2% miss)
Interim dividend of 45 cps vs. Macquarie ests of 50.2 cps (10% miss)
FY26 full year underlying EBIT guidance of circa $183m vs. Macquarie ests of $213.3m (14% miss)
First 7 weeks of 2H26 are tracking ahead of the 1H26 sales growth trend
From a division perspective:
Peter Alexander sales up 4.9% to $312.3m, with the loyalty program "Peter's Dreamers" on track to exceed 1 million customer acquisitions by end of FY26, loyalty members contributing 60% of brand sales at an average transaction value 45% above non-members
Smiggle sales down 10.7% to $140.5m, reflecting an 8.7% reduction in store numbers to 282, a strategic review has reset the brand's focus on the 6-12 year age group, with a return to growth targeted in 1H27
A fairly poor outcome, though PMV shares are down 9.6% year-to-date and down 40.2% in the last twelve months.
Company page: Premier Investments (PMV)
Copper swings into positive territory
[9:24 am] Copper prices managed to finish the overnight session 0.85% higher to US$5.54/lb despite falling as much as 3.2%. Prices experienced a strong bounce off the 200-day moving average (blue).
Despite the bounce, copper has still given back all of its year-to-date gains, now down 3.3% for the year compared to gains of ~10% in late January.
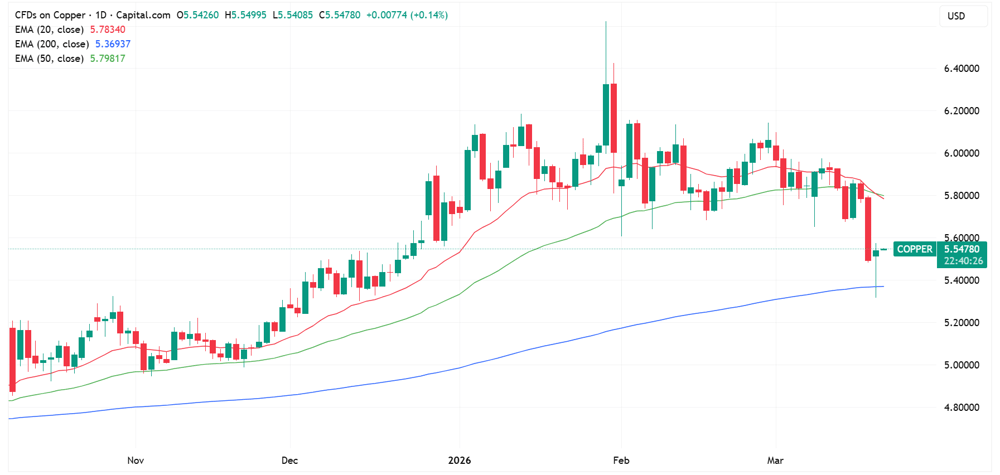
Copper daily price chart (Source: TradingView)
Gold continues to tumble
[9:17 am] Another rough overnight session for bullion, with prices down 3.4% to US$4,654/oz, the lowest since 2 February. Encouragingly, there was a solid bounce off session lows, where prices tumbled as much as 6.5% to U$4,502.
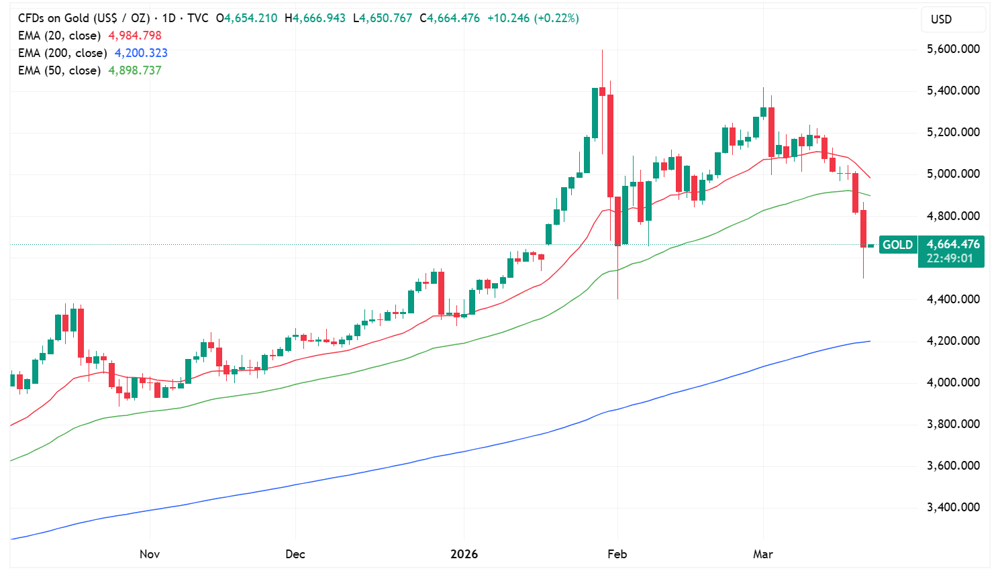
Gold daily price chart (Source: TradingView)
I've seen a lot of takes as to why gold is falling against this backdrop where it should, in theory, perform relatively well.
Gold's historic drivers (real rates, volatility, liquidity) have been replaced by sovereign reserve accumulation flows since 2022, when the freezing of Russian reserves pushed surplus countries to seek alternatives to US Treasuries and gold became the primary "neutral" reserve asset
This shift made gold pro-cyclical, meaning it rallies when surplus economies generate strong export revenues and accelerates reserve accumulation, and sells off when that surplus generation is disrupted, which is exactly what the Hormuz blockade is doing to GCC export revenues
Secondary effects compound the problem, such as China, the world's largest oil importer, facing slowing growth and compressed surpluses, with the same dynamic rippling through Korea, Taiwan, Japan and the rest of Asia, collectively weakening the reserve accumulation bid that had been the primary source of gold demand
On top of the structural headwind, leveraged funds and CTAs are selling gold to cover margin calls elsewhere given it ran 66% in 2025 and remains the most liquid asset with the largest embedded gains, making it the first cab off the rank in a forced liquidation
A firmer US dollar, rising real yields (a headwind for non-yielding assets), a hawkish Fed, and systematic long liquidation
That said, the long-term thesis remains intact as the dollar reserve standard continues to erode and surplus countries still need alternatives to Treasuries, but gold is now more volatile and that volatility will track global growth and surplus generation rather than traditional safe-haven dynamics.
Central banks hold firm as Middle East war clouds the outlook
[9:09 am] A wave of central bank decisions overnight, with a near-universal shift toward caution as the Iran conflict complicates both inflation and growth trajectories globally.
The ECB held for a sixth straight meeting, significantly lifting its 2026 inflation forecast to 2.6% while publishing worst-case scenarios that include a eurozone recession and a major inflation spike, with Lagarde stressing the bank is "well positioned" to navigate uncertainty
The Bank of England held unanimously at 3.75% but delivered a hawkish pivot, dropping language that rates would "likely be reduced further" and opening the door to hikes, prompting traders to fully price in two quarter-point increases by year-end, with two-year gilt yields surging 26 basis points
The Riksbank held at 1.75% for a fourth straight meeting, reiterating no moves are expected through 2027, though it raised its 2026 inflation forecast and trimmed its growth outlook, with one economist noting the bank is "sitting still in the interest rate boat on an increasingly stormy sea"
Brazil's central bank delivered its first rate cut since 2024, trimming the Selic by 25 basis points to 14.75% in a unanimous decision, but offered no forward guidance, with the pace of future cuts explicitly contingent on the depth and duration of the Middle East conflict and its impact on oil and inflation
AI drives another wave of corporate layoffs
[9:05 am] Here's a fresh list of companies that announced potential layoffs overnight, with AI adoption increasingly cited as the primary driver.
Goldman Sachs is shifting from its traditional single-round cull to rolling cuts starting in April, with a focus on underperforming staff
Crypto.com is cutting 12% of its workforce, with CEO Kris Marszalek explicitly stating companies that don't pivot to AI "will fail"
HSBC is weighing cuts of around 20,000 roles (roughly 10% of its workforce) over three to five years, targeting middle and back-office functions as AI automates non-client-facing work
Iran's attacks on Qatar's Ras Laffan send gas prices surging
[9:02 am] Direct missile strikes on the world's largest LNG export facility have caused extensive damage and ignited fears of a prolonged global gas supply shock.
QatarEnergy confirmed several of its LNG facilities at Ras Laffan suffered sizable fires and extensive damage, with Shell's gas-to-liquids plant also hit. The complex accounts for roughly a fifth of global LNG supply, which had already been halted earlier this month following a prior Iranian drone attack.
UK natural gas futures jumped as much as 24% overnight, while European gas prices rose more than 20%
President Trump warned the US would retaliate if Qatar's LNG facilities were attacked again, adding a geopolitical escalation dimension that markets will need to price in.
No Fed rate cuts for 2026
[9:01 am] The base case for where interest rates will be by year-end is now a hold at 3.50-3.75%, according to CME's Fedwatch Tool.
In the last 24 hours, markets have even priced in a 19.8% likelihood of a 25 bp hike, while the odds for a 25 bp cut slipped to 26.0%.
CME's Fedwatch Tool calculates these probabilities via 30-day Fed Funds futures prices. You can check out the site here.
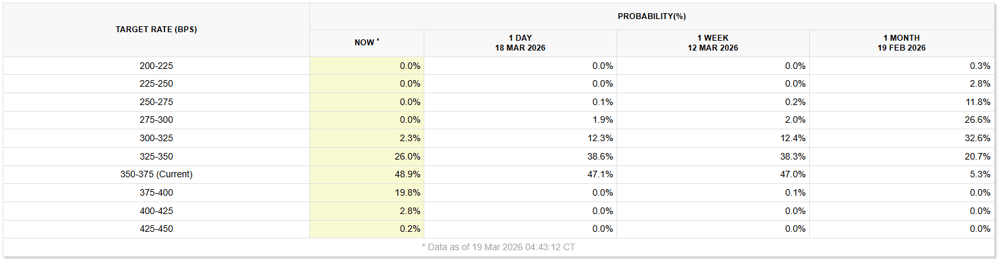
Source: CME Fedwatch Tool
Fed signals fewer cuts as bond markets reprice
[8:56 am] Powell's post-meeting comments cemented a hawkish pivot, forcing traders to sharply reassess the rate cut outlook amid rising inflation pressures and Middle East uncertainty.
Markets now price just one rate cut in 2026 as a coin flip, a dramatic shift from three weeks ago when traders were leaning towards three cuts this year
Two-year yields surged as much as 10 basis points to nearly 3.78%, the highest in seven months, while 10-year yields rose as much as 7 basis points to 4.27%
Two-year yields are up 38 basis points in March, heading for the biggest monthly surge since October 2024, all but erasing the Treasury rally from February
Powell noted "meaningful" movement among policymakers towards fewer cuts, with rate hike discussions resurfacing for the second consecutive meeting
The updated dot plot shows just one quarter-point cut in 2026 and one in 2027, with the oil price shock adding a stagflationary dimension to an already complex inflation picture
Source: Bloomberg
BofA's Hartnett sees consumer stocks as top trade amid stagflation fears
[8:55 am] BofA strategist Michael Hartnett says consumer stocks have already priced in stagflation risk, making them the standout near-term opportunity even as oil prices climb.
Hartnett flagged consumer and lower-income-focused stocks as the best tactical trade right now, arguing they have already discounted a stagflationary environment that most investors are avoiding
Rising oil prices risk delaying Fed rate cuts and pushing equities lower, with Hartnett suggesting the S&P 500 around 6,600 as a potential entry point for buyers
He cautioned that markets are conditioned to expect central bank intervention at the first sign of stress, and this "Gen QE" mindset may need to be broken before the Fed actually acts
Source: Bloomberg
Investment banks offer hedges against private credit exposure
[8:54 am] Major investment banks are creating structured products allowing clients to short the $1.8 trillion private credit market amid growing stress signals.
Goldman Sachs has assembled multiple baskets, including one focused on European financial institutions with private credit exposure, a BDC-specific index, and a broader alternatives managers basket
JPMorgan's offering similarly covers alternatives managers and BDCs, with clients able to take both long and short positions via the indices
Bank of America had a basket of European firms including Partners Group, Deutsche Bank and AXA, though it has since withdrawn its recommendation that clients bet against these names
The private credit market is facing a wave of redemptions, with BlackRock, Morgan Stanley and Cliffwater all recently imposing withdrawal limits after redemption requests exceeded allowable thresholds
Source: Bloomberg
S&P 500 hits the 200-day moving average
[8:50 am] The S&P 500 hit the 200-day moving average (blue) for the first time since 7 May 2025.
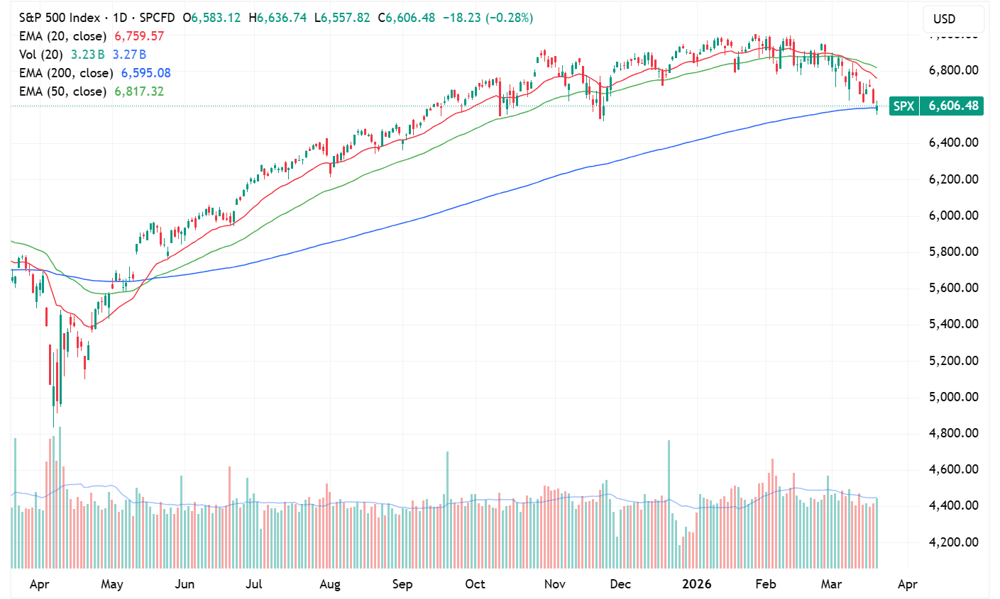
S&P 500 daily price chart (Source: TradingView)
If you use Exponential Moving Averages (EMA), then it closed above the 200-day, but if you use Simple Moving Averages (SMA), it closed below.
What's the difference? EMA gives more weight to recent prices, SMA calculates the average on an equal-weight basis. EMA is good for shorter-term trading, SMA is better for long-term trends.
Good morning!
[8:34 am] ASX 200 futures are down 5 pts (-0.05%) as of 8:30 am AEDT.
The overnight session in a nutshell:
Major US benchmarks mostly lower, but off worst levels (S&P 500 down 0.28% vs. low of -1.01%)
S&P 500, Nasdaq and Russell 2000 all hit their 200-day moving averages, with price action signaling some degree of support around these key levels
Heavy selling across the commodity complex, with gold down ~3.5% (dipped as much as 6.5%), year-to-date gains have faded from more than 25% to just 7.6%
