News | Market Wraps
Evening Wrap: ASX 200 flat as Middle East talks fail to materialise, oil rallies, WDS, STO recover
The S&P/ASX 200 closed 8.6 points lower, down 0.10%.

Mentioned
The S&P/ASX 200 closed 8.6 points lower, down 0.10%.
The ASX 200 edged lower as markets paused following yesterday’s relief rally, with conflicting signals on Middle East negotiations keeping investors cautious. Oil prices firmed again as hopes for a near-term resolution faded, reinforcing the market’s sensitivity to every headline out of the region.
In stock specific news:
Infratil (IFT) (+3.9%) — rose after upgrading earnings guidance for its CDC data centre business on strong demand.
Nufarm (NUF) (+7.1%) — surged after expanding its partnership with BP to support growth in sustainable aviation fuel and renewable diesel.
Airtasker (ART) (+2.2%) — gained after securing a $5 million media partnership with Nine Entertainment.
AMP (AMP) (-0.4%) — slipped after appointing Adrian Ryan as acting chief financial officer.
Be sure to click/scroll through for the usual reporting of the major sector and stock-specific moves, the broker responses to them, as well as all the key economic data in tonight's Evening Wrap.
Also, I have detailed technical analysis on the Nasdaq Composite and the S&P/ASX 200 in today's ChartWatch.
Let's dive in!
Today in Review
Thu 26 Mar 26, 5:08pm (AEST)
Name | Value | % Chg |
|---|---|---|
Major Indices | ||
| ASX 200 | 8,525.7 | -0.10% |
| All Ords | 8,726.5 | -0.22% |
| Small Ords | 3,344.6 | -1.00% |
| All Tech | 2,591.6 | -1.67% |
| Emerging Companies | 2,916.8 | -1.33% |
Currency | ||
| AUD/USD | 0.6952 | +0.06% |
US Futures | ||
| S&P 500 | 6,616.75 | -0.36% |
| Dow Jones | 46,544.0 | -0.36% |
| Nasdaq | 24,272.75 | -0.39% |
Name | Value | % Chg |
|---|---|---|
Sector | ||
| Energy | 11,144.2 | +1.54% |
| Health Care | 28,065.3 | +0.87% |
| Utilities | 10,349.8 | +0.34% |
| Consumer Staples | 12,477.8 | +0.10% |
| Industrials | 7,926.3 | +0.09% |
| Financials | 9,495.2 | +0.03% |
| Consumer Discretionary | 3,419.0 | -0.35% |
| Materials | 21,418.8 | -0.42% |
| Real Estate | 3,300.3 | -0.87% |
| Communication Services | 1,683.1 | -0.91% |
| Information Technology | 1,585.4 | -2.30% |
Markets
%20intraday%20chart_26%20Mar.png)
ASX 200 Session Chart
The S&P/ASX 200 (XJO) finished 8.6 points lower at 8,525.7, roughly mid-range — just 0.39% from its session high and 0.26% from its low. Arguably, despite the modest decline in the benchmark, broader market breadth is flashing some warning signs, with advancers lagging decliners 87 to 193.
Energy (XEJ) (+1.5%) rebounded as Brent crude pushed back toward the US$100/bbl mark on renewed uncertainty around Middle East negotiations. Markets are stuck in the washing machine of news and fake news, and today’s lack of progress was enough to drive buyers back into the sector. Santos (STO) (+2.5%) and Woodside Energy Group (WDS) (+2.3%) led gains.
Health Care (XHJ) (+0.9%) moved higher, largely on the back of its biggest constituent, CSL (CSL) (+2.4%). I note the stock remains 42% below levels seen a year ago.
Utilities (XUJ) (+0.3%) edged higher in sympathy with energy stocks as another defensive pocket of the market. AGL Energy (AGL) (+0.6%) was a notable mover.
Information Technology (XIJ) (-2.3%) resumed its entrenched downtrend as higher bond yields weighed on long-duration growth names. The Australian 2-year yield pushed sharply higher, reinforcing the pressure on valuations. WiseTech Global (WTC) (-3.2%) and Xero (XRO) (-3.2%) led declines.
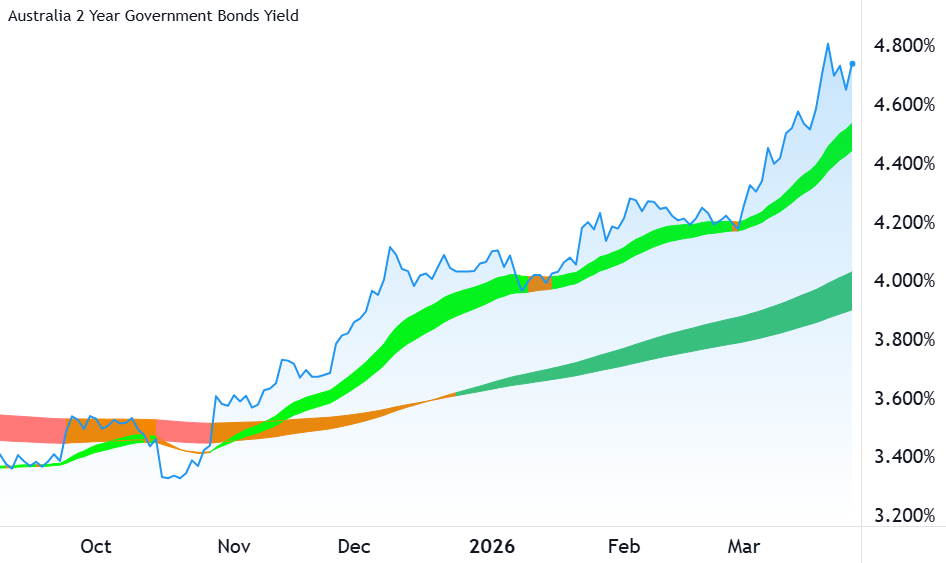
Australian 2-Year Government Bond yield chart
Gold Sub-Index (XGD) (-2.1%) fell as the lack of progress on Middle East de-escalation undermined yesterday’s rally. Genesis Minerals (GMD) (-4.3%) and Ramelius Resources (RMS) (-3.3%) were among the weakest.
Real Estate (XPJ) (-0.9%) and Consumer Discretionary (XDJ) (-0.4%) also softened as rising bond yields weighed on rate-sensitive sectors. Higher yields reduce the appeal of property income streams and pressure consumer spending. Goodman Group (GMG) (-1.2%) and JB HI-FI (JBH) (-1.0%) were weaker.
In commodities, gold fell in Asian trade, dropping 2.7% to US$4,428/oz, while silver declined 4.0% to US$69.71/oz as sentiment shifted away from safe-haven assets.
Copper also weakened in Asian trade, falling 1.7% to US$5.47/lb despite firmer prices overnight on the London Metal Exchange.
Iron ore rose 1.6% in Singapore trade to US$107.30/t, recovering much of yesterday’s decline, but that strength did little to offset broader weakness across bulk miners.
Brent crude climbed 2.0% in Asian trade to US$99.20/bbl as supply concerns persisted.
Lithium prices strengthened in China trade, with spodumene concentrate rising 2.6% to US$2,210/t, supporting PLS Group (PLS) (+1.0%), while Mineral Resources (MIN) (-2.6%) and IGO (IGO) (-2.6%) lagged.
Today's best blue chip gainers
Company | Last Price | Change $ | Change % | 1mo % | 1yr % |
|---|---|---|---|---|---|
Orica (ORI) | $20.60 | +$1.07 | +5.5% | -14.8% | +18.0% |
Santos (STO) | $7.85 | +$0.19 | +2.5% | +15.1% | +18.0% |
CSL (CSL) | $144.35 | +$3.36 | +2.4% | -0.5% | -42.9% |
Dyno Nobel (DNL) | $3.12 | +$0.07 | +2.3% | -6.6% | +16.0% |
Woodside Energy (WDS) | $34.38 | +$0.76 | +2.3% | +21.7% | +47.9% |
Worley (WOR) | $11.17 | +$0.24 | +2.2% | -14.3% | -23.3% |
Amcor (AMC) | $58.22 | +$0.92 | +1.6% | -16.7% | -22.4% |
Telix Pharmaceuticals (TLX) | $12.92 | +$0.19 | +1.5% | +40.4% | -55.8% |
Downer EDI (DOW) | $7.85 | +$0.1 | +1.3% | -7.8% | +43.2% |
Atlas Arteria (ALX) | $4.37 | +$0.05 | +1.2% | -9.7% | -10.3% |
Sonic Healthcare (SHL) | $20.38 | +$0.23 | +1.1% | -11.9% | -21.2% |
Bank of Queensland (BOQ) | $6.89 | +$0.07 | +1.0% | -1.1% | +3.0% |
PLS Group (PLS) | $4.97 | +$0.05 | +1.0% | +2.5% | +170.1% |
Metcash (MTS) | $3.00 | +$0.03 | +1.0% | -9.4% | -4.2% |
Transurban (TCL) | $13.96 | +$0.13 | +0.9% | -1.8% | +5.6% |
Light & Wonder (LNW) | $124.42 | +$1.04 | +0.8% | -6.7% | -26.4% |
Rio Tinto (RIO) | $151.02 | +$1.11 | +0.7% | -7.2% | +25.9% |
Ramsay Health Care (RHC) | $40.47 | +$0.26 | +0.6% | +6.0% | +22.5% |
Coles (COL) | $21.88 | +$0.14 | +0.6% | +0.3% | +13.3% |
AGL Energy (AGL) | $9.76 | +$0.06 | +0.6% | -2.2% | -8.4% |
Today's worst blue chip losers
Company | Last Price | Change $ | Change % | 1mo % | 1yr % |
|---|---|---|---|---|---|
Treasury Wine Estates (TWE) | $3.37 | -$0.17 | -4.8% | -27.4% | -65.8% |
Genesis Minerals (GMD) | $5.85 | -$0.26 | -4.3% | -19.8% | +57.7% |
Ramelius Resources (RMS) | $3.56 | -$0.12 | -3.3% | -25.2% | +56.1% |
Wisetech Global (WTC) | $38.33 | -$1.28 | -3.2% | -19.7% | -55.1% |
Xero (XRO) | $72.40 | -$2.37 | -3.2% | -4.4% | -54.8% |
Life360 (360) | $18.98 | -$0.62 | -3.2% | -17.7% | -11.3% |
Car (CAR) | $22.95 | -$0.71 | -3.0% | -6.7% | -31.7% |
Seek (SEK) | $13.85 | -$0.42 | -2.9% | -13.8% | -40.6% |
Newmont (NEM) | $144.88 | -$4.35 | -2.9% | -17.2% | +92.8% |
Greatland Resources (GGP) | $10.11 | -$0.3 | -2.9% | -24.7% | 0% |
Sandfire Resources (SFR) | $15.93 | -$0.46 | -2.8% | -22.2% | +41.9% |
REA (REA) | $153.62 | -$4.3 | -2.7% | -1.3% | -34.8% |
Mineral Resources (MIN) | $55.36 | -$1.49 | -2.6% | -4.8% | +125.8% |
IGO (IGO) | $7.63 | -$0.2 | -2.6% | -12.5% | +85.6% |
James Hardie Industries (JHX) | $27.78 | -$0.67 | -2.4% | -22.2% | -26.8% |
Qantas Airways (QAN) | $8.51 | -$0.19 | -2.2% | -20.1% | -10.8% |
Block, (XYZ) | $86.20 | -$1.91 | -2.2% | +19.1% | -11.6% |
Eagers Automotive (APE) | $22.35 | -$0.48 | -2.1% | -7.4% | +42.9% |
Evolution Mining (EVN) | $12.64 | -$0.26 | -2.0% | -22.1% | +83.5% |
ChartWatch
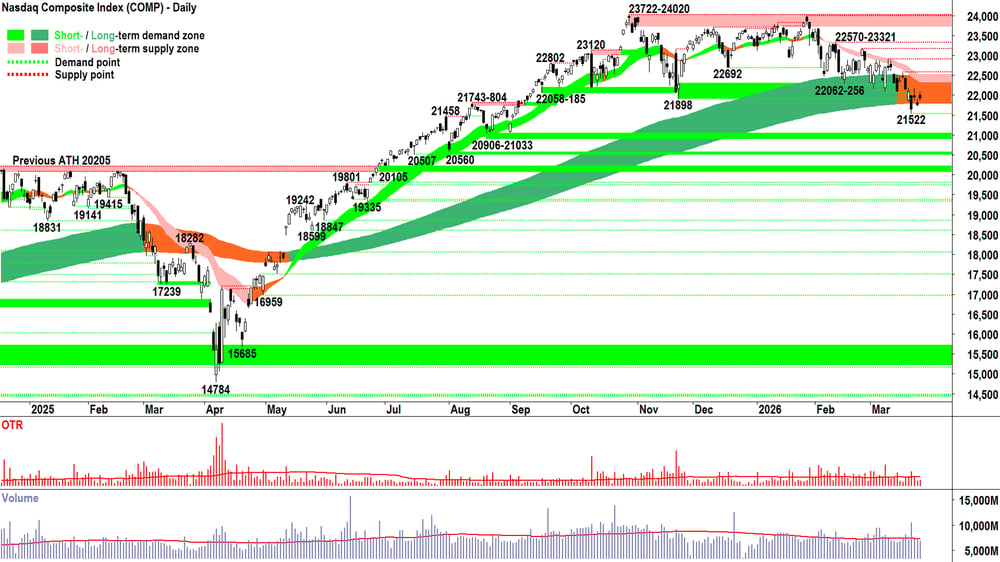
Nasdaq Composite Index
Analysis
What do you call it when according to the mainstream financial media “stock prices are rising”, but the chart looks like the one above?
= 4 black bodied candles in a row. 3 of those with upward pointing shadows — demonstrating at least some degree of unconvinced sell the rally (“STR”) business!
I’d call it “unconvincing”. As in:
The demand-side, i.e., those with cash, looking to allocate risk, with a view to earning the maximum return for their risk tolerance — are UNCONVINCED there’s any great rush to do so. There’s little fear of missing out (“FOMO”) when prices are rallying, and they’re not very active when prices are pulling back — so there’s a lack of buy the dip (“BTD”).
The supply-side, i.e., those with stock who are holding on for upside (“HOFU”) suitably greater than the perceived risk — are UNCONVINCED there’s any great need to do so. They’re happy to offload stock (risk), in favour of the safety of cash. Higher prices don’t seem to be stimulating them to HOFU, but rather, to take advantage of what they perceive as a better value-vs-risk proposition — i.e., STR!
For a bull market, we really need the opposite of the above. 🙃
It might happen tonight. It might not happen until 6-months from now. The good news is, we’ll know when it does happen.
Media hype aside, money talks and … well you know the rest of that old saying! 😉
ACDC wouldn't lie to us... Just "listen to the money talk"! 🤘
Money does talk. And it can’t flow into or out of an asset (in this case the Comp) without creating black or white candles, downward or upward pointing shadows, volume, price action and trends.
We will see when the balance swings back to the confident, dare I say, dominant demand-side control associated with a bull market. Similarly, we may see more of the recent bear market traits also. Right now, the evidence is not in favour of the bull — but nor is it yet convincing bear.
Certainly, it’s closer to the latter than the former, though! ⚖️
And so, we wait. Wait for confirmation. Wait for a clean and clear trend to follow.
Until then… you know the drill 👇
View
1/3RP (RP = Risk Position — it reflects my personal allowable capital allocation limit for my investments in US stocks. So 1/2RP is 50%, 2/3RP is 67% and FRP is 100% 🪣).
Key levels
The next key point of demand is 21522, with the 20906-21033 zone not far beyond that. We'll watch the price action and candles closely there for signs excess demand is indeed manifesting itself. Below 21522 my model will officially call the commencement of a long term downtrend.
The short term downtrend ribbon (presently 22327-22525) is the nearest critical zone of point supply, and 22570-22907-23170-23321 aren't far beyond that. We must see a long white-bodied candle closing at least above the short term trend ribbon to indicate the demand-side is any chance of being back in control of the Comp's price.
S&P/ASX 200 (XJO)
%20chart_26%20Mar.png)
Analysis
The first thing I’ll note is that yesterday’s long white-bodied candle here is notably absent on the Comp = I put to you, today’s only very modest pullback is a very good outcome.
It could have been worse. Sure, there wasn’t any real FOMO-follow up from yesterday’s Old Tin Pot heroics, but neither was there any great panic to lock in newly found gains.
Clearly, judging by the trainwreck of technicals that are still prevalent in the chart above — we’re far from out of the woods, but baby steps is better than no steps!
Or a big backward step…
Also, just as clearly, those two caterpillars — one pink and one orange — could prove to be an insurmountable challenge for any continuing rally, should it emerge.
We must watch the price action there (presently 8653-8776) closely:
Upward pointing shadows and/or long black bodies = Fingerprints of excess supply — lurking in the system to STR!
Downward pointing shadows and/or long white bodies = Fingerprints of excess demand — returning to the system with FOMO + HOFU + BTD!
Equally, 8262 is the critical downside price to watch. It was a point of excess demand in the past — an area in price where the big fund managers saw value and waded back into stocks despite the substantial risks.
Quite simply, if we close below that point — then that demand is consumed. ⚠️🚨
In the meantime, as the twisted metal of the ongoing trainwreck creaks and groans, we wait for confirmation of the big money’s next move.
View
No change to my prevailing OTP risk bucket setting: 1/3RP 🪣 (i.e., my personal allowable capital allocation limit for my investments in Australian stocks is 33%).
Key levels
8262-8284 is the closest zone of demand (static). The ASX 200 must at least close back above the short- and long term uptrend ribbons (presently 8653-8722. and 8661-8746 respectively) to reclaim any semblance of demand-side control.
ChartWatch *LIVE* Webinar
ChartWatch *LIVE* Webinars – WEEKLY Wednesday's @ 12pm AEDT
Learn more about technical analysis and trend following through real case studies on ASX stocks. Australia's premier technical analyst, Carl Capolingua, shares his unique insights on stocks as requested by viewers. Ask about a company in your portfolio or anything related to trading and investing and get Carl's expert opinion.
Places are limited so >REGISTER NOW!<
Economy
Today
There weren't any major economic data releases in our time zone today
Later this week
Friday
No major economic news scheduled for this day
Saturday
No major economic news scheduled for this day
Latest News
Interesting Movers
Trading higher
+11.9% Echoiq (EIQ) – Continued positive response to 24-Mar Agreement with Mayo Clinic for EchoSolv HF, rise is consistent with prevailing short and long term uptrends, a regular in ChartWatch ASX Scans Uptrends list 🔎📈
+7.1% Nufarm (NUF) – NUF strengthens strategic collab to support long term growth.
+6.9% Myer (MYR) – No news since 24-Mar Half-Year Results - Release and Presentation.
+5.5% Orica (ORI) – No news since 24-Mar Clarification - Media Reports.
+5.2% Droneshield (DRO) – No news, general strength across the broader Defence sector today, rise is consistent with prevailing short and long term uptrends, a regular in ChartWatch ASX Scans Uptrends list 🔎📈
+4.7% Electro Optic Systems (EOS) – Becoming a substantial holder, general strength across the broader Defence sector today, (Vanguard Group +5.1%), rise is consistent with prevailing short and long term uptrends, a regular in ChartWatch ASX Scans Uptrends list 🔎📈
+4.0% Tasmea (TEA) – No news, rise is consistent with prevailing short and long term uptrends, a recent regular in ChartWatch ASX Scans Uptrends list 🔎📈
+3.9% BetaShares Crude Oil ETF (OOO) – No news (long crude oil ETF), general strength across the broader Energy sector today, rise is consistent with prevailing short and long term uptrends, a regular in ChartWatch ASX Scans Uptrends list 🔎📈
+3.7% Karoon Energy (KAR) – No news, general strength across the broader Energy sector today, rise is consistent with prevailing short and long term uptrends, a regular in ChartWatch ASX Scans Uptrends list 🔎📈
+2.5% Viva Energy (VEA) – No news, general strength across the broader Energy sector today, rise is consistent with prevailing short term uptrend and long term trend is transitioning from down to up, a regular in ChartWatch ASX Scans Uptrends list 🔎📈
+2.5% Santos (STO) – No news, general strength across the broader Energy sector today, rise is consistent with prevailing short and long term uptrends, a regular in ChartWatch ASX Scans Uptrends list 🔎📈
+2.4% Beach Energy (BPT) – No news, general strength across the broader Energy sector today.
+2.3% Woodside Energy (WDS) – Woodside assumes control of Beaumont New Ammonia operations, general strength across the broader Energy sector today, rise is consistent with prevailing short and long term uptrends, a regular in ChartWatch ASX Scans Uptrends list 🔎📈
Trading lower
-12.8% (MI6) – Release of Securities from Escrow.
-11.5% Amplia Therapeutics (ATX) – No news, today’s move is consistent with recent volatility.
-9.0% Benz Mining (BNZ) – No news, general weakness across the broader Precious Metals sector today, today’s move is consistent with recent volatility.
-8.5% Nickel Industries (NIC) – Hengjaya Mine Operations Suspended.
-8.1% Dateline Resources (DTR) – No news, pulled back in the wake of recent sharp rally.
-7.8% G8 Education (GEM) – No news, fall is consistent with prevailing short and long term downtrends, a regular in ChartWatch ASX Scans Downtrends list 🔎📉
-7.8% Larvotto Resources (LRV) – No news, general weakness across the broader Precious Metals sector today.
-7.7% Megaport (MP1) – No news, general weakness across the broader Information Technology sector today.
-6.7% Kingsgate Consolidated (KCN) – Thailand and Legal Update, general weakness across the broader Precious Metals sector today.
-6.2% Ausgold (AUC) – No news, general weakness across the broader Precious Metals sector today.
-6.1% L1 (L1G) – IPO of L1 Gold Fund Limited to raise approx. $A900 Million.
-6.0% Santana Minerals (SMI) – No news, general weakness across the broader Precious Metals sector today, fall is consistent with prevailing short term downtrend and long term trend is transitioning from up to down, a recent regular in ChartWatch ASX Scans Downtrends list 🔎📉
-5.8% Sun Silver (SS1) – No news, general weakness across the broader Precious Metals sector today.
-5.3% Unico Silver (USL) – No news, general weakness across the broader Precious Metals sector today.
-4.8% Treasury Wine Estates (TWE) – Change in substantial holding and Ceasing to be a substantial holder (both relating to Citigroup Global Markets sell down), fall is consistent with prevailing short and long term downtrends, one of the most Featured (highest conviction) stocks in ChartWatch ASX Scans Downtrends list 🔎📉
Broker Moves
Amplitude Energy (AEL)
Retained at buy at Canaccord Genuity; Price Target: $3.00 from $3.65
Retained at buy at Euroz Hartleys; Price Target: $3.25 from $4.46
Retained at overweight at Jarden; Price Target: $2.20 from $2.85
Downgraded to sector perform from outperform at RBC Capital Markets; Price Target: $2.00 from $2.80
Auckland International Airport (AIA)
Retained at outperform at Macquarie; Price Target: $9.31
ANZ Group Holdings (ANZ)
Retained at lighten at Ord Minnett; Price Target: $33.00
Bendigo and Adelaide Bank (BEN)
Retained at accumulate at Ord Minnett; Price Target: $11.50
Retained at neutral at UBS; Price Target: $11.09
Bank of Queensland (BOQ)
Retained at hold at Ord Minnett; Price Target: $6.00
Retained at buy at UBS; Price Target: $7.50
Commonwealth Bank of Australia (CBA)
Retained at sell at Ord Minnett; Price Target: $120.00
Retained at sell at UBS; Price Target: $130.00
Channel Infrastructure NZ (CHI)
Retained at neutral at Macquarie; Price Target: $2.77
Freightways Group (FRW)
Retained at outperform at Macquarie; Price Target: $15.65
Judo Capital Holdings (JDO)
Retained at buy at Ord Minnett; Price Target: $2.40
MA Financial Group (MAF)
Initiated at buy at Canaccord Genuity; Price Target: $11.30
Many Peaks Minerals (MPK)
Retained at speculative buy at Canaccord Genuity; Price Target: $1.85
Medibank Private (MPL)
Retained at neutral at Macquarie; Price Target: $4.80
Macquarie Group (MQG)
Retained at equal-weight at Morgan Stanley; Price Target: $223.00
Retained at buy at Ord Minnett; Price Target: $255.00
Retained at buy at UBS; Price Target: $235.00
Myer Holdings (MYR)
Retained at hold at Ord Minnett; Price Target: $0.32 from $0.67
National Australia Bank (NAB)
Retained at sell at Ord Minnett; Price Target: $37.00
NIB Holdings (NHF)
Retained at underperform at Macquarie; Price Target: $6.05
NRW Holdings (NWH)
Retained at accumulate at Morgans; Price Target: $6.60
Orezone Gold Corporation (ORE)
Retained at buy at Canaccord Genuity; Price Target: $4.00
Qantas Airways (QAN)
Retained at buy at Citi; Price Target: $12.10
Retail Food Group (RFG)
Retained at buy at Shaw and Partners; Price Target: $2.00
Ramsay Health Care (RHC)
Retained at outperform at Macquarie; Price Target: $43.30 from $45.10
SGH (SGH)
Initiated at overweight at Morgan Stanley; Price Target: $50.00
Tuas (TUA)
Retained at overweight at Morgan Stanley; Price Target: $10.00
Westpac Banking Corporation (WBC)
Retained at sell at Ord Minnett; Price Target: $31.00
Scans
Top Gainers
Code | Company | Last | % Chg |
|---|---|---|---|
| IG6 | International Graphite Ltd | $0.063 | +40.00% |
| KLI | Killi Resources Ltd | $0.19 | +35.71% |
| PCL | Pancontinental Energy NL | $0.013 | +30.00% |
| EMD | Emyria Ltd | $0.048 | +29.73% |
| EM3 | Emc Gold Corporation | $0.25 | +25.00% |
Top Fallers
Code | Company | Last | % Chg |
|---|---|---|---|
| NGY | Nuenergy Gas Ltd | $0.05 | -43.18% |
| FRB | Firebird Metals Ltd | $0.18 | -18.18% |
| LRM | Lion Rock Minerals Ltd | $0.02 | -16.67% |
| AAU | Antilles Gold Ltd | $0.011 | -15.39% |
| TG1 | Techgen Metals Ltd | $0.043 | -14.00% |
52 Week Highs
Code | Company | Last | % Chg |
|---|---|---|---|
| KLI | Killi Resources Ltd | $0.19 | +35.71% |
| EIQ | Echoiq Ltd | $0.895 | +11.88% |
| PL3 | Patagonia Lithium Ltd | $0.18 | +9.09% |
| AGI | Ainsworth Game Technology Ltd | $1.24 | +8.77% |
| TBN | Tamboran Resources Corporation | $0.24 | +6.67% |
52 Week Lows
Code | Company | Last | % Chg |
|---|---|---|---|
| LGM | Legacy Minerals Holdings Ltd | $0.14 | -12.50% |
| INF | Infinity Metals Ltd | $0.012 | -7.69% |
| MAG | Magmatic Resources Ltd | $0.031 | -6.06% |
| MBG | MB Gold Ltd | $0.16 | -5.88% |
| TRJ | Trajan Group Holdings Ltd | $0.40 | -5.88% |
Near Highs
Code | Company | Last | % Chg |
|---|---|---|---|
| DGVA | Dimensional Global Value Trust - Active ETF | $27.54 | +0.18% |
| AZJ | Aurizon Holdings Ltd | $3.98 | +0.25% |
| TLS | Telstra Group Ltd | $5.31 | -0.19% |
| 4DX | 4DMEDICAL Ltd | $6.28 | +0.80% |
| FUEL | Betashares Global Energy Comp Currency Hedged ETF | $8.85 | +0.80% |
Relative Strength Index (RSI) Oversold
Code | Company | Last | % Chg |
|---|---|---|---|
| SGP | Stockland | $4.28 | -0.70% |
| SPK | Spark New Zealand Ltd | $1.74 | 0.00% |
| HVN | Harvey Norman Holdings Ltd | $4.99 | +0.20% |
| SEK | Seek Ltd | $13.85 | -2.94% |
| EVO | Embark Early Education Ltd | $0.43 | 0.00% |
