
News | Market Wraps
Evening Wrap: ASX 200 down on gold rout, but not completely out as WDS, STO, AGL, ORG rise in flight to energy stocks
The S&P/ASX 200 closed 62.5 points lower, down 0.74%.

Mentioned
The S&P/ASX 200 closed 62.5 points lower, down 0.74%.
The ASX 200 fell to its lowest level since May as escalating tensions in the Middle East and surging energy prices deepened fears of a prolonged inflation shock. Markets remain fixated on the risk that higher oil prices will force central banks to keep tightening into a slowing growth backdrop.
In stock specific news:
Macmahon Holdings (MAH) (+4.8%) — climbed after securing a $250 million mining services contract with Wolfram Ltd.
Medibank Private (MPL) (+2.4%) — rose after losing a court bid to keep key documents confidential in its 2022 cybercrime case.
St Barbara (SBM) (-8.7%) — fell despite advancing approvals for its Simberi gold project ahead of a final investment decision.
Humm Group (HUM) (-5.5%) — declined as due diligence discussions continued with Credit Corp on a potential takeover.
ARN Media (A1N) (-4.6%) — dropped after legal action was launched over the cancellation of a major broadcast contract.
Be sure to click/scroll through for the usual reporting of the major sector and stock-specific moves, the broker responses to them, as well as all the key economic data in tonight's Evening Wrap.
Also, I have detailed technical analysis on the Nasdaq Composite and the S&P/ASX 200 in today's ChartWatch.
Let's dive in!
Today in Review
Mon 23 Mar 26, 5:13pm (AEST)
Name | Value | % Chg |
|---|---|---|
Major Indices | ||
| ASX 200 | 8,365.9 | -0.74% |
| All Ords | 8,552.6 | -0.88% |
| Small Ords | 3,230.7 | -1.79% |
| All Tech | 2,601.3 | -0.06% |
| Emerging Companies | 2,747.2 | -4.46% |
Currency | ||
| AUD/USD | 0.6964 | -0.83% |
US Futures | ||
| S&P 500 | 6,523.75 | -0.54% |
| Dow Jones | 45,699.0 | -0.42% |
| Nasdaq | 23,946.0 | -0.65% |
Name | Value | % Chg |
|---|---|---|
Sector | ||
| Utilities | 10,196.4 | +1.47% |
| Energy | 11,284.5 | +1.24% |
| Consumer Discretionary | 3,381.7 | +1.10% |
| Health Care | 27,574.6 | +0.16% |
| Communication Services | 1,690.9 | +0.13% |
| Consumer Staples | 12,493.3 | -0.04% |
| Financials | 9,492.8 | -0.58% |
| Industrials | 7,742.8 | -0.80% |
| Information Technology | 1,624.2 | -0.92% |
| Real Estate | 3,256.5 | -1.20% |
| Materials | 20,026.7 | -2.41% |
Markets
%20intraday%20chart_23%20Mar.png)
ASX 200 Session Chart
The S&P/ASX 200 (XJO) finished 62.5 points lower at 8,365.9, 1.3% from its session low and 0.7% from its high. In the broader-based S&P/ASX 300 (XKO) advancers lagged decliners by a disappointing 107 to 178.
Utilities (XUJ) (+1.5%) led gains as a pseudo-energy play in a market increasingly driven by oil supply risk. Regardless of petrol prices, interest rates, or the economic cycle — consumers must keep the lights on. AGL Energy (AGL) (+2.0%) and Origin Energy (ORG) (+1.6%) were strong, while APA Group (APA) (+1.1%) also advanced.
Energy (XEJ) (+1.2%) remained a core long as the Middle East conflict continued to threaten global oil flows. The market is increasingly pricing in the risk that supply chains will be disrupted for longer. Woodside Energy Group (WDS) (+2.2%) and Santos (STO) (+1.0%) pushed higher.
Consumer Discretionary (XDJ) (+1.1%) rebounded despite the macro headwinds, more likely a case of short covering after months of heavy selling. Eagers Automotive (APE) (+6.1%) surged on expectations higher fuel costs could accelerate EV demand, while Light & Wonder (LNW) (+3.4%) and Aristocrat Leisure (ALL) (+2.6%) gained as gambling is increasingly viewed as defensive during an economic downturn.
Gold Sub-Index (XGD) (-7.3%) was smashed again as soaring market interest rates and inflation expectations continue to erode the appeal of non-yielding assets like precious metals. The flight-to-safety trade is now unwinding in a classic “buy rumour, sell fact” move. Capricorn Metals (CMM) (-8.4%) and Newmont Corp. (NEM) (-7.5%) led the falls, while Evolution Mining (EVN) (-7.3%) and Northern Star Resources (NST) (-7.0%) were also heavily sold.
Resources (XJR) (-1.8%) weakened as the broader commodity complex struggled under the weight of rising energy costs and slowing global growth expectations. Dr. Copper fell sharply Friday, reinforcing the negative sentiment. Sandfire Resources (SFR) (-5.6%) and South32 (S32) (-3.3%) were among the worst performers.
In commodities, gold plunged in Asian trade, falling 6.3% to US$4284/oz, while silver dropped 8.8% to US$63.55/oz as rising oil prices and inflation expectations pushed real yields higher.
Copper also declined in Asian trade, falling another 2.0% to US$5.27/lb, reflecting growing concerns over global growth as energy costs surge.
Iron ore eased 0.2% in Singapore trade to US$108.05/t, though it remains near 10-month highs. That backdrop offered little support to bulk miners, with Rio Tinto (RIO) (-1.7%) and Mineral Resources (MIN) (-2.1%) both lower.
Lithium prices fell in China trade, with GFEX lithium carbonate futures down 3.8% to 142,000 CNY/t, while rare earths bucked the commodities trend with NdPr up 2.9% to 722,500 CNY/t. The latter did not aid critical minerals stocks like Lynas Rare Earths (LYC) (-3.0%).
Today's best blue chip gainers
Company | Last Price | Change $ | Change % | 1mo % | 1yr % |
|---|---|---|---|---|---|
Eagers Automotive (APE) | $21.42 | +$1.23 | +6.1% | -16.2% | +43.2% |
Life360 (360) | $18.81 | +$0.73 | +4.0% | -21.1% | -11.6% |
Steadfast (SDF) | $4.24 | +$0.15 | +3.7% | -5.4% | -28.5% |
Technology One (TNE) | $27.68 | +$0.9 | +3.4% | +11.8% | -2.4% |
Light & Wonder (LNW) | $114.62 | +$3.72 | +3.4% | -15.9% | -30.3% |
Aristocrat Leisure (ALL) | $46.43 | +$1.16 | +2.6% | -3.3% | -29.3% |
Insurance Australia (IAG) | $7.44 | +$0.18 | +2.5% | +5.1% | -1.6% |
AMP (AMP) | $1.260 | +$0.03 | +2.4% | -7.4% | -0.4% |
Block, (XYZ) | $84.85 | +$1.99 | +2.4% | +14.7% | -12.6% |
Medibank Private (MPL) | $4.31 | +$0.1 | +2.4% | -3.6% | -1.4% |
Woodside Energy (WDS) | $34.79 | +$0.75 | +2.2% | +26.8% | +51.9% |
Computershare (CPU) | $28.26 | +$0.59 | +2.1% | -10.2% | -30.5% |
JB HI-FI (JBH) | $73.18 | +$1.48 | +2.1% | -13.7% | -19.4% |
Amcor (AMC) | $55.24 | +$1.11 | +2.1% | -22.0% | -28.2% |
Pinnacle Investment (PNI) | $13.02 | +$0.26 | +2.0% | -21.8% | -30.0% |
Suncorp (SUN) | $16.12 | +$0.31 | +2.0% | +3.9% | -14.5% |
AGL Energy (AGL) | $9.41 | +$0.18 | +2.0% | -11.2% | -11.8% |
F&P Healthcare (FPH) | $30.55 | +$0.55 | +1.8% | -3.5% | +2.8% |
The Lottery Corp. (TLC) | $5.39 | +$0.09 | +1.7% | -3.4% | +12.1% |
Seek (SEK) | $14.67 | +$0.23 | +1.6% | -9.8% | -36.4% |
Today's worst blue chip losers
Company | Last Price | Change $ | Change % | 1mo % | 1yr % |
|---|---|---|---|---|---|
Capricorn Metals (CMM) | $9.41 | -$0.86 | -8.4% | -29.2% | +15.6% |
Newmont (NEM) | $131.84 | -$10.62 | -7.5% | -21.3% | +75.5% |
Evolution Mining (EVN) | $11.50 | -$0.91 | -7.3% | -23.6% | +67.6% |
Northern Star Resources (NST) | $17.21 | -$1.29 | -7.0% | -39.3% | -5.5% |
Sandfire Resources (SFR) | $14.72 | -$0.88 | -5.6% | -21.9% | +28.2% |
Perseus Mining (PRU) | $4.56 | -$0.25 | -5.2% | -22.3% | +43.4% |
Ramelius Resources (RMS) | $3.31 | -$0.18 | -5.2% | -26.6% | +50.5% |
Wisetech Global (WTC) | $40.69 | -$2.15 | -5.0% | -13.6% | -51.8% |
Genesis Minerals (GMD) | $5.35 | -$0.28 | -5.0% | -22.1% | +46.6% |
Sigma Healthcare (SIG) | $2.67 | -$0.11 | -4.0% | -9.2% | -7.0% |
South32 (S32) | $3.85 | -$0.13 | -3.3% | -12.3% | +9.1% |
Nextdc (NXT) | $12.47 | -$0.39 | -3.0% | -10.4% | -4.4% |
Lynas Rare Earths (LYC) | $18.95 | -$0.59 | -3.0% | +20.9% | +154.0% |
ALS (ALQ) | $19.28 | -$0.58 | -2.9% | -21.5% | +25.5% |
Dyno Nobel (DNL) | $2.91 | -$0.08 | -2.7% | -12.6% | +7.0% |
Orica (ORI) | $18.93 | -$0.49 | -2.5% | -23.5% | +8.3% |
Qantas Airways (QAN) | $8.15 | -$0.19 | -2.3% | -23.2% | -8.8% |
Mineral Resources (MIN) | $50.62 | -$1.07 | -2.1% | -1.2% | +122.4% |
Scentre (SCG) | $3.41 | -$0.07 | -2.0% | -10.5% | +3.0% |
ChartWatch
Nasdaq Composite Index
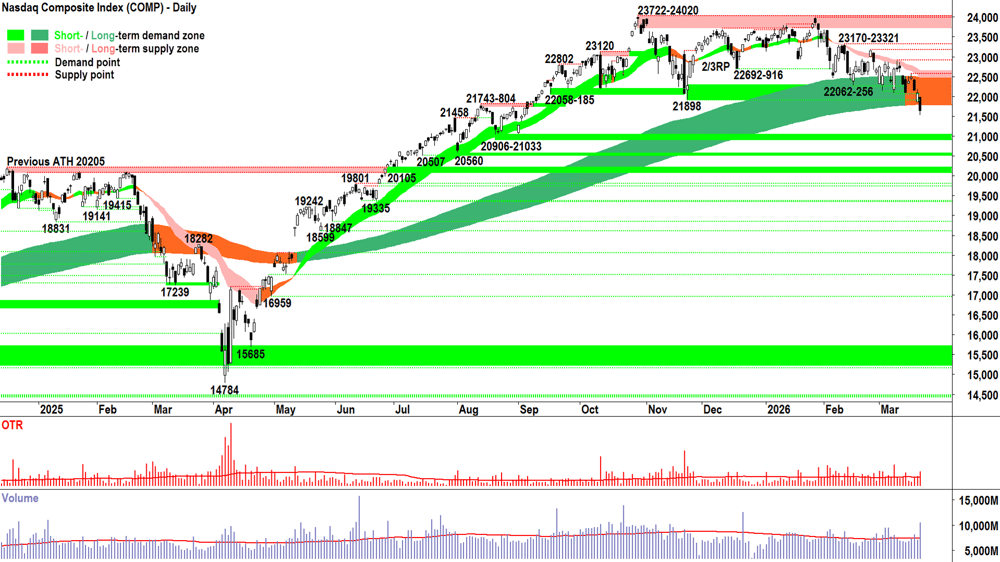
Analysis
If you are faced with the prospect of going from FRP to 1/3RP — after a big market decline has already occurred — let’s face it: most investors aren’t going to pull the trigger.
I can’t get out now… it’s too late… 😱
I can’t get out now… I really wanted to get out at the top… 😱
I can’t get out now… what if this is the low and it bounces… 😱
I can't get out now… I’ll look / feel like an idiot for letting it get this bad before acting… 😱
To be fair, “most investors” wouldn’t have a clue about the concept of portfolio risk position (“RP”) and why it’s so important to manage it based on market conditions.
Most investors simply go along for the ride 🎢💥
My point is… the later you leave the decision to act on managing your portfolio risk — the more difficult it gets.
Until you can’t act at all… then you resign yourself to being “stuck”. Stuck until it all blows over… because some day… the market will recover… “I just have to hold on long enough”!!! (Hopefully you're not retiring soon, or aren't already retired!).
Both the feeling of being stuck, and the ensuing result, are caused by ex-post regret. That’s the “doh” factor of not doing what you know you should have done sooner. 🤦
This is exactly why my portfolio management model moves in measured steps based on explicit technical analysis triggers.
Explicit technical analysis triggers = THERE CAN BE NO CONFUSION THAT RP MUST BE MANAGED (i.e., +R, =R, and -R events are clearly defined).
Measured steps = NEVER ALL IN AT ONCE, NEVER ALL OUT AT OUNCE — AND NEVER ALL OUT.
That last one is the real kicker — because ex-post regret is a portfolio killer. Yes, my model carefully manages portfolio risk, but it also carefully manages the investor’s mindset through the process of moving through the 1/3RP to FRP to 1/3RP cycle.
When one doesn’t know how to act — one won’t. So, I act decisively based solely on trend following technical analysis — AND NEVER ON NARRATIVES ABOUT GLOBAL EVENTS. 🧐
When one acts too slowly, it’s difficult to catch up. But, when one acts too quickly, it’s difficult to reverse course.
So, I don’t sell everything at the first sign of trouble — I step out as the trend weakens, then turns. This way, it’s easier to pull the trigger on each next action because it’s only an incremental monetary and psychological step.
When one's all out — fear and uncertainty will prevent one from getting back in when it’s time to do so. We all know that feeling, we don’t want to miss the boat — but we don’t want to take another hammering…
This is why I ensure that I'M NEVER ALL OUT. Hey, it’s not like I'm going all in — SO I DON’T SWEAT IT! I'm just going to add some risk (e.g., +1/3RP). If it’s not the bottom, so be it, I'm not going to lose my shirt and I have plan for managing my risk accordingly.
If it is the bottom, then hooley dooley, I've added some risk ✅. No I didn't get the whole lot in at the bottom (but who did!?), and I can always add more if the trend continues to improve.
Anyways, whatever you think about my portfolio management model, hopefully you agree it’s better than the usual “Ostrich Technique” most investors use:
Ostrich Technique (n.): An investment “strategy” popular during periods of heightened volatility, whereby one buries their head firmly in the sand — eschewing all market data, central bank rhetoric, and geopolitical developments — in the hope that adverse price action simply ceases to exist. While this blissful ignorance may offer temporary psychological comfort, it leaves the investor’s more delicate financial anatomy fully exposed to the elements of uncertainty!
View
The close below the long term uptrend ribbon requires me to cut my portfolio risk position on US stocks to 1/3RP from 1/2RP (RP = Risk Position — it reflects my personal allowable capital allocation limit for my investments in US stocks. So 1/2RP is 50%, 2/3RP is 67% and FRP is 100% 🪣).
Key levels
With the Comp below the previous 21851-21898 critical zone of demand, as well as the dynamic demand of the long term trend ribbon, the long term uptrend is officially over. The long term downtrend will be confirmed when the long term trend ribbon begins to act as a zone of dynamic supply = ⚠️🚨.
The next demand zone is 20906-21033. We will watch the price action and candles closely there for signs excess demand is indeed manifesting itself.
The short term downtrend ribbon (presently 22475-22649) is the nearest critical zone of point supply, and 22569-22907-23170-23321 aren't far beyond that.
S&P/ASX 200 (XJO)
%20chart_23%20Mar.png)
Analysis
The headlines today will shout the ASX 200's (aka, the Old Tin Pot’s) losses, but they'll very likely fail to note its successes:
Didn’t close below 8284 ✅
Didn’t close with a long black bodied candle, close very near / at session low ✅
Did close with a decent downward pointing shadow = modest motivation among demand-side to buy the dip ✅
Did occur on above-average volume (uncommon for Mondays), which means there was a decent whack of interest in buying the dip (to accompany the decent motivation demonstrated in price), potentially also a few shorts / panic sellers now regretting their at-the-open eagerness / panic ✅
But, there was one disappointment (do we call it a failure given that downward pointing shadow? 🤔)
Did close below the critical 8383-8457 zone of demand = ⚠️
The debate about how good vs not so bad today’s candle was falls into the category of: “largely moot”.
Because outside of this one candle, the broader technical picture for the OTP is:
ST trend ribbon ⬇️ + price is below the ST trend ribbon + short term trend ribbon is acting as a zone of dynamic supply ⚠️
LT trend ribbon ➡️ price is below the ST trend ribbon + short term trend ribbon is acting as a zone of dynamic supply ⚠️
Price action = falling peaks and falling troughs = supply reinforcement and demand removal = sell the rally + 🚫FOMO + 🚫HOFU + 🚫BTD ⚠️
Candles are predominantly supply-side in nature (i.e., black-bodied and or upward pointing shadows = pervasive programmed sell orders dominant + sell the rally + 🚫FOMO + 🚫HOFU + 🚫BTD ⚠️
That’s a lot of ⚠️ and 🚫 emojis next to the critical factors associated with a bull market =
Fear Of Missing Out
Holding On For Upside
Buy The Dip
All of those ⚠️ + 🚫 = 1/3RP (i.e., no change to my portfolio risk position today!)
View
1/3RP = My OTP risk bucket limit 🪣 (i.e., my personal allowable capital allocation limit for my investments in Australian stocks is 33%).
Key levels
With 8383-8457 consumed, 8284 is the closest zone of demand (static). The ASX 200 must at least close back above the short- and long term uptrend ribbons (presently 8709-8768. and 8666-8758 respectively) to reclaim any semblance of demand-side control.
ChartWatch *LIVE* Webinar
ChartWatch *LIVE* Webinars – WEEKLY Wednesday's @ 12pm AEDT
Learn more about technical analysis and trend following through real case studies on ASX stocks. Australia's premier technical analyst, Carl Capolingua, shares his unique insights on stocks as requested by viewers. Ask about a company in your portfolio or anything related to trading and investing and get Carl's expert opinion.
Places are limited so >REGISTER NOW!<
Economy
Today
There weren't any major economic data releases in our time zone today
Later this week
Tuesday
09:00 AUS March Flash Purchasing Managers Index (PMI)
Manufacturing: Forecast n/a vs 51.0 in February
Manufacturing: Forecast n/a vs 52.8 in February
Wednesday
00:45 USA March Flash Purchasing Managers Index (PMI)
Manufacturing: Forecast n/a vs 51.6 in February
Manufacturing: Forecast n/a vs 51.7 in February
11:30 AUS February Consumer Price Index (CPI)
Headline: +3.8% p.a. forecast vs +3.8% p.a. in January
Trimmed Mean: Forecase n/a +0.3% m/m in January
Thursday
No major economic news scheduled for this day
Friday
No major economic news scheduled for this day
Saturday
No major economic news scheduled for this day
Latest News
Interesting Movers
Trading higher
+8.8% Dateline Resources (DTR) – No news, rise is consistent with prevailing short and long term uptrends, a regular in ChartWatch ASX Scans Uptrends list 🔎📈
+6.8% G8 Education (GEM) – No news, general strength across the broader Consumer Discretionary sector today.
+6.1% Eagers Automotive (APE) – No news, general strength across the broader Consumer Discretionary sector today.
+5.7% Premier Investments (PMV) – No news, general strength across the broader Consumer Discretionary sector today.
+5.2% BetaShares Crude Oil ETF (OOO) – No news (long crude oil ETF), general strength across the broader Energy sector today.
+4.6% Karoon Energy (KAR) – New CFO and CTOO appointed, general strength across the broader Energy sector today, rise is consistent with prevailing short and long term uptrends, a recent regular in ChartWatch ASX Scans Uptrends list 🔎📈
+4.4% BetaShares US EQY Strong Bear ETF (BBUS) – No news (short US stocks ETF).
+3.9% Yancoal Australia (YAL) – No news, general strength across the broader Energy sector today, rise is consistent with prevailing short and long term uptrends, a regular in ChartWatch ASX Scans Uptrends list 🔎📈
+2.2% Woodside Energy (WDS) – No news, general strength across the broader Energy sector today, rise is consistent with prevailing short and long term uptrends, a regular in ChartWatch ASX Scans Uptrends list 🔎📈
Trading lower
-18.0% Turaco Gold (TCG) – No news, general weakness across the broader Precious Metals sector today.
-16.3% Kingsgate Consolidated (KCN) – No news, general weakness across the broader Precious Metals sector today.
-15.6% Southern Cross Gold (SX2) – No news, general weakness across the broader Precious Metals sector today.
-14.4% Catalyst Metals (CYL) – No news, general weakness across the broader Precious Metals sector today, fall is consistent with prevailing short term downtrend and long term trend is transitioning from up to down, a recent regular in ChartWatch ASX Scans Downtrends list 🔎📉
-14.4% Benz Mining (BNZ) – No news, general weakness across the broader Precious Metals sector today.
-14.0% Alkane Resources (ALK) – No news, general weakness across the broader Precious Metals sector today.
-12.5% Unico Silver (USL) – No news, general weakness across the broader Precious Metals sector today.
-12.2% Lotus Resources (LOT) – No news, fall is consistent with prevailing short and long term downtrends, a regular in ChartWatch ASX Scans Downtrends list 🔎📉
-11.8% Black Cat Syndicate (BC8) – Notification of Release of Securities from Voluntary Escrow, general weakness across the broader Precious Metals sector today, fall is consistent with prevailing short term downtrend and long term trend is transitioning from up to down, a recent regular in ChartWatch ASX Scans Downtrends list 🔎📉
-11.8% Brightstar Resources (BTR) – No news, general weakness across the broader Precious Metals sector today, fall is consistent with prevailing short and long term downtrends, a recent regular in ChartWatch ASX Scans Downtrends list 🔎📉
-11.8% Ausgold (AUC) – No news, general weakness across the broader Precious Metals sector today.
-11.5% Forrestania Resources (FRS) – No news, general weakness across the broader Precious Metals sector today.
-11.2% Antipa Minerals (AZY) – No news, general weakness across the broader Precious Metals sector today.
-11.0% Ora Banda Mining (OBM) – No news, general weakness across the broader Precious Metals sector today.
-10.5% Aeris Resources (AIS) – No news, general weakness across the broader Resources sector today.
-10.1% BetaShares Global Gold Miners ETF (MNRS) – No news (long ASX mining stocks ETF), general weakness across the broader Resources sector today.
-10.1% Lindian Resources (LIN) – Tipume Accommodation Camp Operational.
-9.8% Greatland Resources (GGP) – No news, general weakness across the broader Precious Metals sector today, fall is consistent with prevailing short term downtrend and long term trend is transitioning from up to down, a recent regular in ChartWatch ASX Scans Downtrends list 🔎📉
Broker Moves
AMP (AMP)
Retained at buy at Ord Minnett; Price Target: $1.65
ANZ Group Holdings (ANZ)
Retained at neutral at Macquarie; Price Target: $35.50 from $37.00
ASX (ASX)
Retained at hold at Ord Minnett; Price Target: $58.60
Aurum Resource (AUE)
Retained at speculative buy at Canaccord Genuity; Price Target: $1.55
Breville Group (BRG)
Retained at outperform at Macquarie; Price Target: $37.10 from $38.50
Commonwealth Bank of Australia (CBA)
Retained at underperform at Macquarie; Price Target: $120.00 from $124.00
Challenger (CGF)
Retained at buy at Ord Minnett; Price Target: $9.85
COG Financial Services (COG)
Retained at buy at Bell Potter; Price Target: $2.30
HUB24 (HUB)
Upgraded to outperform from neutral at Macquarie; Price Target: $92.25 from $106.10
Insignia Financial (IFL)
Retained at hold at Ord Minnett; Price Target: $4.80
JB Hi-Fi (JBH)
Retained at buy at Bell Potter; Price Target: $90.00 from $119.00
MA Financial Group (MAF)
Initiated at overweight at Jarden; Price Target: $9.45
Magellan Financial Group (MFG)
Downgraded to underperform from neutral at Macquarie; Price Target: $8.55 from $8.65
Medibank Private (MPL)
Retained at accumulate at Ord Minnett; Price Target: $5.10
National Australia Bank (NAB)
Downgraded to neutral from outperform at Macquarie; Price Target: $45.50 from $47.00
Nick Scali (NCK)
Retained at neutral at Citi; Price Target: $19.20
NIB Holdings (NHF)
Retained at buy at Ord Minnett; Price Target: $8.25
Netwealth Group (NWL)
Retained at outperform at Macquarie; Price Target: $27.55 from $33.70
Premier Investments (PMV)
Retained at buy at Bell Potter; Price Target: $18.00 from $20.00
Retained at neutral at Citi; Price Target: $13.00 from $16.70
Upgraded to overweight from neutral at Jarden; Price Target: $15.50 from $16.90
Retained at outperform at Macquarie; Price Target: $16.90 from $16.20
Retained at overweight at Morgan Stanley; Price Target: $16.90 from $19.20
Retained at sector perform at RBC Capital Markets; Price Target: $12.20 from $13.90
Perpetual (PPT)
Retained at outperform at Macquarie; Price Target: $20.05 from $24.60
QBE Insurance Group (QBE)
Retained at buy at Ord Minnett; Price Target: $26.00
Steadfast Group (SDF)
Retained at hold at Ord Minnett; Price Target: $5.70
Suncorp Group (SUN)
Retained at hold at Ord Minnett; Price Target: $18.00
Turaco Gold (TCG)
Retained at buy at Morgans; Price Target: $2.19
Westpac Banking Corporation (WBC)
Retained at neutral at Citi; Price Target: $39.00
Retained at underperform at Macquarie; Price Target: $33.50 from $35.00
Scans
Top Gainers
Code | Company | Last | % Chg |
|---|---|---|---|
| KLI | Killi Resources Ltd | $0.115 | +121.15% |
| ATX | Amplia Therapeutics Ltd | $0.235 | +108.89% |
| AJL | AJ Lucas Group Ltd | $0.017 | +41.67% |
| EGY | Energy Technologies Ltd | $0.024 | +41.18% |
| DWG | Dataworks Group Ltd | $0.175 | +34.62% |
Top Fallers
Code | Company | Last | % Chg |
|---|---|---|---|
| C1X | Cosmos Exploration Ltd | $0.18 | -26.53% |
| RBR | RBR Group Ltd | $0.015 | -25.00% |
| IOD | Iodm Ltd | $0.125 | -24.24% |
| NGX | NGX Ltd | $0.08 | -23.81% |
| BMR | Ballymore Resources Ltd | $0.15 | -23.08% |
52 Week Highs
Code | Company | Last | % Chg |
|---|---|---|---|
| KLI | Killi Resources Ltd | $0.115 | +121.15% |
| AJL | AJ Lucas Group Ltd | $0.017 | +41.67% |
| TER | Terracom Ltd | $0.115 | +4.55% |
| YAL | Yancoal Australia Ltd | $8.63 | +3.85% |
| BBAB | Betashares Geared Short Aus GOV Bond Complex ETF | $22.17 | +3.12% |
52 Week Lows
Code | Company | Last | % Chg |
|---|---|---|---|
| RBR | RBR Group Ltd | $0.015 | -25.00% |
| NGX | NGX Ltd | $0.08 | -23.81% |
| IAM | Income Asset Management Group Ltd | $0.018 | -18.18% |
| EMC | Everest Metals Corporation Ltd | $0.10 | -16.67% |
| MHM | Mount Hope Mining Ltd | $0.125 | -16.67% |
Near Highs
Code | Company | Last | % Chg |
|---|---|---|---|
| TLS | Telstra Group Ltd | $5.30 | +0.19% |
| FUEL | Betashares Global Energy Comp Currency Hedged ETF | $8.76 | +0.23% |
| APA | APA Group | $9.57 | +1.06% |
| GROW | Schroder Real Return Active ETF | $3.96 | -1.00% |
| CVW | Clearview Wealth Ltd | $0.63 | -0.40% |
Relative Strength Index (RSI) Oversold
Code | Company | Last | % Chg |
|---|---|---|---|
| MGX | MGX Resources Ltd | $0.355 | -4.05% |
| WCE | West Coast Silver Ltd | $0.13 | -13.33% |
| NVA | Nova Minerals Ltd | $0.585 | -11.36% |
| HVN | Harvey Norman Holdings Ltd | $5.02 | -0.59% |
| GLDN | iShares Physical Gold ETF | $49.88 | -5.71% |
