News | Market Wraps
Evening Wrap: ASX 200's golden run continues, lithium price goes ballistic +16% in two days
The S&P/ASX 200 closed 49 points higher, up 0.56%.

Mentioned
The S&P/ASX 200 closed 49 points higher, up 0.56%.
It seems gold and silver stocks are on an unstoppable roll at the moment... with geopolitical (and a bit of US Federal Reserve bullying) sending prices of both shiny metals to fresh records overnight. But they weren't the only commodity to see fresh gains... as the price of lithium logged its second massive daily increase — the key energy transition metal is now up nearly 17% over the last two trading sessions.
Be sure to click/scroll through for the usual reporting of the major sector and stock-specific moves, the broker responses to them, as well as all the key economic data in tonight's Evening Wrap.
Also, I have detailed technical analysis on the Nasdaq Composite and the S&P/ASX 200 in today's ChartWatch.
Let's dive in!
Today in Review
Tue 13 Jan 26, 5:35pm (AEST)
Name | Value | % Chg |
|---|---|---|
Major Indices | ||
| ASX 200 | 8,808.5 | +0.56% |
| All Ords | 9,138.5 | +0.50% |
| Small Ords | 3,926.7 | +0.35% |
| All Tech | 3,382.0 | -0.70% |
| Emerging Companies | 3,336.7 | +0.68% |
Currency | ||
| AUD/USD | 0.6707 | -0.04% |
US Futures | ||
| S&P 500 | 7,010.75 | -0.08% |
| Dow Jones | 49,773.0 | -0.07% |
| Nasdaq | 25,914.75 | -0.16% |
Name | Value | % Chg |
|---|---|---|
Sector | ||
| Materials | 22,456.2 | +2.02% |
| Financials | 9,207.9 | +0.70% |
| Real Estate | 3,924.0 | +0.62% |
| Industrials | 8,525.4 | +0.10% |
| Communication Services | 1,735.2 | -0.25% |
| Health Care | 33,995.4 | -0.42% |
| Information Technology | 2,137.0 | -0.73% |
| Utilities | 9,267.6 | -0.77% |
| Consumer Discretionary | 4,005.9 | -0.81% |
| Consumer Staples | 11,692.3 | -0.85% |
| Energy | 8,452.0 | -1.16% |
Markets
%20intraday%20chart_13%20Jan.png)
ASX 200 Session Chart
The S&P/ASX 200 (XJO) finished 49.1 points higher a 8,808.5, 0.48% from its session low and 0.30% from its high. In the broader-based S&P/ASX 300 (XKO) advancers beat decliners by a healthy 140 to 129.
Fund flows: Risk appetite is growing 😋
Back to a more “normal” Resources (i.e., lower P/E / cyclicals / short duration) = “Winners” (High P/E / long duration = “Losers” vs Big Banks = “Swing factor” dynamic:
Gold Sub-Index (XGD) (+2.2%) = Winner |
|---|
Resources (XJR) (+1.7%) = Winner |
Financials (XFJ) (+0.7%) = Swinger |
Communication Services (XTJ) (-0.2%) = Loser |
Health Care (XHJ) (-0.4%) = Loser |
Information Technology (XIJ) (-0.7%) = Loser |
Utilities (XUJ) (-0.8%) |
Consumer Discretionary (XDJ) (-0.8%) = Loser |
Consumer Staples (XSJ) (-0.8%) |
Energy (XEJ) (-1.2%) |
Gold is just gold — it's in its own league, subset of Resources or not... Energy, well that's also running its own race at the moment based on geopolitical volatility (for me: just noise in a sector that's generally in decay).
The key factor in today's index gain is those banks — any day you get banks and resources pushing in the same upward direction — it's going to be an up-day.
Defensives like Utilities and Consumer Staples? Probably a bit of: no real need to play defence with risk appetite rising across so many international asset markets.
And that last point is the key: We're increasingly seeing coordinated growth in risk-asset pricing across the globe (despite the aforementioned "geopolitical volatility"). There's plenty of cash on the sidelines... it's been biding its time waiting for "stuff to settle down". Yet, I think investors are growing (weirdly) more comfortable (or desensitised) to "stuff"... and the cash as to go somewhere... 💰💰💰
I think we're setting up for a little push here... let's hope / trust the Old Tin Pot will oblige! 😉
Stock Specific: Lithium is going ballistic! 💥
No doubt you're following along lithium's heroics at home... but note that I'll usually post if something interesting is happening in China during the day on my X account. Today, I set long-suffering ChartWatch readers a challenge to test their understanding of the ChartWatch technical analysis model: open the image in Paint and select/drag/drop the pointer/red arrow to the spot on the chart you think the model official proclaims a bull market. (Hint: this one was indeed a tricky one!)

Today's best blue chip gainers
Company | Last Price | Change $ | Change % | 1mo % | 1yr % |
|---|---|---|---|---|---|
Northern Star Resources (NST) | $26.35 | +$0.92 | +3.6% | -2.3% | +59.4% |
Mineral Resources (MIN) | $60.50 | +$1.92 | +3.3% | +17.2% | +74.7% |
Capricorn Metals (CMM) | $14.45 | +$0.41 | +2.9% | +7.8% | +115.7% |
IGO (IGO) | $9.15 | +$0.24 | +2.7% | +28.9% | +83.4% |
Resmed Inc (RMD) | $38.50 | +$0.87 | +2.3% | -0.7% | +1.8% |
BHP Group (BHP) | $47.58 | +$1.07 | +2.3% | +6.8% | +21.2% |
Rio Tinto (RIO) | $145.53 | +$3.1 | +2.2% | +5.8% | +25.0% |
Evolution Mining (EVN) | $13.17 | +$0.26 | +2.0% | +8.4% | +157.7% |
Lynas Rare Earths (LYC) | $15.06 | +$0.28 | +1.9% | +17.9% | +117.0% |
PLS Group (PLS) | $4.86 | +$0.09 | +1.9% | +15.7% | +117.0% |
Sandfire Resources (SFR) | $19.11 | +$0.35 | +1.9% | +15.4% | +100.9% |
National Australia Bank (NAB) | $42.39 | +$0.77 | +1.9% | +3.5% | +10.5% |
James Hardie Industries (JHX) | $34.60 | +$0.62 | +1.8% | +21.5% | -31.3% |
ANZ Group Holdings (ANZ) | $36.48 | +$0.59 | +1.6% | +3.5% | +24.2% |
South32 (S32) | $3.96 | +$0.06 | +1.5% | +15.1% | +17.2% |
Perseus Mining (PRU) | $5.94 | +$0.09 | +1.5% | +11.9% | +125.9% |
Ramelius Resources (RMS) | $4.45 | +$0.06 | +1.4% | +24.7% | +107.0% |
Fisher & Paykel Healthcare (FPH) | $33.40 | +$0.4 | +1.2% | +2.0% | -2.7% |
Scentre Group (SCG) | $4.22 | +$0.05 | +1.2% | +5.5% | +18.9% |
Westpac Banking Corp. (WBC) | $38.50 | +$0.42 | +1.1% | +2.0% | +16.1% |
Today's worst blue chip losers
Company | Last Price | Change $ | Change % | 1mo % | 1yr % |
|---|---|---|---|---|---|
Ampol (ALD) | $29.65 | -$1.5 | -4.8% | -7.1% | +1.3% |
Life360 (360) | $30.67 | -$0.97 | -3.1% | -14.1% | +30.5% |
JB HI-FI (JBH) | $90.51 | -$2.75 | -2.9% | -0.3% | -5.3% |
Endeavour Group (EDV) | $3.70 | -$0.11 | -2.9% | +1.9% | -10.8% |
Eagers Automotive (APE) | $26.41 | -$0.77 | -2.8% | +2.7% | +117.9% |
AMP (AMP) | $1.800 | -$0.045 | -2.4% | 0% | +11.1% |
Nextdc (NXT) | $12.48 | -$0.3 | -2.3% | -8.3% | -18.8% |
Block (XYZ) | $104.29 | -$2.26 | -2.1% | +13.1% | -25.9% |
Hub24 (HUB) | $95.44 | -$2.01 | -2.1% | -2.4% | +30.8% |
Telix Pharmaceuticals (TLX) | $11.00 | -$0.2 | -1.8% | -21.4% | -54.6% |
Coles Group (COL) | $21.15 | -$0.38 | -1.8% | -3.3% | +11.4% |
Pro Medicus (PME) | $209.66 | -$3.7 | -1.7% | -11.7% | -22.2% |
Woodside Energy Group (WDS) | $23.31 | -$0.41 | -1.7% | -5.6% | -8.2% |
Netwealth Group (NWL) | $25.15 | -$0.4 | -1.6% | -5.6% | -17.3% |
Cleanaway Waste Management (CWY) | $2.59 | -$0.04 | -1.5% | -0.8% | -5.8% |
AGL Energy (AGL) | $8.88 | -$0.13 | -1.4% | -4.1% | -20.6% |
Qube Holdings (QUB) | $4.81 | -$0.06 | -1.2% | +2.6% | +20.0% |
Light & Wonder (LNW) | $180.31 | -$2.19 | -1.2% | +18.2% | +31.2% |
Origin Energy (ORG) | $11.05 | -$0.13 | -1.2% | -3.8% | -0.7% |
CSL (CSL) | $173.32 | -$1.78 | -1.0% | -4.6% | -39.7% |
ChartWatch
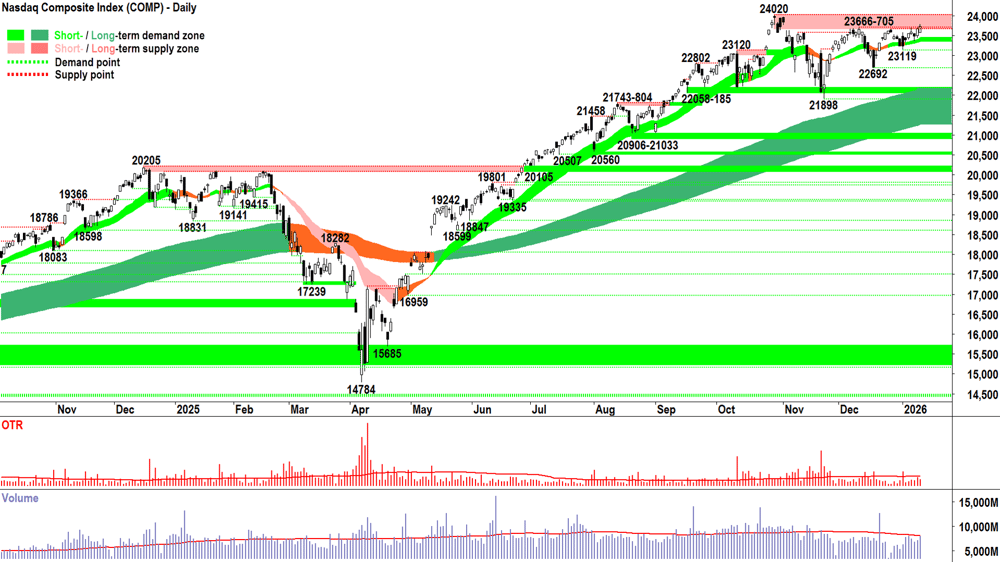
Nasdaq Composite Index
Analysis
Can I be so arrogant to say: another bloody obvious candle on the Comp!? 🧐
Which is good, right? The Comp is doing what we as disciplined disciples of demand and supply would ordinarily expect from the trends, price action, candles and volume it’s delivering us. ✅
The demand-side looks in growing control here — but clearly — 23666-705 remains a stubborn zone of latent supply.
Check out Monday’s volume bar — average, sure — but a little up on the previous two candles = interest from the demand-side is growing + supply removal is steadily occurring.
Both ✅’s for me.
Little has changed from yesterday’s update, where I said:
A powerful candle, long white-bodied and or with a long downward pointing shadow, closing at or very near its high — would smash the latent supply in 23666-705 and do two important things:
Give greater confidence to those on the supply-side that higher prices are imminent — and therefore to take advantage of these they must HOFU (Hold On For Upside)
Spark fear and terror among those with cash (i.e., “demand”) — making that cash look like a deadly burden in a rising market: "OMG…if I don’t beat the index (or at least track its performance) I won’t get my bonus this quarter!!!" 😱
Versus: If I see the opposite, supply-side candle — i.e., black / upward pointing shadow / close near low of the session = ⚠️🚨
View
No change: I remain comfortable at my 2/3RP portfolio risk limit 🪣 (RP = Risk Position — it reflects my personal allowable capital allocation limit for my investments in US stocks. So 1/2RP is 50%, 2/3RP is 67% and FRP is 100%).
Key levels
The trough at 23119 is the closest point of demand — a close below it would signal the demand-side is under pressure again — but I propose that it's not until a close below the next, lower point of demand at 22692 that we can assume they've lost control of the Comp's price. On a close below 21898 the short term trend is unequivocally down and the long term uptrend is likely under significant pressure = ⚠️. 23666-24020 is the nearest critical zone of supply — the Comp must close within this zone with a strong demand-side candle to confirm the demand-side is unequivocally back in control of the Comp's price.
S&P/ASX 200 (XJO)
%20chart_13%20Jan.png)
Analysis
You know how shouting at the TV while watching your favourite sporting team go round won’t make a lick of difference to the outcome? 🤔
Neither will shouting at your charts!!! 😉
Believe me — I’ve tried many times… like today… as I cheered the ASX 200, a.k.a. The Old Tin Pot higher.
Like the little engine that could… 🚂 it chugged, chugged, chugged higher today… and then… perhaps the big fund managers didn’t like what they had for lunch… the supply switch was flicked around 1:30pm and the OTP’s gain dwindled into the close.
Hands up if you’re surprised at the OTP’s inability to bottle it today (again… probably sounds like your favourite sporting team… snatching defeat from the jaws of victory! 🤣)?
Still, if we look at today’s candle, there’s still a decent whack of a body, there’s still a close above the 8806 point of supply (by a whisker), the short term trend ribbon has turned green — for the first time since 28-Oct (!!!), and we’re still pushing in the right general direction off the dynamic demand combo of the short term/long term uptrend ribbon bloc.
Can you look past that pesky upward pointing shadow? Do we concede that’s par for the OTP course and just “be happy with what we get”? 🤷
I’m not so sure: despite everything going for it at 1:30pm, the fact of the matter is that demand-side could not overwhelm what is clearly a still-motivated supply-side = ⚠️.
Oh, well… back to cheering the OTP onwards and upwards tomorrow (and maybe tomorrow it will work! 🤦)
View
I remain comfortable at 1/2RP 🪣 (i.e., my personal allowable capital allocation limit for my investments in Australian stocks is 50%).
Key levels
8547-8562 is the new closest zone of demand. A close below this zone would confirm the supply side is back in control of the ASX 200's price. In theory though, the short term and long term trend ribbons now begin to act as a zone of dynamic demand (presently 8572-8806). 8876 is the next key point of supply. A close above it would confirm the demand-side is in control of the price — but it would take a miracle in the "dud" sectors to make this happen!
ChartWatch *LIVE* Webinar
ChartWatch *LIVE* Webinars – WEEKLY Wednesday's @ 12pm AEDT
Learn more about technical analysis and trend following through real case studies on ASX stocks. Australia's premier technical analyst, Carl Capolingua, shares his unique insights on stocks as requested by viewers. Ask about a company in your portfolio or anything related to trading and investing and get Carl's expert opinion.
Places are limited so >REGISTER NOW!<
Economy
Today
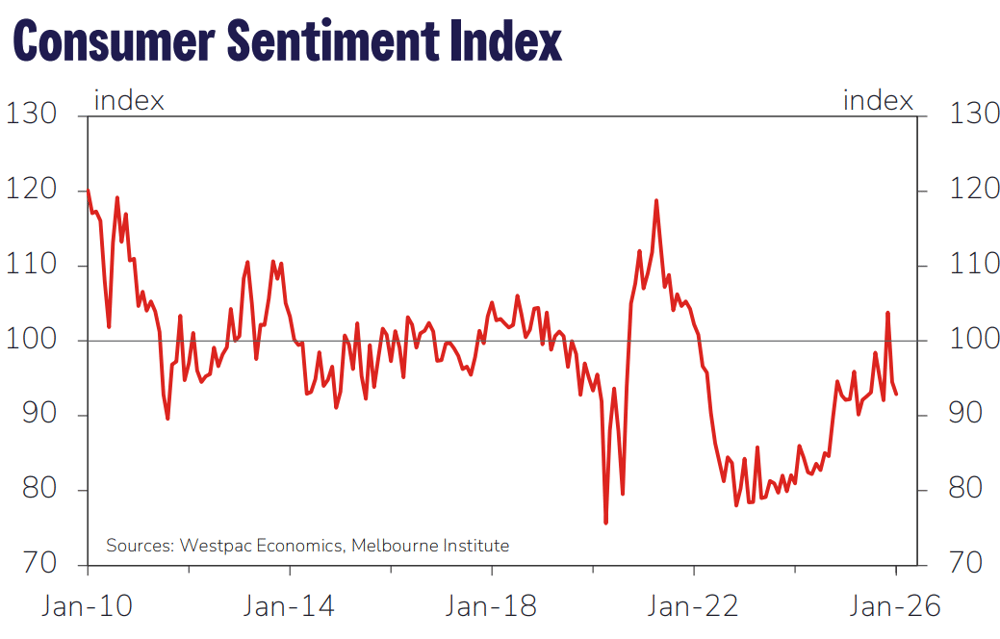
09:50 Westpac Consumer Sentiment m/m
Result: -1.7% actual vs -9% previous in December 👎
Notes:
The Future Finances sub-index rose to 97.8, while the Family Finances vs a year ago sub-index improved 2.3% to 82.7, a two-year high.
The Unemployment Expectations Index climbed 2.1% to 129.4, indicating more consumers expect joblessness to rise.
House price expectations dipped 1.4% to 167.5, still up 25% year-on-year and firmly bullish.
Commentary:
Westpac economists said Australian consumers entered the new year in a downbeat mood, moving further into pessimistic territory as interest rate expectations turned sharply higher. The main catalyst continues to be higher interest rate expectations in 2026.
Later this week
Wednesday
00:30 USA December Consumer Price Index (CPI) (+0.3% m/m forecast vs +0.2% m/m in November)
00:30 USA December Retail Sales (+0.4% m/m forecast vs 0.0% m/m in November)
Thursday
11:00 AUS MI Inflation Expectations (+4.7% p.a. previous)
Friday
00:30 January Empire State Manufacturing Index (+1.1 forecast vs -3.9 in December)
Saturday
01:15 USA December Industrial Production m/m (+0.2% m/m forecast vs +0.2% m/m previous)
Latest News
Interesting Movers
Trading higher
+21.6% New Murchison Gold (NMG) – Lydia Gold Prospect - Potential Addition to Production Line, general strength across the broader Precious Metals sector today, rise is consistent with prevailing short and long term uptrends, a regular in ChartWatch ASX Scans Uptrends list 🔎📈
+15.6% Locksley Resources (LKY) – No news, general strength across the broader Critical Minerals sector today.
+10.3% Electro Optic Systems Holdings (EOS) – No news, general strength across the broader Defence sector today, rise is consistent with prevailing short and long term uptrends, a regular in ChartWatch ASX Scans Uptrends list 🔎📈
+10.3% Elevra Lithium (ELV) – No news since 12-Jan Accelerated NAL Expansion, general strength across the broader Lithium sector today, rise is consistent with prevailing short and long term uptrends, a regular in ChartWatch ASX Scans Uptrends list 🔎📈
+8.1% Galan Lithium (GLN) – No news, general strength across the broader Lithium sector today, rise is consistent with prevailing short and long term uptrends, a regular in ChartWatch ASX Scans Uptrends list 🔎📈
Trading lower
-28.7% Findi (FND) – Market Update - Strategic Investment, fall is consistent with prevailing short and long term downtrends, a regular in ChartWatch ASX Scans Downtrends list 🔎📉
-8.6% GQG Partners (GQG) – FUM as at 31 December 2025, fall is consistent with prevailing long term downtrend 🔎📉
-8.1% Orezone Gold Corp. (ORE) – Becoming a substantial holder (Helikon Investments +6.9%).
-7.0% Catapult Sports (CAT) – No news, general weakness across the broader Information Technology sector today, fall is consistent with prevailing short and long term downtrends, a regular in ChartWatch ASX Scans Downtrends list 🔎📉
-6.3% Manuka Resources (MKR) – No news, pulled back in the wake of recent sharp rally.
-5.8% Viva Energy Group (VEA) – Ceasing to be a substantial holder (L1 Capital), general weakness across the broader Energy sector today, fall is consistent with prevailing short term downtrend and long term trend is transitioning from up to down, a recent regular in ChartWatch ASX Scans Downtrends list 🔎📉
Broker Moves
29Metals (29M)
Retained at sell at Canaccord Genuity; Price Target: $0.55 from $0.25
Downgraded to underperform from hold at Jefferies; Price Target: $0.45
The a2 Milk Company (A2M)
Retained at buy at Citi; Price Target: $10.40 from $10.45
Aristocrat Leisure (ALL)
Retained at overweight at Morgan Stanley; Price Target: $72.40
AMP (AMP)
Upgraded to buy from neutral at Citi; Price Target: $2.10
Retained at overweight at Morgan Stanley; Price Target: $2.10
ANZ Group Holdings (ANZ)
Retained at equal-weight at Morgan Stanley; Price Target: $36.00
BlueScope Steel (BSL)
Retained at equal-weight at Morgan Stanley; Price Target: $24.00
Brambles (BXB)
Upgraded to buy from neutral at Citi; Price Target: $26.75
Commonwealth Bank of Australia (CBA)
Retained at underweight at Morgan Stanley; Price Target: $143.20
Capricorn Metals (CMM)
Downgraded to neutral from overweight at Jarden; Price Target: $11.00
Coles Group (COL)
Retained at overweight at Morgan Stanley; Price Target: $26.60
CSL (CSL)
Retained at overweight at Morgan Stanley; Price Target: $256.00
Domino's Pizza Enterprises (DMP)
Retained at underweight at Morgan Stanley; Price Target: $15.30
Elevra Lithium (ELV)
Retained at buy at Canaccord Genuity; Price Target: $12.50
Emerald Resources NL (EMR)
Retained at sell at Ord Minnett; Price Target: $4.90
Fortescue (FMG)
Downgraded to underperform from hold at Jefferies; Price Target: $19.50 from $19.25
Generation Development Group (GDG)
Retained at overweight at Morgan Stanley; Price Target: $7.50
Gemlife Communities Group (GLF)
Retained at overweight at Morgan Stanley; Price Target: $5.40
Goodman Group (GMG)
Retained at overweight at Morgan Stanley; Price Target: $41.50
Hillgrove Resources (HGO)
Retained at speculative buy at Canaccord Genuity; Price Target: $0.06 from $0.05
Iluka Resources (ILU)
Retained at overweight at Morgan Stanley; Price Target: $8.60
James Hardie Industries Plc (JHX)
Retained at overweight at Morgan Stanley; Price Target: $40.00
LendLease Group (LLC)
Retained at equal-weight at Morgan Stanley; Price Target: $5.70 from $6.58
Metals X (MLX)
Retained at buy at Canaccord Genuity; Price Target: $1.25 from $0.95
Macquarie Group (MQG)
Retained at equal-weight at Morgan Stanley; Price Target: $221.00
National Australia Bank (NAB)
Upgraded to neutral from underperform at Bank of America; Price Target: $42.00 from $38.00
Retained at equal-weight at Morgan Stanley; Price Target: $40.00
Nickel Industries (NIC)
Upgraded to buy from hold at Canaccord Genuity; Price Target: $1.05 from $0.80
Orica (ORI)
Retained at overweight at Morgan Stanley; Price Target: $26.00
PLS Group (PLS)
Retained at overweight at Morgan Stanley; Price Target: $2.85
Qube Holdings (QUB)
Retained at equal-weight at Morgan Stanley; Price Target: $5.20
REA Group (REA)
Retained at overweight at Morgan Stanley; Price Target: $290.00
Ramelius Resources (RMS)
Upgraded to buy from neutral at Goldman Sachs; Price Target: $5.35 from $4.30
Scentre Group (SCG)
Retained at overweight at Morgan Stanley; Price Target: $4.60
Steadfast Group (SDF)
Retained at neutral at Macquarie; Price Target: $4.90
SEEK (SEK)
Retained at overweight at Morgan Stanley; Price Target: $32.50
Sandfire Resources (SFR)
Retained at hold at Canaccord Genuity; Price Target: $19.25 from $15.00
Retained at outperform at RBC Capital Markets; Price Target: $18.00
Stockland (SGP)
Retained at overweight at Morgan Stanley; Price Target: $6.90
Sigma Healthcare (SIG)
Retained at overweight at Morgan Stanley; Price Target: $3.30
Santos (STO)
Retained at equal-weight at Morgan Stanley; Price Target: $6.76
Super Retail Group (SUL)
Retained at sector perform at RBC Capital Markets; Price Target: $18.20
Transurban Group (TCL)
Retained at equal-weight at Morgan Stanley; Price Target: $13.93
The Lottery Corporation (TLC)
Retained at equal-weight at Morgan Stanley; Price Target: $5.60
Telstra Group (TLS)
Retained at overweight at Morgan Stanley; Price Target: $4.95
Tuas (TUA)
Retained at overweight at Morgan Stanley; Price Target: $10.00
Vault Minerals (VAU)
Downgraded to neutral from buy at Goldman Sachs; Price Target: $6.30 from $5.27
Westpac Banking Corporation (WBC)
Retained at underweight at Morgan Stanley; Price Target: $34.10
Woodside Energy Group (WDS)
Retained at equal-weight at Morgan Stanley; Price Target: $27.00
Wesfarmers (WES)
Retained at equal-weight at Morgan Stanley; Price Target: $86.00
Whitehaven Coal (WHC)
Downgraded to sell from neutral at Goldman Sachs; Price Target: $6.10 from $5.60
Xero (XRO)
Retained at overweight at Morgan Stanley; Price Target: $225.00
Zip Co (ZIP)
Retained at buy at Citi; Price Target: $4.50
Scans
Top Gainers
Code | Company | Last | % Chg |
|---|---|---|---|
| NSB | Neuroscientific Biopharmaceuticals Ltd | $0.165 | +43.48% |
| UM1 | Unity Metals Ltd | $0.26 | +30.00% |
| GBE | Globe Metals & Mining Ltd | $0.06 | +27.66% |
| PL3 | Patagonia Lithium Ltd | $0.155 | +24.00% |
| NMG | New Murchison Gold Ltd | $0.062 | +21.57% |
Top Fallers
Code | Company | Last | % Chg |
|---|---|---|---|
| FND | Findi Ltd | $1.34 | -28.72% |
| AU1 | The Agency Group Australia Ltd | $0.027 | -20.59% |
| C1X | Cosmos Exploration Ltd | $0.092 | -20.00% |
| MML | Mclaren Minerals Ltd | $0.029 | -17.14% |
| GLH | Global Health Ltd | $0.072 | -15.29% |
52 Week Highs
Code | Company | Last | % Chg |
|---|---|---|---|
| UM1 | Unity Metals Ltd | $0.26 | +30.00% |
| PL3 | Patagonia Lithium Ltd | $0.155 | +24.00% |
| NMG | New Murchison Gold Ltd | $0.062 | +21.57% |
| PIQ | Proteomics International Laboratories Ltd | $0.79 | +18.80% |
| HAW | Hawthorn Resources Ltd | $0.13 | +18.18% |
52 Week Lows
Code | Company | Last | % Chg |
|---|---|---|---|
| FND | Findi Ltd | $1.34 | -28.72% |
| CMO | Cosmo Metals Ltd | $0.012 | -14.29% |
| RGT | Argent Biopharma Ltd | $0.06 | -6.25% |
| PCK | Painchek Ltd | $0.26 | -5.46% |
| MYX | Mayne Pharma Group Ltd | $3.01 | -4.44% |
Near Highs
Code | Company | Last | % Chg |
|---|---|---|---|
| SMLL | Betashares Australian Small Companies Select ETF | $4.84 | +0.83% |
| DYM | Dynamic Metals Ltd | $0.595 | +16.67% |
| GLPR | iShares Ftse GBL Property Ex Aus (Aud Hedged) ETF | $26.87 | +0.04% |
| DFND | Vaneck Global Defence ETF | $44.54 | +2.39% |
| WVOL | iShares MSCI World Ex Aust Minimum Volatility ETF | $45.23 | +0.36% |
Relative Strength Index (RSI) Oversold
Code | Company | Last | % Chg |
|---|---|---|---|
| SGP | Stockland | $5.51 | -0.18% |
| EPI | Epiminder Ltd | $0.94 | 0.00% |
| APA | APA Group | $8.60 | +0.23% |
| SLD | Saluda Medical, Inc | $1.165 | +1.30% |
| PMV | Premier Investments Ltd | $13.30 | -2.56% |
