
News | Market Wraps
Evening Wrap: ASX 200 up on soaring gold and silver stocks, NEM adds 6%, DTR spikes 18% in critical minerals
The S&P/ASX 200 closed 41.6 points higher, up 0.48%.

Mentioned
The S&P/ASX 200 closed 41.6 points higher, up 0.48%.
Precious metals stocks know no bounds at the moment, as of course, neither do precious metals prices — with gold and silver up strongly overnight and into Asian trade today.
More broadly, it was a commendable performance from Aussie stocks as all but the Utilities sector finished in the black — best: Gold (+2.7%), Consumer Discretionary (+2.1%), and Consumer Staples (+1.1%) vs laggards: Real Estate (+0.02%) and Resources (+0.03%).
Resources was an interesting one, the iron ore majors lost ground despite a stronger iron ore price in Singapore, and this cost most of the sector's points. More broadly, however, there were many strong performances from critical minerals and base metals stocks.
Be sure to click/scroll through for the usual reporting of the major sector and stock-specific moves, the broker responses to them, as well as all the key economic data in tonight's Evening Wrap.
Also, I have detailed technical analysis on the Nasdaq Composite and the S&P/ASX 200 in today's ChartWatch.
Let's dive in!
Today in Review
Mon 12 Jan 26, 6:31pm (AEST)
Name | Value | % Chg |
|---|---|---|
Major Indices | ||
| ASX 200 | 8,759.4 | +0.48% |
| All Ords | 9,092.7 | +0.52% |
| Small Ords | 3,912.9 | +0.95% |
| All Tech | 3,405.7 | +0.42% |
| Emerging Companies | 3,314.1 | +1.52% |
Currency | ||
| AUD/USD | 0.6705 | +0.26% |
US Futures | ||
| S&P 500 | 6,966.25 | -0.55% |
| Dow Jones | 49,489.0 | -0.48% |
| Nasdaq | 25,729.0 | -0.81% |
Name | Value | % Chg |
|---|---|---|
Sector | ||
| Consumer Discretionary | 4,038.5 | +2.12% |
| Consumer Staples | 11,792.2 | +1.12% |
| Energy | 8,551.4 | +0.86% |
| Industrials | 8,517.1 | +0.82% |
| Health Care | 34,139.4 | +0.64% |
| Information Technology | 2,152.8 | +0.49% |
| Financials | 9,143.8 | +0.44% |
| Communication Services | 1,739.5 | +0.40% |
| Real Estate | 3,899.8 | +0.02% |
| Materials | 22,010.7 | -0.01% |
| Utilities | 9,339.2 | -1.81% |
Markets
%20intraday%20chart_12%20Jan.png)
ASX 200 Session Chart
The S&P/ASX 200 (XJO) finished 41.6 points higher at 8,759.4, 0.48% from its session low and 0.30% from its high. In the broader-based S&P/ASX 300 (XKO) advancers beat decliners by a healthy 187 to 81.
Today's best blue chip gainers
Company | Last Price | Change $ | Change % | 1mo % | 1yr % |
|---|---|---|---|---|---|
Light & Wonder (LNW) | $182.50 | +$27.8 | +18.0% | +20.9% | +31.2% |
Ramelius Resources (RMS) | $4.39 | +$0.26 | +6.3% | +29.9% | +103.2% |
Newmont Corp. (NEM) | $166.59 | +$9.19 | +5.8% | +24.5% | +172.4% |
Whitehaven Coal (WHC) | $8.23 | +$0.4 | +5.1% | +9.6% | +36.9% |
Lynas Rare Earths (LYC) | $14.78 | +$0.68 | +4.8% | +14.3% | +110.2% |
James Hardie Industries (JHX) | $33.98 | +$1.56 | +4.8% | +18.2% | -33.0% |
AMP (AMP) | $1.845 | +$0.065 | +3.7% | +4.2% | +12.2% |
IGO (IGO) | $8.91 | +$0.26 | +3.0% | +26.4% | +77.1% |
Northern Star Resources (NST) | $25.43 | +$0.71 | +2.9% | -0.9% | +58.3% |
Mineral Resources (MIN) | $58.58 | +$1.49 | +2.6% | +17.2% | +65.0% |
Genesis Minerals (GMD) | $7.48 | +$0.19 | +2.6% | +23.0% | +178.1% |
PLS Group (PLS) | $4.77 | +$0.12 | +2.6% | +17.2% | +108.3% |
Perseus Mining (PRU) | $5.85 | +$0.14 | +2.5% | +12.1% | +124.1% |
Pinnacle Investment (PNI) | $17.81 | +$0.42 | +2.4% | +6.5% | -22.9% |
Coles Group (COL) | $21.53 | +$0.5 | +2.4% | -1.2% | +12.7% |
Brambles (BXB) | $23.24 | +$0.53 | +2.3% | +1.0% | +17.2% |
Ampol (ALD) | $31.15 | +$0.63 | +2.1% | -1.8% | +6.4% |
Eagers Automotive (APE) | $27.18 | +$0.54 | +2.0% | +3.3% | +130.4% |
Sonic Healthcare (SHL) | $22.83 | +$0.43 | +1.9% | -1.6% | -19.2% |
Nextdc (NXT) | $12.78 | +$0.24 | +1.9% | -7.3% | -17.5% |
Today's worst blue chip losers
Company | Last Price | Change $ | Change % | 1mo % | 1yr % |
|---|---|---|---|---|---|
Insurance Australia Group (IAG) | $7.73 | -$0.29 | -3.6% | -2.4% | -10.0% |
BHP Group (BHP) | $46.51 | -$1.21 | -2.5% | +5.0% | +18.0% |
APA Group (APA) | $8.58 | -$0.2 | -2.3% | -5.8% | +24.5% |
Life360 (360) | $31.64 | -$0.71 | -2.2% | -13.0% | +36.0% |
Suncorp Group (SUN) | $17.08 | -$0.38 | -2.2% | +0.9% | -12.0% |
Medibank Private (MPL) | $4.75 | -$0.1 | -2.1% | +2.2% | +23.7% |
AGL Energy (AGL) | $9.01 | -$0.15 | -1.6% | -3.2% | -19.8% |
Origin Energy (ORG) | $11.18 | -$0.18 | -1.6% | -3.0% | +1.6% |
QBE Insurance Group (QBE) | $19.82 | -$0.28 | -1.4% | +3.0% | +0.9% |
Fortescue (FMG) | $22.40 | -$0.31 | -1.4% | -0.2% | +27.5% |
Qantas Airways (QAN) | $10.20 | -$0.11 | -1.1% | +4.8% | +12.0% |
Orica (ORI) | $25.79 | -$0.24 | -0.9% | +8.3% | +55.6% |
Netwealth Group (NWL) | $25.55 | -$0.21 | -0.8% | -5.2% | -14.2% |
Worley (WOR) | $12.98 | -$0.1 | -0.8% | -0.9% | -6.0% |
Vicinity Centres (VCX) | $2.60 | -$0.02 | -0.8% | +4.8% | +20.9% |
Steadfast Group (SDF) | $5.29 | -$0.04 | -0.8% | +5.2% | -9.3% |
GPT Group (GPT) | $5.42 | -$0.04 | -0.7% | -0.7% | +21.0% |
Rio Tinto (RIO) | $142.43 | -$0.63 | -0.4% | +3.9% | +22.9% |
The A2 Milk Company (A2M) | $9.14 | -$0.04 | -0.4% | +1.8% | +63.2% |
Atlas Arteria (ALX) | $4.84 | -$0.02 | -0.4% | 0% | +0.2% |
ChartWatch
Nasdaq Composite Index
Analysis
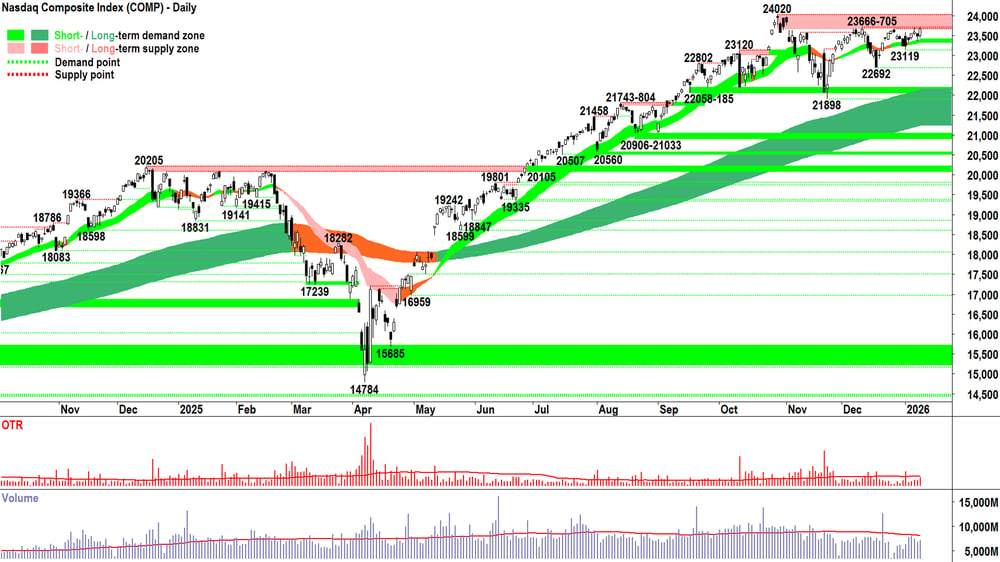
In Friday’s update, I proposed that few long suffering readers of ChartWatch would not have been surprised by Thursday’s candle — arguably the most logical follow up in terms of its price action to Wednesday’s candle (given the 23666-705 overhead supply and the dynamic demand at the short term uptrend ribbon).
Can I be so bold to say "ditto" for Friday’s candle versus Thursday’s — I mean, tell we what else one would have expected!? 🤔
The short term trend ribbon has done its job, the long term uptrend has prevailed — and the buy the dip activity that was lurking in Thursday’s candle has simply flowed through to Friday.
Where did Friday’s buying stop? I mean, it could have been far more forceful… that is, if not for the 23666-705 zone of supply. Still, it closed just about on the session high, and this indicates solid conviction into the close, even if further progress into 23666-705 wasn’t made.
We may see it tonight! 🤞
Tonight is arguably the best look at 23666-705 the Comp’s had since the 24020-21898 push that halted the prevailing bull market back in November.
A powerful candle, long white-bodied and or with a long downward pointing shadow, closing at or very near its high — would smash the latent supply in 23666-705 and do two important things:
1. Give greater confidence to those on the supply-side that higher prices are imminent — and therefore to take advantage of these they must HOFU (Hold On For Upside)
2. Spark fear and terror among those with cash (i.e., “demand”) — making that cash look like a deadly burden in a rising market: "OMG…if I don’t beat the index (or at least track its performance) I won’t get my bonus this quarter!!!" 😱
No bonus = No Lambo / Ferrari / 911 Turbo... and no quarterly bonus Vegas shenanigans! 🎉
You wouldn’t wish it on your worst Wall St. fund manager enemy! 🤣
“2” of course is FOMO (Fear Of Missing Out).
Long suffering readers of ChartWatch know about three core market truths, one of them being:
FOMO + HOFU = D⬆️ vs S⬇️ = P⬆️
This relationship is valid now. Was yesterday. Was 100 years ago. Was 1,000 years ago. Will be tomorrow. Will be in 100 years… ahem... let’s not go any further out than that! 🤖
If I see said demand-side candle, I’ll be happy to move back to FRP on the Comp. I’ll confirm for you tomorrow.
If I see the opposite, supply-side candle — i.e., black / upward pointing shadow / close near low of the session = ⚠️🚨
Watch for volume either way — we’d love to see a whack of it. The only way to deal with the latent supply in 24020-21898 is to trade with them. Likely, we’ll need lots of demand to knock them out, so lots of demand trading with lots of supply = lots of volume.
Plus... super important: lots of demand + lots of supply knocked out (and in cash which = demand, remember!?) = 💪💪💪 for the bull market!
We’ll get what we’ll get. Then we’ll deal with it. Repeat every trading day until the day you stop trading.
It’s that simple.
Or you can make it way more complicated by pursuing information that's not in a chart… it’s your choice I guess! 🤷
View
No change: I remain comfortable at my 2/3RP portfolio risk limit 🪣 (RP = Risk Position — it reflects my personal allowable capital allocation limit for my investments in US stocks. So 1/2RP is 50%, 2/3RP is 67% and FRP is 100%).
Key levels
The trough at 23119 is the closest point of demand — a close below it would signal the demand-side is under pressure again — but I propose that it's not until a close below the next, lower point of demand at 22692 that we can assume they've lost control of the Comp's price. On a close below 21898 the short term trend is unequivocally down and the long term uptrend is likely under significant pressure = ⚠️. 23666-24020 is the nearest critical zone of supply — the Comp must close within this zone with a strong demand-side candle to confirm the demand-side is unequivocally back in control of the Comp's price.
S&P/ASX 200 (XJO)
%20chart_12%20Jan.png)
Analysis
Better than the usual slop we’ve come to expect from the ASX 200 a.k.a. The Old Tin Pot!
But… that upward pointing shadow on today’s candle…
Yeah, yeah… it’s not huge… but seriously!? Surely, we could have gone without one today… I mean everything was set up for a strong performance with respect to overseas leads… and yet we couldn’t deliver the definitive buy signal that we’ve been waiting for.
Baby steps I guess. It’s the OTP, right? 🤦
Hopefully we continue to baby step higher — anything better’s a bonus — to test the 8806 point of supply. Surely an emphatic close above that point must trigger a little FOMO and HOFU among our fund managers? 🤷
Meh…🫤
View
I remain comfortable at 1/2RP 🪣 (i.e., my personal allowable capital allocation limit for my investments in Australian stocks is 50%).
Key levels
8547-8562 is the new closest zone of demand. A close below this zone would confirm the supply side is back in control of the ASX 200's price. In theory though, the short term and long term trend ribbons now begin to act as a zone of dynamic demand (presently 8570-8696). 8806 is the next key point of supply. A close above it would confirm the demand-side is in control of the price — but it would take a miracle in the "dud" sectors to make this happen!
ChartWatch *LIVE* Webinar
ChartWatch *LIVE* Webinars – WEEKLY Wednesday's @ 12pm AEDT
Learn more about technical analysis and trend following through real case studies on ASX stocks. Australia's premier technical analyst, Carl Capolingua, shares his unique insights on stocks as requested by viewers. Ask about a company in your portfolio or anything related to trading and investing and get Carl's expert opinion.
Places are limited so >REGISTER NOW!<
Economy
Today
AUS December ANZ Job Advertisements m/m
-0.5% m/m vs -1.5% m/m in November (revised from -0.8% m/m)
AUS December Household Spending
+1.0% m/m vs +0.6 forecast and +1.4% m/m in November (revised from +1.3% m/m)
Later this week
Tuesday
AUS January Westpac Consumer Sentiment (-9.0% in December)
CHN December M2 Money Supply (+8.0% p.a. forecast vs +8.0% p.a. in November)
CHN December New Loans (+$450 billion forecast vs +$390 billion in November)
Wednesday
00:30 USA December Consumer Price Index (CPI) (+0.3% m/m forecast vs +0.2% m/m in November)
00:30 USA December Retail Sales (+0.4% m/m forecast vs 0.0% m/m in November)
Thursday
11:00 AUS MI Inflation Expectations (+4.7% p.a. previous)
Friday
00:30 January Empire State Manufacturing Index (+1.1 forecast vs -3.9 in December)
Saturday
01:15 USA December Industrial Production m/m (+0.2% m/m forecast vs +0.2% m/m previous)
Latest News
Interesting Movers
Trading higher
+23.1% Manuka Resources (MKR) – No news, general strength across the broader Precious Metals sector today, rise is consistent with prevailing short and long term uptrends, a regular in ChartWatch ASX Scans Uptrends list 🔎📈
+18.2% Dateline Resources (DTR) – Wide Gold Intercepts Extend Beyond Colosseum Resource Zones, general strength across the broader Critical Minerals sector today, rise is consistent with prevailing long term uptrend, a recent regular in ChartWatch ASX Scans Uptrends list 🔎📈
+18.0% Light & Wonder (LNW) – LNW - Joint Statement regarding Litigation, rise is consistent with prevailing short and long term uptrends, a recent regular in ChartWatch ASX Scans Uptrends list 🔎📈
+17.0% Maronan Metals (MMA) – No news, general strength across the broader Precious Metals sector today, rise is consistent with prevailing short and long term uptrends, a regular in ChartWatch ASX Scans Uptrends list 🔎📈
+17.0% EQ Resources (EQR) – No news, general strength across the broader Critical Minerals sector today, rise is consistent with prevailing short and long term uptrends, a regular in ChartWatch ASX Scans Uptrends list 🔎📈
+14.9% European Lithium (EUR) – Ceasing to be a substantial holder for CLE, general strength across the broader Critical Minerals sector today, rise is consistent with prevailing short and long term uptrends, a recent regular in ChartWatch ASX Scans Uptrends list 🔎📈
+13.1% Nova Minerals (NVA) – No news, general strength across the broader Precious Metals sector today.
+12.7% Felix Gold (FXG) – No news, general strength across the broader Precious Metals sector today, bounced perfectly from long term uptrend ribbon! 🔎📈
+12.5% Northern Minerals (NTU) – No news, general strength across the broader Critical Minerals sector today.
+12.2% Unico Silver (USL) – No news, general strength across the broader Precious Metals sector today, rise is consistent with prevailing short and long term uptrends, a regular in ChartWatch ASX Scans Uptrends list 🔎📈
+12.0% American Tungsten & Antimony (AT4) – Investor Webinar - 2026 Project Plans Update, general strength across the broader Critical Minerals sector today.
+11.5% Investigator Resources (IVR) – No news, general strength across the broader Precious Metals sector today, rise is consistent with prevailing short and long term uptrends, a regular in ChartWatch ASX Scans Uptrends list 🔎📈
+10.0% Argent Minerals (ARD) – No news, general strength across the broader Precious Metals sector today, rise is consistent with prevailing short and long term uptrends, a regular in ChartWatch ASX Scans Uptrends list 🔎📈
+10.0% Power Holdings (PWH) – PWR secures ongoing orders in Aerospace and Defence.
+9.9% Sun Silver (SS1) – No news, general strength across the broader Precious Metals sector today, rise is consistent with prevailing short and long term uptrends, a regular in ChartWatch ASX Scans Uptrends list 🔎📈
+9.9% Andean Silver (ASL) – No news, general strength across the broader Precious Metals sector today, rise is consistent with prevailing short and long term uptrends, a regular in ChartWatch ASX Scans Uptrends list 🔎📈
+8.6% Pmet Resources (PMT) – No news, general strength across the broader Critical Minerals sector today, rise is consistent with prevailing short and long term uptrends, a regular in ChartWatch ASX Scans Uptrends list 🔎📈
+8.5% Arafura Rare Earths (ARU) – No news, general strength across the broader Critical Minerals sector today, rise is consistent with prevailing short and long term uptrends, a regular in ChartWatch ASX Scans Uptrends list 🔎📈
+8.0% West Coast Silver (WCE) – No news, general strength across the broader Precious Metals sector today, rise is consistent with prevailing short and long term uptrends, a regular in ChartWatch ASX Scans Uptrends list 🔎📈
Trading lower
-15.4% Energy Transition Minerals (ETM) – No news, pulled back in the wake of recent sharp rally.
-9.0% Sunrise Energy Metals (SRL) – No news, pulled back in the wake of recent sharp rally.
-8.1% Lumos Diagnostics Holdings (LDX) – No news, pulled back in the wake of recent sharp rally.
-7.2% Mesoblast (MSB) – No news, pulled back in the wake of recent sharp rally.
-7.1% 4DMEDICAL (4DX) – No news, pulled back in the wake of recent sharp rally.
-7.0% Nyrada (NYR) – No news, pulled back in the wake of recent sharp rally.
-5.3% Super Retail Group (SUL) – Trading Update, fall is consistent with prevailing short term downtrend and falling peaks and falling troughs 🔎📉
Broker Moves
29Metals (29M)
Downgraded to underperform from hold at Jefferies; Price Target: $0.45
AMP (AMP)
Upgraded to buy from neutral at Citi; Price Target: $2.10
Brambles (BXB)
Upgraded to buy from neutral at Citi; Price Target: $26.75
Capricorn Metals (CMM)
Downgraded to neutral from overweight at Jarden; Price Target: $11.00
Elevra Lithium (ELV)
Retained at buy at Canaccord Genuity; Price Target: $12.50
Fortescue (FMG)
Downgraded to underperform from hold at Jefferies; Price Target: $19.50 from $19.25
National Australia Bank (NAB)
Upgraded to neutral from underperform at Bank of America; Price Target: $42.00 from $38.00
Ramelius Resources (RMS)
Upgraded to buy from neutral at Goldman Sachs; Price Target: $5.35 from $4.30
Sandfire Resources (SFR)
Retained at outperform at RBC Capital Markets; Price Target: $18.00
Super Retail Group (SUL)
Retained at sector perform at RBC Capital Markets; Price Target: $18.20
Vault Minerals (VAU)
Downgraded to neutral from buy at Goldman Sachs; Price Target: $6.30 from $5.27
Scans
Top Gainers
Code | Company | Last | % Chg |
|---|---|---|---|
| CDR | Codrus Minerals Ltd | $0.026 | +52.94% |
| ITM | Itech Minerals Ltd | $0.064 | +33.33% |
| LNQ | LINQ Minerals Ltd | $0.37 | +32.14% |
| NC1 | Nico Resources Ltd | $0.22 | +29.41% |
| EMS | Eastern Metals Ltd | $0.04 | +29.03% |
Top Fallers
Code | Company | Last | % Chg |
|---|---|---|---|
| BGE | Bridge Saas Ltd | $0.015 | -31.82% |
| GAS | State GAS Ltd | $0.023 | -17.86% |
| FOS | FOS Capital Ltd | $0.21 | -16.00% |
| ETM | Energy Transition Minerals Ltd | $0.165 | -15.39% |
| KNB | Koonenberry Gold Ltd | $0.039 | -15.22% |
52 Week Highs
Code | Company | Last | % Chg |
|---|---|---|---|
| LNQ | LINQ Minerals Ltd | $0.37 | +32.14% |
| NC1 | Nico Resources Ltd | $0.22 | +29.41% |
| EMS | Eastern Metals Ltd | $0.04 | +29.03% |
| MKR | Manuka Resources Ltd | $0.16 | +23.08% |
| GRX | Greenx Metals Ltd | $1.04 | +19.54% |
52 Week Lows
Code | Company | Last | % Chg |
|---|---|---|---|
| FOS | FOS Capital Ltd | $0.21 | -16.00% |
| VGL | Vista Group International Ltd | $1.95 | -7.14% |
| ODA | Orcoda Ltd | $0.047 | -6.00% |
| IMC | Immuron Ltd | $0.034 | -5.56% |
| NME | NEX Metals Exploration Ltd | $0.018 | -5.26% |
Near Highs
Code | Company | Last | % Chg |
|---|---|---|---|
| WVOL | iShares MSCI World Ex Aust Minimum Volatility ETF | $45.07 | +0.56% |
| IAGPF | Insurance Australia Group Ltd | $105.67 | +0.26% |
| GCI | Gryphon Capital Income Trust | $2.07 | 0.00% |
| VVLU | Vanguard Global Value Equity Active ETF | $82.00 | +0.29% |
| IHD | iShares S&P/ASX DIV Opportunities Esg Screened ETF | $16.34 | -0.24% |
Relative Strength Index (RSI) Oversold
Code | Company | Last | % Chg |
|---|---|---|---|
| SGP | Stockland | $5.52 | -0.18% |
| EPI | Epiminder Ltd | $0.94 | +0.54% |
| APA | APA Group | $8.58 | -2.28% |
| SLD | Saluda Medical, Inc | $1.15 | -2.95% |
| OSM | Osmond Resources Ltd | $0.63 | -10.00% |
