News | Market Wraps
Evening Wrap: ASX 200 dips as Rio Tinto plunges nearly 7% on Glencore merger talks
The S&P/ASX 200 closed 3.0 points lower, down 0.03%.

Mentioned
The S&P/ASX 200 closed 3.0 points lower, down 0.03%.
Rio Tinto and Glencore have restarted early-stage merger talks that could see Rio Tinto (ASX: RIO) acquire Glencore (LSE: GLEN) and create the world’s largest mining company with an enterprise value around $207 billion, though no deal terms are set and there’s no certainty an offer will be made.
Be sure to click/scroll through for the usual reporting of the major sector and stock-specific moves, the broker responses to them, as well as all the key economic data in tonight's Evening Wrap.
Also, I have detailed technical analysis on the S&P/ASX 200 in today's ChartWatch.
Let's dive in!
Today in Review
Fri 09 Jan 26, 5:08pm (AEST)
Name | Value | % Chg |
|---|---|---|
Major Indices | ||
| ASX 200 | 8,717.8 | -0.03% |
| All Ords | 9,045.9 | -0.01% |
| Small Ords | 3,876.1 | +0.35% |
| All Tech | 3,391.4 | -0.44% |
| Emerging Companies | 3,264.5 | -0.35% |
Currency | ||
| AUD/USD | 0.6695 | -0.07% |
US Futures | ||
| S&P 500 | 6,959.0 | -0.04% |
| Dow Jones | 49,476.0 | -0.03% |
| Nasdaq | 25,668.5 | -0.07% |
Name | Value | % Chg |
|---|---|---|
Sector | ||
| Energy | 8,478.5 | +2.12% |
| Consumer Staples | 11,662.1 | +1.02% |
| Communication Services | 1,732.6 | +0.37% |
| Consumer Discretionary | 3,954.5 | +0.22% |
| Utilities | 9,511.5 | +0.03% |
| Health Care | 33,921.2 | -0.11% |
| Industrials | 8,447.8 | -0.15% |
| Materials | 22,013.4 | -0.19% |
| Financials | 9,104.1 | -0.22% |
| Real Estate | 3,899.0 | -0.38% |
| Information Technology | 2,142.3 | -0.48% |
Markets
%20intraday%20chart_9%20Jan.png)
ASX 200 Session Chart
The S&P/ASX 200 (XJO) finished 3.0 points lower at 8,717.8, 0.52% from its session high and just 0.11% from its low. Despite the rather pathetic performance in the benchmark, in the broader-based S&P/ASX 300 (XKO) advancers still managed beat decliners — albeit by a slender margin of 140 to 136.
For the week, the XJO finished down 10 points or 0.11% lower, roughly mid-range for the week — 0.61% from its intraweek high and 0.49% from its intraweek low. 5 days of trading to pretty much go nowhere.
Fund flows: Gaining Energy... but that's about it! 😪
Obviously Rio Tinto’s (RIO) 6.3% tumble on the back of a potential merger with UK rival commodities house Glencore (LSE: GLEN) threw a bit of a spanner in the works for the big fundies today… add that back, and it was probably a fairly typical Resources (XJR) (-0.01%) up vs the usual suspects no-so-much kind of day.
What it was… was painfully slow and meandering — and not in a good way if you look up at the intraday chart of the ASX 200…
Energy (XEJ) (+2.1%) was probably the only sector that garnered more than rudimentary interest, as it popped on the back of stronger crude oil prices overnight — and those were higher due to rising geopolitical tensions. In short:
The U.S. seized Venezuela-linked tankers (including one under a Russian flag), protests and internet shutdowns in Iran raised fears of U.S. intervention, and Iraq moved to nationalise a major oilfield — together amplifying concerns of disrupted supply across key producers.
A drone attack on a Russia-bound tanker in the Black Sea underscored growing threats to oil transport routes, reinforcing fears of supply interruptions even in an otherwise oversupplied market.
Interesting times in which we live and invest!
More broadly within resources, precious metals stocks were generally softer, particularly so for silver stocks as the price of that commodity ebbed overnight (threatening a double top pattern on the chart).
Lithium stocks took a breather — again, due to adverse commodity price moves (benchmark lithium futures are ~1% lower in China today), and so too did many critical minerals stocks (the benchmark NdPr price is down ~0.5% in China today).
%20COMEX%20chart_9%20Jan.png)
Silver Futures (Front month, back-adjusted) COMEX chart
Stock Specific: Re-oooooooohhhhh! 💥
It's not a great look for a chart... a long black-bodied candle with a close near the session's low — and on massive volume... Did I mention the gap and run? ⚠️🚨
%20chart_9%20Jan.png)
Oops! That's a nasty candle for RIO, generally seen as the acquirer in the GLEN transaction and not the target. That means the market is expecting RIO could be about to embark on an expensive exercise in securing the UK-based resources monster, and who's to say there aren't other bidders lurking?
Having said that, BHP Group (BHP) (+0.80%) was up today and seemingly unperturbed by proceedings.
This is just my 2 cents, and it's purely from a technical perspective: because I have no interest in doing the research on the RIO-GLEN deal (how boring!)... Nope, I'm the guy who lazily looks at the chart and says... D > S = P ⬆️ or S > D = P ⬇️...
Clearly, there's been a major shift in short term thinking with respect to the big fundies desire to own RIO (a.k.a. "demand") compared to reducing their exposure to it (a.k.a. "supply"). The massive price action, gap, and massive volume tell you this.
But! The short term trend ribbon appears to be holding... for now... and we must not discount the strength of that long term uptrend. The habit of investors has been to determinately buy the dip for some time — who's to say they won't continue to do so? 🤔
This is how I would trade it (note the word there is trade... this is my trading style not yours!).
That signal is just too substantial for me to ignore. I don't have to know why the big fundies are behaving in a particular way — I just respect they likely have very good reasons for doing so. The severity of S > D = P ⬇️ means I cannot in good conscience continue to run at FRP (Full Risk Position) on RIO — which I 100% would have been prior to today's news — because look how good the chart looked!
So, this means some degree of -R for me. If I see a confirming supply-side signal (i.e., black-bodied candle and or upward pointing shadow), I'll have a pretty good idea that the buy the dip strategy is on the nose... in this case, I'll look to do another round of -R... and so on.
If, however, tomorrow I'm greeted by a long white candle and or downward pointing shadow, particularly on well-above average volume (indicating strong interest in buying the dip and removal of the latent, nervous supply in the system), I'll know to hold what I've got... and if the situation improves enough... get back to +R at some point.
Anyways, that's how I'd play it. Based on my plan to constantly and diligently manage my risk. For better or worse (can't tell the future and all that stuff!).
What's your plan? How are you going to manage your risk on RIO? Or don't you have a plan = HOLD + HOPE + Everything will be okay!? 🙏
Today's best blue chip gainers
Company | Last Price | Change $ | Change % | 1mo % | 1yr % |
|---|---|---|---|---|---|
James Hardie Industries (JHX) | $32.42 | +$1.58 | +5.1% | +9.4% | -35.3% |
Eagers Automotive (APE) | $26.64 | +$1.21 | +4.8% | -1.0% | +126.8% |
Santos (STO) | $6.15 | +$0.21 | +3.5% | -5.4% | -11.6% |
Woodside Energy Group (WDS) | $23.59 | +$0.64 | +2.8% | -6.4% | -7.7% |
Amcor PLC (AMC) | $12.86 | +$0.29 | +2.3% | +2.3% | -15.6% |
Bluescope Steel (BSL) | $30.00 | +$0.6 | +2.0% | +26.6% | +56.8% |
REA Group (REA) | $186.49 | +$3.38 | +1.8% | -3.8% | -23.3% |
Woolworths Group (WOW) | $30.08 | +$0.53 | +1.8% | +2.7% | -1.3% |
Endeavour Group (EDV) | $3.77 | +$0.05 | +1.3% | +2.2% | -9.4% |
Medibank Private (MPL) | $4.85 | +$0.06 | +1.3% | +7.1% | +27.0% |
Mineral Resources (MIN) | $57.09 | +$0.6 | +1.1% | +10.9% | +65.9% |
South32 (S32) | $3.85 | +$0.04 | +1.1% | +12.9% | +13.2% |
Ampol (ALD) | $30.52 | +$0.31 | +1.0% | -3.9% | +4.2% |
Aristocrat Leisure (ALL) | $57.22 | +$0.57 | +1.0% | -0.9% | -20.0% |
Lendlease Group (LLC) | $5.10 | +$0.05 | +1.0% | -0.8% | -19.7% |
Suncorp Group (SUN) | $17.46 | +$0.17 | +1.0% | +2.9% | -9.1% |
Dyno Nobel (DNL) | $3.39 | +$0.03 | +0.9% | +4.0% | +14.1% |
QBE Insurance Group (QBE) | $20.10 | +$0.17 | +0.9% | +5.6% | +1.0% |
BHP Group (BHP) | $47.72 | +$0.38 | +0.8% | +7.3% | +23.3% |
Insurance Australia Group (IAG) | $8.02 | +$0.06 | +0.8% | +2.6% | -4.3% |
Today's worst blue chip losers
Company | Last Price | Change $ | Change % | 1mo % | 1yr % |
|---|---|---|---|---|---|
Rio Tinto (RIO) | $143.06 | -$9.57 | -6.3% | +4.3% | +24.8% |
PLS Group (PLS) | $4.65 | -$0.15 | -3.1% | +15.4% | +104.8% |
Challenger (CGF) | $9.13 | -$0.29 | -3.1% | +0.4% | +47.7% |
Pro Medicus (PME) | $210.21 | -$5.71 | -2.6% | -14.8% | -19.0% |
Light & Wonder (LNW) | $154.70 | -$3.26 | -2.1% | +2.5% | +12.4% |
Nextdc (NXT) | $12.54 | -$0.26 | -2.0% | -11.4% | -19.3% |
Block (XYZ) | $104.77 | -$2.08 | -1.9% | +13.9% | -29.0% |
AMP (AMP) | $1.780 | -$0.035 | -1.9% | 0% | +8.9% |
Qantas Airways (QAN) | $10.31 | -$0.2 | -1.9% | +5.2% | +13.1% |
Wisetech Global (WTC) | $67.01 | -$1.27 | -1.9% | -9.3% | -46.2% |
Xero (XRO) | $107.46 | -$1.9 | -1.7% | -9.0% | -37.1% |
Genesis Minerals (GMD) | $7.29 | -$0.11 | -1.5% | +18.2% | +182.6% |
Life360 (360) | $32.35 | -$0.44 | -1.3% | -14.5% | +37.6% |
Macquarie Group (MQG) | $206.08 | -$2.61 | -1.3% | +4.8% | -9.1% |
Netwealth Group (NWL) | $25.76 | -$0.31 | -1.2% | -3.6% | -13.8% |
Capricorn Metals (CMM) | $13.82 | -$0.16 | -1.1% | +4.1% | +112.3% |
IGO (IGO) | $8.65 | -$0.1 | -1.1% | +23.4% | +74.7% |
Fisher & Paykel Healthcare Corp. (FPH) | $33.00 | -$0.37 | -1.1% | -0.8% | -4.0% |
Computershare (CPU) | $33.74 | -$0.36 | -1.1% | -3.4% | -3.8% |
SGH (SGH) | $47.53 | -$0.5 | -1.0% | +2.8% | +0.5% |
ChartWatch
Nasdaq Composite Index
Analysis
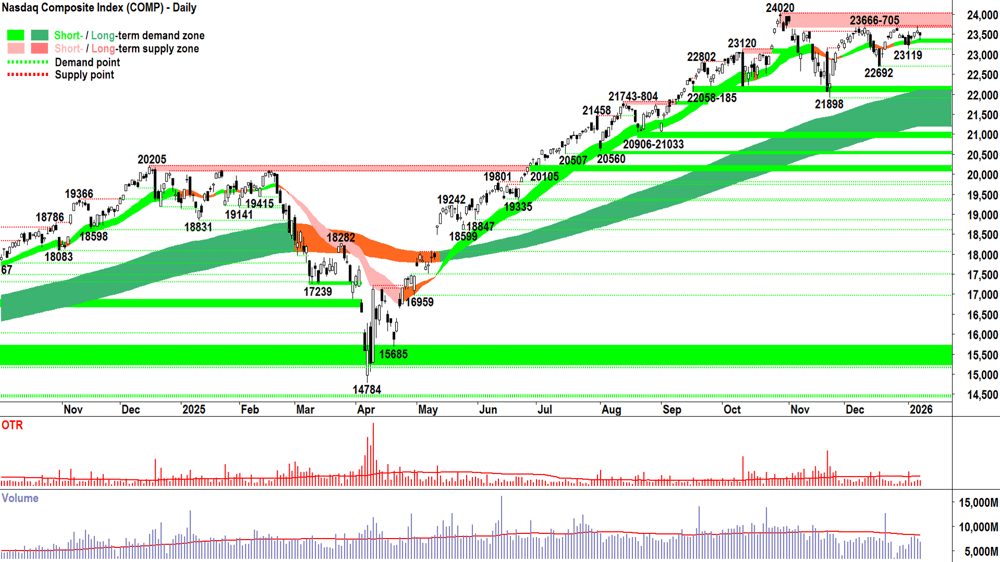
No doubt, there’s very little surprise among long-suffering readers of ChartWatch regarding Thursday’s candle on the Comp — in fact, you could go so far as to say it’s exactly the kind of follow up to Wednesday’s candle that we’d expect.
The supply that manifested itself on Wednesday flowed through in early Thursday trade, but in keeping with the broader short and long term uptrends, the demand-side dutifully came in and bought the dip. The result in terms of price action, is that downward pointing shadow. They couldn't get the Comp all the way back up to the open, however, hence the black body for Thursday’s candle.
The short term trend ribbon did its job as a probable zone of dynamic demand. 23666-24020 still looms large — a seemingly impenetrable barrier holding back — dare I say: the inevitable continuation of the current bull market? 🤔
Volume was pitiful, a symptom of the time of the year and a lack of motivation and engagement among the demand- and supply-sides.
And so, we drift along, with a modest upward bias… awaiting that one big signal to kick off the next leg of the journey. Given the great big dark green caterpillar crawling from the bottom left to the top right of the Comp’s chart — as a trend follower — I must believe the next leg will be up! 📈
View
No change: I remain comfortable at my 2/3RP portfolio risk limit 🪣 (RP = Risk Position — it reflects my personal allowable capital allocation limit for my investments in US stocks. So 1/2RP is 50%, 2/3RP is 67% and FRP is 100%).
Key levels
The trough at 23119 is the closest point of demand — a close below it would signal the demand-side is under pressure again — but I propose that it's not until a close below the next, lower point of demand at 22692 that we can assume they've lost control of the Comp's price. On a close below 21898 the short term trend is unequivocally down and the long term uptrend is likely under significant pressure = ⚠️. 23666-24020 is the nearest critical zone of supply — the Comp must close within this zone with a strong demand-side candle to confirm the demand-side is unequivocally back in control of the Comp's price.
S&P/ASX 200 (XJO)
%20chart_9%20Jan.png)
Analysis
Yesterday, my analysis here consisted of the words “Ho” and “Hum”. Rather succinct, I think you’ll agree!? 🧐
What anti-superlatives does the ASX 200 a.k.a. The Old Tin Pot deserve today?
Here’s one from my teenagers, always at the ready to murder the English language with one of their lazy abbreviations: Ceebs!
(If you’re older than 40, and don’t speak Gen Alpha, this stands for “Can’t be bothered”).
Don’t worry, I’ll do some technical analysis again at some stage — when there’s some price action and candles to warrant it! 🤦
Have a fantastic weekend everyone! 🏖️
View
I remain comfortable at 1/2RP 🪣 (i.e., my personal allowable capital allocation limit for my investments in Australian stocks is 50%).
Key levels
8547-8562 is the new closest zone of demand. A close below this zone would confirm the supply side is back in control of the ASX 200's price. In theory though, the short term and long term trend ribbons now begin to act as a zone of dynamic demand (presently 8570-8690). 8806 is the next key point of supply. A close above it would confirm the demand-side is in control of the price — but it would take a miracle in the "dud" sectors to make this happen!
ChartWatch *LIVE* Webinar
ChartWatch *LIVE* Webinars – WEEKLY Wednesday's @ 12pm AEDT
Learn more about technical analysis and trend following through real case studies on ASX stocks. Australia's premier technical analyst, Carl Capolingua, shares his unique insights on stocks as requested by viewers. Ask about a company in your portfolio or anything related to trading and investing and get Carl's expert opinion.
Places are limited so >REGISTER NOW!<
Economy
Today
12:30 CHN December CPI & Producer Price Index ("PPI")
CPI: +0.8% p.a. vs +0.8% p.a. forecast and +0.7% p.a. in November
PPI: -1.9% p.a. vs -2.0% p.a. forecast and -2.2% p.a. in November
Comment: As forecast, CPI up slightly which will be a relieve for Beijing, but still no sign of recent anti-involution push in producer prices. Having said that, wholesale deflation in China is usually helpful for keeping a lid on CPI in the rest of the world.
Later this week
Saturday
00:30 USA December Non-Farm Employment Report
Change: 66,000 forecast vs 64,000 in November
Rate: 4.5% forecast vs 4.6% in November
Average Hourly Earnings: +0.3% m/m vs +0.1% m/m in November
02:00 USA Preliminary UoM Consumer Sentiment (53.5 forecast vs 52.9 in December)
Latest News
Interesting Movers
Trading higher
+21.9% Energy Transition Minerals (ETM) – Appointment of Ballard Partners, rise is consistent with prevailing short and long term uptrends, a recent regular in ChartWatch ASX Scans Uptrends list 🔎📈
+19.3% Tivan (TVN) – No news, rise is consistent with prevailing short and long term uptrends, a regular in ChartWatch ASX Scans Uptrends list 🔎📈
+16.9% Codan (CDA) – Trading Update, rise is consistent with prevailing short and long term uptrends, added to ChartWatch ASX Scans Uptrends list yesterday 🔎📈
+11.3% Alkane Resources (ALK) – December 2025 Quarterly Production Update, rise is consistent with prevailing short and long term uptrends, a regular in ChartWatch ASX Scans Uptrends list 🔎📈
+8.2% Robex Resources (RXR) – No news, rise is consistent with prevailing short and long term uptrends, a regular in ChartWatch ASX Scans Uptrends list 🔎📈
+6.9% Lumos Diagnostics Holdings (LDX) – No news since 07-Jan Investor Webinar Invitation-Reducing Diagnostic Uncertainty, rise is consistent with prevailing short and long term uptrends, a regular in ChartWatch ASX Scans Uptrends list 🔎📈
+6.2% Predictive Discovery (PDI) – No news, rise is consistent with prevailing short and long term uptrends, a regular in ChartWatch ASX Scans Uptrends list 🔎📈
+5.1% Karoon Energy (KAR) – 2026 key dates, general strength across the broader Energy sector today.
+4.8% Eagers Automotive Ltd (APE) – No news, upgraded to buy from hold at Jefferies (price target retained at $29.50).
+4.4% Droneshield (DRO) – No news, general strength across the broader Defence sector today, rise is consistent with prevailing short and long term uptrends, a recent regular in ChartWatch ASX Scans Uptrends list 🔎📈
+3.5% Santos (STO) – No news, general strength across the broader Energy sector today.
+3.2% BetaShares Crude Oil Index ETF (OOO) – No news, general strength across the broader Energy sector today (Energy sector ETF).
+2.8% Beach Energy (BPT) – No news, general strength across the broader Energy sector today.
+2.8% Woodside Energy Group (WDS) – No news, general strength across the broader Energy sector today.
Trading lower
-6.3% Rio Tinto (RIO) – Statement regarding Glencore plc.
-5.9% Chalice Mining (CHN) – No news, general weakness across the broader Critical Minerals sector today.
-5.6% Sun Silver (SS1) – Change in substantial holding (Nokomis Capital 6.2% from 7.8%), general weakness across the broader Silver sector today.
-5.3% 29METALS (29M) – No news, general weakness across the broader Copper sector today.
-5.3% Galan Lithium (GLN) – No news, general weakness across the broader Lithium sector today.
-5.3% Polymetals Resources (POL) – No news, general weakness across the broader Silver sector today.
Broker Moves
Life360 Inc (360)
Retained at buy at Citi; Price Target: $79.50 from $96.80
Aristocrat Leisure (ALL)
Retained at buy at Citi; Price Target: $71.00
Atlas Arteria (ALX)
Retained at hold at Morgans; Price Target: $4.74 from $5.05
AMP (AMP)
Initiated at neutral at Jarden; Price Target: $1.95 from $1.90
Eagers Automotive (APE)
Upgraded to buy from hold at Jefferies; Price Target: $29.50
Baby Bunting Group (BBN)
Upgraded to hold from trim at Morgans; Price Target: $2.70
CAR Group (CAR)
Retained at buy at Citi; Price Target: $42.55
Challenger (CGF)
Downgraded to neutral from overweight at Jarden; Price Target: $9.05 from $9.20
HUB24 (HUB)
Upgraded to buy from overweight at Jarden; Price Target: $123.90 from $127.00
Harvey Norman Holdings (HVN)
Retained at neutral at Macquarie; Price Target: $7.60
Insurance Australia Group (IAG)
Retained at equal-weight at Morgan Stanley; Price Target: $8.45 from $8.80
JB Hi-Fi (JBH)
Retained at outperform at Macquarie; Price Target: $121.00
Magellan Financial Group (MFG)
Downgraded to sell from neutral at Goldman Sachs; Price Target: $9.00 from $10.40
Nick Scali (NCK)
Retained at outperform at Macquarie; Price Target: $29.30
Newmont Corporation (NEM)
Retained at accumulate at Ord Minnett; Price Target: $160.00
Perpetual (PPT)
Retained at neutral at Citi; Price Target: $20.60 from $20.80
QBE Insurance Group (QBE)
Retained at overweight at Morgan Stanley; Price Target: $22.80 from $23.00
Rio Tinto (RIO)
Retained at neutral at Macquarie; Price Target: $130.00
Sigma Healthcare (SIG)
Retained at underperform at Macquarie; Price Target: $2.90
Superloop (SLC)
Retained at accumulate at Morgans; Price Target: $3.00 from $3.60
Suncorp Group (SUN)
Retained at overweight at Morgan Stanley; Price Target: $22.25 from $24.40
Telstra Group (TLS)
Retained at hold at Morgans; Price Target: $4.80
TPG Telecom (TPG)
Retained at accumulate at Morgans; Price Target: $4.20 from $5.50
Scans
Top Gainers
Code | Company | Last | % Chg |
|---|---|---|---|
| RAS | Ragusa Minerals Ltd | $0.045 | +66.67% |
| PL3 | Patagonia Lithium Ltd | $0.13 | +52.94% |
| WNX | Wellnex Life Ltd | $0.14 | +40.00% |
| OSX | Osteopore Ltd | $0.011 | +37.50% |
| KRR | King River Resources Ltd | $0.02 | +33.33% |
Top Fallers
Code | Company | Last | % Chg |
|---|---|---|---|
| EPN | Epsilon Healthcare Ltd | $0.031 | -16.22% |
| NYR | Nyrada Inc | $1.15 | -16.06% |
| CPO | Culpeo Minerals Ltd | $0.016 | -15.79% |
| JAT | Jatcorp Ltd | $0.145 | -14.71% |
| HYD | HYDRIX Ltd | $0.018 | -14.29% |
52 Week Highs
Code | Company | Last | % Chg |
|---|---|---|---|
| KRR | King River Resources Ltd | $0.02 | +33.33% |
| GW1 | Greenwing Resources Ltd | $0.049 | +22.50% |
| ETM | Energy Transition Minerals Ltd | $0.195 | +21.88% |
| XRA | Xenora Minerals Ltd | $0.30 | +20.00% |
| TVN | Tivan Ltd | $0.34 | +19.30% |
52 Week Lows
Code | Company | Last | % Chg |
|---|---|---|---|
| AHF | Australian Dairy Nutritionals Ltd | $0.029 | -12.12% |
| ODA | Orcoda Ltd | $0.05 | -10.71% |
| QEM | QEM Ltd | $0.015 | -6.25% |
| NVQ | Noviqtech Ltd | $0.019 | -5.00% |
| VGL | Vista Group International Ltd | $2.10 | -3.67% |
Near Highs
Code | Company | Last | % Chg |
|---|---|---|---|
| SMLL | Betashares Australian Small Companies Select ETF | $4.73 | +0.21% |
| DYM | Dynamic Metals Ltd | $0.49 | +4.26% |
| GLPR | iShares Ftse GBL Property Ex Aus (Aud Hedged) ETF | $26.85 | +0.98% |
| DFND | Vaneck Global Defence ETF | $42.78 | +1.98% |
| WVOL | iShares MSCI World Ex Aust Minimum Volatility ETF | $44.82 | +0.49% |
Relative Strength Index (RSI) Oversold
Code | Company | Last | % Chg |
|---|---|---|---|
| PME | Pro Medicus Ltd | $210.21 | -2.64% |
| SGP | Stockland | $5.53 | -0.72% |
| EPI | Epiminder Ltd | $0.935 | +2.75% |
| NWSLV | News Corporation | $37.25 | 0.00% |
| PXA | Pexa Group Ltd | $13.23 | -0.38% |
