
News | Market Wraps
Evening Wrap: ASX 200 smashed on US-Iran escalation, gold stocks plunge as EVN, NST and NEM each lose over 7%
The S&P/ASX 200 closed 124.8 points lower, down 1.43%.

Mentioned
The S&P/ASX 200 closed 124.8 points lower, down 1.43%.
The ASX 200 plunged as renewed US-Iran military exchanges — Iran claiming to have struck a US base after American forces hit targets near Bandar Abbas — sent oil surging and dashed hopes of an imminent peace deal. Gold stocks bore the heaviest selling, dragging heavily on a weaker materials sector.
Be sure to click/scroll through for the usual reporting of the major sector and stock-specific moves, the broker responses to them, as well as all the key economic data in tonight's Evening Wrap. Also, I have detailed technical analysis on the Nasdaq Composite and the S&P/ASX 200 in today's ChartWatch.
Let's dive in!
Today in Review
Thu 28 May 26, 4:58pm (AEST)
Name | Value | % Chg |
|---|---|---|
Major Indices | ||
| ASX 200 | 8,592.9 | -1.43% |
| All Ords | 8,819.6 | -1.40% |
| Small Ords | 3,423.6 | -1.44% |
| All Tech | 2,776.4 | -1.14% |
| Emerging Companies | 2,963.7 | -2.21% |
Currency | ||
| AUD/USD | 0.7122 | -0.26% |
US Futures | ||
| S&P 500 | 7,526.75 | -0.18% |
| Dow Jones | 50,691.0 | -0.07% |
| Nasdaq | 29,905.75 | -0.47% |
Name | Value | % Chg |
|---|---|---|
Sector | ||
| Consumer Staples | 11,725.3 | +0.25% |
| Consumer Discretionary | 3,505.9 | +0.15% |
| Energy | 10,427.9 | -0.29% |
| Communication Services | 1,647.6 | -0.48% |
| Utilities | 9,669.7 | -0.70% |
| Industrials | 8,039.2 | -0.77% |
| Real Estate | 3,559.6 | -0.94% |
| Health Care | 22,785.8 | -1.18% |
| Information Technology | 1,743.8 | -1.63% |
| Financials | 9,074.6 | -1.64% |
| Materials | 24,373.0 | -2.43% |
Markets
%20intraday%20chart_28%20May.png)
ASX 200 Session Chart
The S&P/ASX 200 (XJO) finished 124.8 points lower at 8,592.9, 1.4% from its session high and 0.4% from its low. Reflecting the poor performance at benchmark level, in the broader-based S&P/ASX 300 (XKO) advancers lagged decliners by a dismal 61 to 221.
Consumer Staples (XSJ) (+0.2%) was the session's only sector to finish meaningfully in the green, with defensive characteristics back in demand as risk appetite evaporated. Woolworths (WOW) (+0.9%), Bega Cheese (BGA) (+0.9%), and Coles (COL) (+0.7%) were all firmer.
Consumer Discretionary (XDJ) (+0.1%) eked a gain as analyst commentary after yesterday's CPI print appeared to sustain some residual optimism toward spending-sensitive stocks and an on-hold RBA. Wesfarmers (WES) (+1.2%) and Flight Centre (FLT) (+2.2%) carried the sector, but were insufficient to fully offset weakness elsewhere — as Myer (MYR) (-4.2%) and Breville Group (BRG) (-4.1%) lost ground.
Energy (XEJ) (-0.3%) was a notable underperformer relative to the oil price pop. ICE Brent crude futures gained 2.5% to US$94.60/bbl after Iran claimed to have struck the US airbase that launched the Bandar Abbas attacks — yet oil and gas stocks were broadly lower or flat. Only Karoon Energy (KAR) (+2.6%) managed a meaningful gain among the oil and gas names. Woodside Energy (WDS) (-0.2%) and Santos (STO) (-0.5%) both eased.
Seek (SEK) (-3.9%), CAR Group (CAR) (-1.5%), and REA Group (REA) (-1.1%) weighed on Communication Services. APA Group (APA) (-0.4%) and Origin Energy (ORG) (-0.6%) edged lower within Utilities. Lifestyle Communities (LIC) (-2.1%) and Lendlease (LLC) (-1.8%) were Real Estate's sharper fallers.
The Gold Sub-Index (XGD) (-7.4%) was the session's most severe casualty — by some distance. The equation has been consistent since the conflict began: oil surges, inflation fears reignite, benchmark bond yields climb, and the opportunity cost of holding zero-yielding gold rises sharply.
COMEX gold futures fell 0.7% to US$4,417/oz and COMEX silver futures plunged 1.8% to US$73.61/oz. Kingsgate Consolidated (KCN) (-10.5%), Genesis Minerals (GMD) (-10.2%), Perseus Mining (PRU) (-9.7%), Evolution Mining (EVN) (-7.8%), Northern Star Resources (NST) (-7.5%), and Newmont (NEM) (-7.2%) were all savaged.
Materials (XMJ) (-2.4%) saw recent base metals strength sharply unwound as the broader risk-off sentiment overrode the fundamental commodity price picture. COMEX copper futures fell 0.4% to US$6.316/lb. Sandfire Resources (SFR) (-4.0%), Rio Tinto (RIO) (-2.5%), South32 (S32) (-2.5%), Capstone Copper (CSC) (-2.5%), and BHP (BHP) (-1.2%) all retreated.
A select group of lithium stocks bucked the trend as GFEX lithium carbonate futures rebounded 3.4% to CNY 178,860/t — PMET Resources (PMT) (+3.0%), Liontown Resources (LTR) (+2.6%), Sunrise Energy Metals (SRL) (+3.7%), Vulcan Energy Resources (VUL) (+2.2%), and Pilbara Minerals (PLS) (+0.3%) all gained.
Financials (XFJ) (-1.6%) extended Wednesday's weakness — conspicuous for the second day running given that improved domestic rate expectations should logically support the sector. The persistence of selling despite a more favourable macro backdrop suggests active fund outflows. Commonwealth Bank (CBA) (-2.1%), ANZ (ANZ) (-1.9%), National Australia Bank (NAB) (-1.7%), and QBE Insurance (QBE) (-2.8%) all fell.
Information Technology (XIJ) (-1.6%) failed to track its US counterparts, which rose overnight driven by the Nvidia results. High-P/E, long-duration growth stocks found little tolerance in the session's risk-off tone. Technology One (TNE) (-3.0%), Xero (XRO) (-2.6%), and WiseTech Global (WTC) (-1.5%) were all lower.
Health Care (XHJ) (-1.2%) resumed its losing ways. CSL (CSL) (-1.7%) extended its multi-week decline — notably, the company's CEO Gordon Naylor bought 1,100 shares for approximately $108,000 earlier this week. Telix Pharmaceuticals (TLX) (-4.1%) and ResMed (RMD) (-1.4%) were also lower.
Today's best ASX Top 300 gainers
Company | Last Price | Change $ | Change % | 1mo % | 1yr % |
|---|---|---|---|---|---|
Siteminder (SDR) | $3.28 | +$0.26 | +8.6% | +7.9% | -29.0% |
Select Harvests (SHV) | $3.90 | +$0.28 | +7.7% | +2.6% | -13.5% |
Centuria Capital (CNI) | $1.920 | +$0.115 | +6.4% | +13.9% | +16.0% |
Dicker Data (DDR) | $10.23 | +$0.55 | +5.7% | +14.0% | +25.4% |
Web Travel (WEB) | $2.54 | +$0.11 | +4.5% | -5.6% | -50.9% |
Electro Optic Systems (EOS) | $9.58 | +$0.39 | +4.2% | -6.4% | +485.9% |
Polynovo (PNV) | $1.255 | +$0.05 | +4.1% | +24.3% | -2.7% |
Sunrise Energy Metals (SRL) | $15.85 | +$0.56 | +3.7% | +27.9% | +3673.8% |
James Hardie Industries (JHX) | $30.95 | +$0.99 | +3.3% | +1.2% | -10.8% |
Sims (SGM) | $25.89 | +$0.82 | +3.3% | +25.0% | +70.6% |
Bravura Solutions (BVS) | $2.30 | +$0.07 | +3.1% | +12.2% | -4.4% |
PMET Resources (PMT) | $0.680 | +$0.02 | +3.0% | +12.4% | +189.4% |
Liontown (LTR) | $2.33 | +$0.06 | +2.6% | -4.1% | +285.1% |
Karoon Energy (KAR) | $2.00 | +$0.05 | +2.6% | -6.5% | +20.1% |
Bapcor (BAP) | $0.410 | +$0.01 | +2.5% | -25.5% | -89.1% |
Tyro Payments (TYR) | $0.845 | +$0.02 | +2.4% | +13.4% | -4.5% |
Vulcan Energy Resources (VUL) | $3.64 | +$0.08 | +2.2% | -7.8% | +6.9% |
Flight Centre Travel (FLT) | $10.10 | +$0.22 | +2.2% | -1.6% | -24.4% |
Spark New Zealand (SPK) | $1.615 | +$0.035 | +2.2% | -3.6% | -21.6% |
Regal Partners (RPL) | $2.60 | +$0.05 | +2.0% | +9.7% | +21.5% |
Today's worst ASX Top 300 losers
Company | Last Price | Change $ | Change % | 1mo % | 1yr % |
|---|---|---|---|---|---|
Kingsgate Consolidated (KCN) | $5.86 | -$0.69 | -10.5% | -8.7% | +185.9% |
Genesis Minerals (GMD) | $5.57 | -$0.63 | -10.2% | -12.3% | +23.2% |
Eagers Automotive (APE) | $20.55 | -$2.21 | -9.7% | -13.6% | +17.5% |
Perseus Mining (PRU) | $4.86 | -$0.52 | -9.7% | -13.1% | +27.2% |
Turaco Gold (TCG) | $0.495 | -$0.045 | -8.3% | -18.2% | +5.3% |
Ora Banda Mining (OBM) | $1.270 | -$0.115 | -8.3% | -10.2% | +19.2% |
Alkane Resources (ALK) | $1.400 | -$0.125 | -8.2% | -9.4% | +86.7% |
Capricorn Metals (CMM) | $13.43 | -$1.19 | -8.1% | +13.8% | +43.0% |
Ramelius Resources (RMS) | $3.11 | -$0.27 | -8.0% | -13.4% | +9.9% |
Black Cat Syndicate (BC8) | $1.100 | -$0.095 | -8.0% | -3.5% | +38.4% |
Regis Resources (RRL) | $5.87 | -$0.5 | -7.8% | -17.8% | +18.8% |
Austal (ASB) | $3.92 | -$0.33 | -7.8% | -8.2% | -27.4% |
Evolution Mining (EVN) | $11.65 | -$0.98 | -7.8% | -7.3% | +31.5% |
Resolute Mining (RSG) | $1.190 | -$0.1 | -7.8% | -2.1% | +95.1% |
Catalyst Metals (CYL) | $4.96 | -$0.41 | -7.6% | -12.2% | -19.5% |
Pantoro Gold (PNR) | $2.91 | -$0.24 | -7.6% | -11.0% | -14.9% |
Northern Star Resources (NST) | $18.20 | -$1.47 | -7.5% | -15.7% | -10.5% |
Emerald Resources (EMR) | $5.60 | -$0.44 | -7.3% | -8.6% | +22.0% |
Bellevue Gold (BGL) | $1.465 | -$0.115 | -7.3% | -8.2% | +54.2% |
ChartWatch
Nasdaq Composite Index
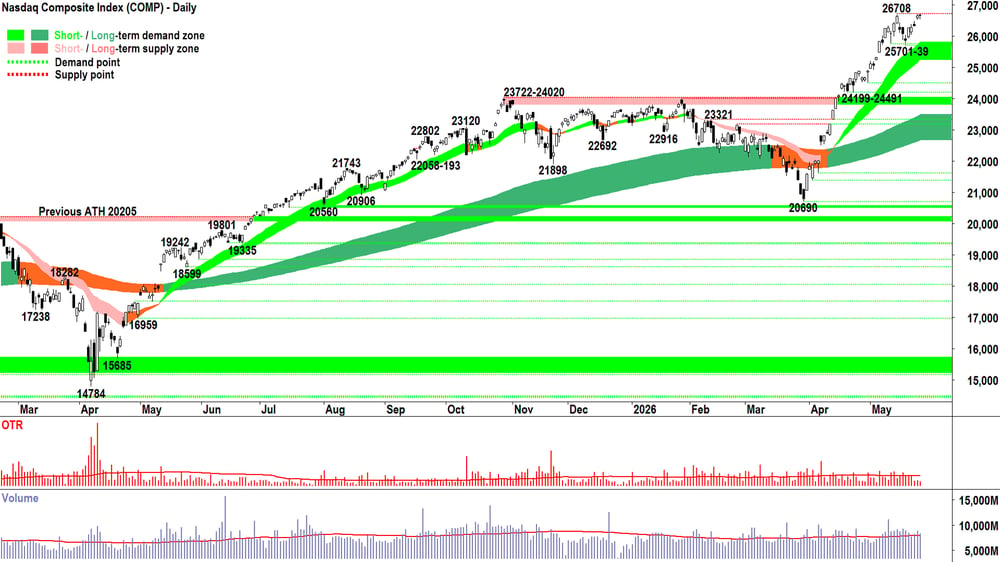
Analysis
Miniscule candle, downward pointing shadow, slightly above average volume.
Translation:
Miniscule candle = neither party was able to control the price, motivation to transact at substantially higher/lower prices questionable.
Downward pointing shadow = BTD. The demand side was slightly more motivated than the supply side, choosing to buy into minor dip at the open.
Above average volume = interest is above average from both parties, above average demand looking to enter versus above average supply looking to exit.
The above candle characteristics are more consistent with equilibrium than a strong demand side market — which one could interpret as a not-so-good thing for the Comp…
But — and this bit is far more important: it’s one candle. It’s neither here nor there, sure, but just about everything before it and down to 20690 is consistent with strong demand side control.
There’s nothing in the chart above that suggests to me that the supply side has taken control of the Comp’s price in the short term:
✅ Short- and long-term trends: ⬆️/⬆️ + price > trend ribbons + trend ribbons acting as zones of dynamic excess demand
✅ Price action remains rising peaks and rising troughs 📈 + strong motive phases compared to stagnation phases
✅ Candles remain predominantly demand side in nature (i.e., white-bodied and or downward pointing shadows) ⬜🕯️
As the above ✅ turn to ❌, we'll know that the balance between demand and supply is changing. In the meantime, no change to my prevailing portfolio risk position.
(I wrote the above analysis early this morning before shenanigans kicked off again in the Middle East — sending local stocks into a tailspin and dragging Comp futures down around 150 points or 0.5% at the time of writing. Do I need to change anything? Nope! The future is unknown and I can't analyse candle(s) I can't see! 🙈)
View
FRP (RP = Risk Position — it reflects my personal allowable capital allocation limit for my investments in US stocks. So 1/2RP is 50%, 2/3RP is 67% and FRP is 100% 🪣).
Key levels
26708 is the key point of supply. 25739 is the closest point of demand, then there's the short term uptrend ribbon (presently 25248-25811). If the price closes back below this range, the supply-side is very likely back in control of the Comp's price.
S&P/ASX 200 (XJO)
%20chart_28%20May.png)
Analysis
To quote my analysis from yesterday: "This could be it: the beginning of the OTP’s great resurgence! 🚀 "
Um... Turns out: Nope! Remember yesterday's little train that could... well it 💥🚂!
Oh OTP, what a train wreck 💥🚂!
And this is exactly what 1/3RP represents: a price action environment that demonstrates little-to-no consensus that investors want to own stocks — not from the demand side who presently holds cash (preferring its relative safety) nor from the supply side who owns stocks (also preferring cash's relative safety).
It's that simple. If the smartest money in the world doesn't want to be invested in Aussie stocks right now, then why should we? 🤷
Anyways. There's really nothing for me to do here: Big black candle, another test and failure at the dynamic excess supply in the trend ribbons... It's kinda textbook stuff...
But I guess it all depends on which text book you've been reading! 😉
View
Calling markets shouldn't be this easy! I remain 1/3RP 🪣 on the OTP (i.e., my personal allowable capital allocation limit for my investments in Australian stocks is 33%).
Key levels
The short- and long-term trend ribbons (presently 8677-8740) combine to represent the key zone of supply. Beyond that, it's the not so lucky 8888 level! Demand is the 8262-8379 zone. Below that... 😱!
(Glossary of acronyms! Old Tin Pot (OTP): S&P/ASX 200 | MOTN: More Often Than Not | FOMO: Fear Of Missing Out | HOFU: Holding On For Upside | BTD: Buy The Dip | STR: Sell The Rally | RP: Risk Position)
ChartWatch *LIVE* Webinar
ChartWatch *LIVE* Webinars – WEEKLY Wednesday's @ 12pm AEDT
Learn more about technical analysis and trend following through real case studies on ASX stocks. Australia's premier technical analyst, Carl Capolingua, shares his unique insights on stocks as requested by viewers. Ask about a company in your portfolio or anything related to trading and investing and get Carl's expert opinion.
Places are limited so >REGISTER NOW!<
Economy
Today
AUS April Household Spending
Result: -1.1% m/m vs -0.3% m/m forecast and +1.6% m/m previous (i.e., down and much worse than expected!)
Later this week
Thursday
20:30 USA April Personal Consumption Expenditures (PCE)
PCE Index: +0.3% m/m forecast vs +0.3% m/m previous
Personal Income: +0.4% m/m forecast vs +0.6% m/m previous
Personal Spending: +0.5% m/m forecast vs +0.9% m/m previous
20:30 USA March Quarter Preliminary GDP (+2.1% p/.a forecast vs +0.7% p.a. previous)
20:30 USA April Core Durable Goods Orders (+0.5% m/m forecast vs +0.9% m/m previous)
22:00 USA April New Home Sales (661,000 forecast vs 682,000 previous)
Friday
09:30 AUS April Private Sector Credit (+0.6% m/m forecast vs +0.7% m/m previous)
Latest News
Interesting Movers
Trading higher
+8.6% Siteminder (SDR) - struck a partnership with hotel property management platform Mews, embedding its distribution engine directly into Mews's PMS; the structure allows Mews to integrate SiteMinder's channel management and revenue products natively, potentially expanding SiteMinder's reach while retaining economics on existing accounts.
+6.4% Centuria Capital Group (CNI) - issued a trading update that was received positively by the market.
+4.2% Electro Optic Systems (EOS) - appointed former air vice-marshal Catherine Roberts and former major-general Kathryn Toohey as non-executive directors from June 1, adding senior military, procurement, and governance experience to the board as the company expands its defence and space systems operations.
+2.2% Vulcan Energy Resources (VUL) - completed close on its €2.2 billion Lionheart Project financing package, clearing the way for full access to funding for the construction of its flagship lithium and renewable energy development in Germany.
Trading lower
-9.7% Eagers Automotive (APE) - several investment banks cut price targets following the company's AGM presentation and outlook statements delivered yesterday, with Jarden downgrading to Neutral from Overweight and cutting its price target to $23.90 from $25.25.
-7.8% Austal (ASB) - formalised Gene Miller as president of its US business, confirming his appointment after he had served as interim president since February; the stock fell on the day, though the market's reaction appeared to reflect broader risk-off sentiment rather than the appointment itself.
-4.6% Champion Iron (CIA) - FY26 revenue fell C$10.8 million to C$414.5 million as a stronger Canadian dollar offset a higher average net realised selling price in US dollars, with net income of C$23.2 million for the March quarter down from C$39.1 million in the prior corresponding period.
-1.9% Immutep (IMM) - pooled analysis of five clinical studies found its lead drug efti was associated with increased immune activity and improved survival outcomes when combined with standard cancer treatments across 5,922 patients; the stock fell despite the positive clinical findings.
-1.3% IPH (IPH) - appointed former PwC legal leader Tony O'Malley as chief executive from July 1, replacing Andrew Blattman who will remain until November to support the transition.
Broker Moves
AGL Energy (AGL)
Retained at buy at UBS; Price Target: $10.40 from $11.00
Eagers Automotive (APE)
Retained at buy at Bell Potter; Price Target: $28.75 from $29.25
Retained at buy at Canaccord Genuity; Price Target: $30.50
Downgraded to neutral from overweight at Jarden; Price Target: $23.90 from $25.25
Retained at outperform at Macquarie; Price Target: $27.10 from $30.70
Upgraded to buy from hold at Moelis Australia; Price Target: $26.35 from $28.37
Retained at overweight at Morgan Stanley; Price Target: $30.00
Retained at buy at Morgans; Price Target: $27.25 from $30.00
Retained at buy at Ord Minnett; Price Target: $29.00 from $31.00
Retained at neutral at UBS; Price Target: $28.60
Brambles (BXB)
Retained at buy at Ord Minnett; Price Target: $24.50
Centuria Capital Group (CNI)
Retained at overweight at Morgan Stanley; Price Target: $2.05
Dalrymple Bay Infrastructure (DBI)
Retained at buy at UBS; Price Target: $5.75
Dicker Data (DDR)
Retained at neutral at Macquarie; Price Target: $10.35
Retained at equal-weight at Morgan Stanley; Price Target: $10.30
Retained at buy at UBS; Price Target: $11.20
Endeavour Group (EDV)
Retained at outperform at CLSA; Price Target: $3.80 from $4.50
Retained at underweight at Jarden; Price Target: $3.10 from $3.20
Retained at underweight at JPMorgan; Price Target: $3.00 from $3.10
Retained at underperform at Macquarie; Price Target: $2.80
Retained at equal-weight at Morgan Stanley; Price Target: $3.20 from $3.70
Retained at lighten at Ord Minnett; Price Target: $2.60 from $2.90
Retained at neutral at UBS; Price Target: $3.25 from $3.45
Elevra Lithium (ELV)
Retained at buy at Canaccord Genuity; Price Target: $18.30 from $16.50
Greatland Resources (GGP)
Initiated at buy at UBS; Price Target: $16.50
Golden Horse Minerals (GHM)
Retained at speculative buy at Canaccord Genuity; Price Target: $1.50
Galan Lithium (GLN)
Retained at speculative buy at Canaccord Genuity; Price Target: $0.80 from $0.70
GenusPlus Group (GNP)
Retained at buy at Bell Potter; Price Target: $12.00 from $10.50
GPT Group (GPT)
Retained at overweight at Morgan Stanley; Price Target: $5.83
Medibank Private (MPL)
Retained at neutral at Macquarie; Price Target: $4.80
NIB Holdings (NHF)
Retained at underperform at Macquarie; Price Target: $6.10
Nufarm (NUF)
Retained at buy at Bell Potter; Price Target: $3.60
Retained at neutral at Citi; Price Target: $2.95
Retained at neutral at Macquarie; Price Target: $3.00 from $2.70
Retained at buy at Morgans; Price Target: $4.15 from $4.05
Upgraded to buy from neutral at UBS; Price Target: $3.50 from $2.80
Neurizon Therapeutics (NUZ)
Retained at speculative buy at Morgans; Price Target: $0.20 from $0.28
Origin Energy (ORG)
Retained at buy at UBS; Price Target: $13.60 from $13.80
Ramsay Health Care (RHC)
Retained at neutral at UBS; Price Target: $42.90
Scentre Group (SCG)
Retained at overweight at Morgan Stanley; Price Target: $4.41
SiteMinder (SDR)
Retained at buy at Citi; Price Target: $6.60
Santos (STO)
Retained at buy at UBS; Price Target: $8.60
Trajan Group Holdings (TRJ)
Retained at buy at Bell Potter; Price Target: $0.75 from $1.05
Vulcan Energy Resources (VUL)
Retained at speculative buy at Canaccord Genuity; Price Target: $10.75
WEB Travel Group (WEB)
Retained at buy at Canaccord Genuity; Price Target: $5.30
Retained at buy at Citi; Price Target: $3.70 from $3.90
Downgraded to neutral from positive at E&P; Price Target: $3.81
Retained at hold at Jefferies; Price Target: $2.70 from $3.10
Retained at overweight at JPMorgan; Price Target: $4.85 from $6.00
Upgraded to buy from accumulate at Morgans; Price Target: $3.75 from $5.20
Retained at buy at Ord Minnett; Price Target: $4.82 from $6.15
Retained at outperform at RBC Capital Markets; Price Target: $6.00
Retained at buy at UBS; Price Target: $4.60 from $5.25
Scans
Top Gainers
Code | Company | Last | % Chg |
|---|---|---|---|
| IMC | Immuron Ltd | $0.044 | +37.50% |
| FEG | Far East Gold Ltd | $0.12 | +33.33% |
| ECT | Environmental Clean Technologies Ltd | $0.125 | +30.21% |
| ACR | ACRUX Ltd | $0.013 | +30.00% |
| TRJ | Trajan Group Holdings Ltd | $0.34 | +28.30% |
Top Fallers
Code | Company | Last | % Chg |
|---|---|---|---|
| BTN | Butn Ltd | $0.014 | -33.33% |
| PFT | Pure Foods Tasmania Ltd | $0.023 | -23.33% |
| TR8 | Tarrina Resources Ltd | $0.015 | -21.05% |
| LIS | Li-S Energy Ltd | $0.135 | -18.18% |
| BPG | Black Pearl Group Ltd | $0.525 | -16.00% |
52 Week Highs
Code | Company | Last | % Chg |
|---|---|---|---|
| CF1 | Complii Fintech Solutions Ltd | $0.032 | +23.08% |
| CUF | Cufe Ltd | $0.067 | +9.84% |
| RMI | Resource Minerals International Ltd | $0.082 | +6.49% |
| EDU | EDU Holdings Ltd | $1.00 | +5.26% |
| SRL | Sunrise Energy Metals Ltd | $15.85 | +3.66% |
52 Week Lows
Code | Company | Last | % Chg |
|---|---|---|---|
| BTN | Butn Ltd | $0.014 | -33.33% |
| TR8 | Tarrina Resources Ltd | $0.015 | -21.05% |
| BPG | Black Pearl Group Ltd | $0.525 | -16.00% |
| SLA | Solara Minerals Ltd | $0.10 | -13.04% |
| NOV | Novatti Group Ltd | $0.016 | -11.11% |
Near Highs
Code | Company | Last | % Chg |
|---|---|---|---|
| WVOL | iShares MSCI World Ex Aust Minimum Volatility ETF | $44.78 | +0.13% |
| EGH | Eureka Group Holdings Ltd | $0.585 | +0.86% |
| IAGPF | Insurance Australia Group Ltd | $105.09 | -0.57% |
| VVLU | Vanguard Global Value Equity Active ETF | $80.30 | +0.34% |
| IHD | iShares S&P/ASX DIV Opportunities Esg Screened ETF | $17.11 | -1.21% |
Relative Strength Index (RSI) Oversold
Code | Company | Last | % Chg |
|---|---|---|---|
| PMGOLD | Gold Corporation | $61.22 | -1.78% |
| TUA | Tuas Ltd | $2.09 | -0.95% |
| MIR | Mirrabooka Investments Ltd | $2.40 | 0.00% |
| DGL | DGL Group Ltd | $0.34 | +1.49% |
| ASX | ASX Ltd | $45.31 | -1.63% |
