News | Market Wraps
Evening Wrap: ASX 200 slips as gold sector surges to new high, PDN +13% on quarterly update
The S&P/ASX 200 closed 33 points lower, down 0.37%.

Mentioned
The S&P/ASX 200 closed 33 points lower, down 0.37%.
Investors' nerves were rattled today, as the ASX 200 slipped for the third session in a row. Financials (XFJ) led the losses, alongside ongoing softness in Tech (XTX) (-4.3%), Telcos (XTJ) (-2.4%) and Consumer Discretionary (XDJ) (-2.1%).
The bull market in gold stocks continues as the yellow metal surpassed US$4,865.07/oz to reach historic highs. That wasn’t the case for copper miner 29Metals (29M), though, which sank 30% after completing its institutional offer, even as the Resources (XJR) sector climbed 2.5%.
Paladin Energy (PDN) jumped 13.1% to a 52 week high due to a 16% increase in uranium production, as reported in the company's quarterly update.
Be sure to click/scroll through for the usual reporting of the major sector and stock-specific moves, the broker responses to them, as well as all the key economic data in tonight's Evening Wrap.
Also, I have detailed technical analysis on the Nasdaq Composite and the S&P/ASX 200 in today's ChartWatch.
Let's dive in!
Today in Review
Wed 21 Jan 26, 5:56pm (AEST)
Name | Value | % Chg |
|---|---|---|
Major Indices | ||
| ASX 200 | 8,782.9 | -0.37% |
| All Ords | 9,108.6 | -0.33% |
| Small Ords | 3,964.4 | +0.62% |
| All Tech | 3,214.8 | -2.40% |
| Emerging Companies | 3,421.1 | +1.28% |
Currency | ||
| AUD/USD | 0.6745 | +0.12% |
US Futures | ||
| S&P 500 | 6,853.75 | +0.36% |
| Dow Jones | 48,751.0 | +0.17% |
| Nasdaq | 25,223.25 | +0.37% |
Name | Value | % Chg |
|---|---|---|
Sector | ||
| Materials | 23,282.1 | +2.50% |
| Utilities | 9,551.1 | +0.99% |
| Energy | 8,705.2 | +0.89% |
| Health Care | 33,911.8 | -0.56% |
| Consumer Staples | 11,645.7 | -0.69% |
| Industrials | 8,445.3 | -1.19% |
| Communication Services | 1,696.2 | -1.26% |
| Real Estate | 3,866.3 | -1.58% |
| Financials | 8,983.2 | -1.58% |
| Consumer Discretionary | 3,938.3 | -2.14% |
| Information Technology | 2,026.9 | -2.50% |
Markets
%20intraday%20chart_21%20Jan.png)
ASX 200 Session Chart
The S&P/ASX 200 (XJO) finished 33 points lower at 8,782.9, 0.38% from its session high and 0.19% from its low. Reflecting the tough going at index level, in the broader-based S&P/ASX 300 (XKO) decliners outnumbered advancers by 177 to 102.
Fund flows: Right way up... for some! 🤦
If yesterday was upside down day, today was definitely back to the right way up. The funds played their favourites, and flayed most-else…
Winner Sectors (cyclical, short duration)
Gold Sub-Index (XGD) (+4.8%)
Resources (XJR) (+2.4%)
Loser Sectors (high-PE, growth, long duration)
Health Care (XHJ) (-0.6%)
Communication Services (XTJ) (-1.3%)
Consumer Discretionary (XDJ) (-2.1%)
Information Technology (XIJ) (-2.5%)
Swinger Sectors* (bond proxies)
Financials (XFJ) (-1.6%)
Real Estate (XPJ) (-1.6%)
Global markets went risk off Tuesday, but for certain stocks in certain sectors, it didn’t really matter. Trends extended — and the trend of favouring Resources stocks (particularly defensive gold) over high-PE stocks remains firmly intact.
So, we get a situation where BHP Group (BHP) (+1.5%), Rio Tinto (RIO) (+2.6%), Fortescue (FMG) (+1.7%) rally despite lower iron ore prices in Singapore — because they’re “in the basket” of stocks on the big funds’ shopping list.
I’m not saying they shouldn’t go up just because the iron ore price is down, simply that the usual narratives that finance journos use in their evening wraps to attempt to explain why certain stocks were up or down, don’t apply right now: they’re being swamped by global fund flows. 🌊🌊🌊
The tech-wreck continued — much to my delight. I know, that sounds terrible, but sorry… I can’t help but pat myself on the back for my countless calls of downtrends in this sector in ChartWatch ASX Scans. Discretionary is rapidly becoming the “next tech”, and again, countless calls there also (see JB Hi-Fi (JBH) (-3.5%) below — first a Feature Downtrend (i.e., highest conviction) on 6-Nov 2025 at a candle close of $97.65).
%20chart_21%20Jan.png)
Chart: JB Hi-Fi (JBH)
My greatest fear resulting from the events of today / this week, is that Financials is no longer our Swinger Sector, but after today — it's a confirmed member of the Loser Sectors… ⚠️🚨
Stock Specific: From Swinger to Loser?
Swinger or Loser? 🤔
It’s a close call looking at the XFJ chart below… but if I focus solely on my technical model, I’m going with an early call of “Loser”. A close below the 4-Dec 2025 trough low of 8866 would likely seal the deal, but in the meantime, I note:
Neutral (amber) short- and long-term trend ribbons = ⚠️⚠️
Mixed price action, but decisively for me, a close below the 8-Jan and 14-Jan points of demand = ⚠️
Increasingly supply-side control-oriented candles (today’s is a damning signal that supply is growing more motivated = ⚠️
Volume is benign though… more a reflection of a demand-side vacuum than an overwhelming (so far) wall of supply. Price action speaks to the supply-side’s motivation, but the lack of substantial volume suggests they’re finding few targets on the demand-side to hit…
%20chart_21%20Jan.png)
Chart: S&P/ASX200 Financials Sector Index (XFJ)
But, the XFJ chart is somewhat deceiving!!! We know that it's dominated by the sector’s and the ASX’s largest stock: Commonwealth Bank of Australia (CBA) (-2.2%). Just how much of the XFJ’s growing Loser status can be attributed to CBA? You tell me…
%20chart_21%20Jan.png)
Chart: Commonwealth Bank of Australia (CBA)
Remember: My technical model doesn’t predict trends, it follows them. The absolute low of the current CBA short term downtrend could be today’s candle — and my model may not realise it for weeks (until it has the requisite trend ribbons, price action, candles, volume!)
All I can say, is that my model looks at the above CBA chart and outputs: “Price ⬇️ MOTN”. That’s it.
But it means CBA will again earn the dubious honour of Feature Downtrend in tomorrow’s edition of ChartWatch ASX Scans — an honour it’s earned 5 times since featuring as a downtrend on 18-Sep 2005 at $164.33 (of 9 appearances since that date!).
Tomorrow is another day.
Today's best blue chip gainers
Company | Last Price | Change $ | Change % | 1mo % | 1yr % |
|---|---|---|---|---|---|
Evolution Mining (EVN) | $14.79 | +$1.28 | +9.5% | +18.1% | +164.1% |
Lynas Rare Earths (LYC) | $16.27 | +$1.02 | +6.7% | +31.7% | +129.5% |
Newmont Corp. (NEM) | $180.80 | +$8.53 | +5.0% | +21.7% | +170.3% |
Ramelius Resources (RMS) | $4.83 | +$0.22 | +4.8% | +27.8% | +106.4% |
PLS Group (PLS) | $4.95 | +$0.21 | +4.4% | +25.6% | +107.1% |
Perseus Mining (PRU) | $6.31 | +$0.24 | +4.0% | +13.5% | +130.3% |
Genesis Minerals (GMD) | $7.85 | +$0.23 | +3.0% | +14.1% | +169.8% |
Dyno Nobel (DNL) | $3.45 | +$0.1 | +3.0% | +8.8% | +15.0% |
Rio Tinto (RIO) | $150.10 | +$3.76 | +2.6% | +5.1% | +26.4% |
IGO (IGO) | $9.21 | +$0.22 | +2.4% | +21.3% | +73.1% |
Mineral Resources (MIN) | $61.55 | +$1.38 | +2.3% | +17.2% | +66.1% |
Sandfire Resources (SFR) | $19.37 | +$0.43 | +2.3% | +13.7% | +96.3% |
Northern Star Resources (NST) | $28.59 | +$0.61 | +2.2% | +7.0% | +63.8% |
Capricorn Metals (CMM) | $15.71 | +$0.32 | +2.1% | +10.9% | +119.1% |
Fortescue (FMG) | $22.64 | +$0.38 | +1.7% | +0.1% | +17.8% |
BHP Group (BHP) | $48.48 | +$0.7 | +1.5% | +8.0% | +21.0% |
Medibank Private (MPL) | $4.70 | +$0.06 | +1.3% | -1.7% | +24.0% |
Today's worst blue chip losers
Company | Last Price | Change $ | Change % | 1mo % | 1yr % |
|---|---|---|---|---|---|
Telix Pharmaceuticals (TLX) | $10.61 | -$0.88 | -7.7% | -10.2% | -60.1% |
Xero (XRO) | $98.90 | -$5.37 | -5.2% | -12.5% | -41.1% |
Pro Medicus (PME) | $178.37 | -$8.18 | -4.4% | -17.0% | -28.3% |
AMP (AMP) | $1.725 | -$0.075 | -4.2% | -5.0% | +6.8% |
Seek (SEK) | $22.15 | -$0.87 | -3.8% | -4.0% | +0.5% |
JB HI-FI (JBH) | $85.00 | -$3.05 | -3.5% | -8.5% | -6.9% |
A2 Milk Company (A2M) | $8.09 | -$0.28 | -3.3% | -9.4% | +39.2% |
Suncorp Group (SUN) | $16.47 | -$0.52 | -3.1% | -6.3% | -14.6% |
Pinnacle Investment (PNI) | $17.48 | -$0.55 | -3.1% | +8.0% | -26.2% |
Technology One (TNE) | $26.26 | -$0.82 | -3.0% | -5.0% | -8.2% |
Amcor PLC (AMC) | $62.01 | -$1.75 | -2.7% | -2.2% | -21.0% |
SGH (SGH) | $45.96 | -$1.28 | -2.7% | -0.3% | 0.0% |
Wesfarmers (WES) | $81.12 | -$2.21 | -2.7% | +0.5% | +16.2% |
Light & Wonder (LNW) | $169.79 | -$4.58 | -2.6% | +15.9% | +18.2% |
Block (XYZ) | $93.13 | -$2.42 | -2.5% | -4.0% | -33.1% |
REA Group (REA) | $181.61 | -$4.55 | -2.4% | -2.1% | -21.1% |
Stockland (SGP) | $5.37 | -$0.13 | -2.4% | -8.5% | +6.3% |
Wisetech Global (WTC) | $62.02 | -$1.5 | -2.4% | -8.8% | -46.1% |
Vicinity Centres (VCX) | $2.51 | -$0.06 | -2.3% | -0.8% | +17.3% |
Commonwealth Bank of Australia (CBA) | $147.22 | -$3.26 | -2.2% | -5.0% | -4.3% |
ChartWatch
Nasdaq Composite Index
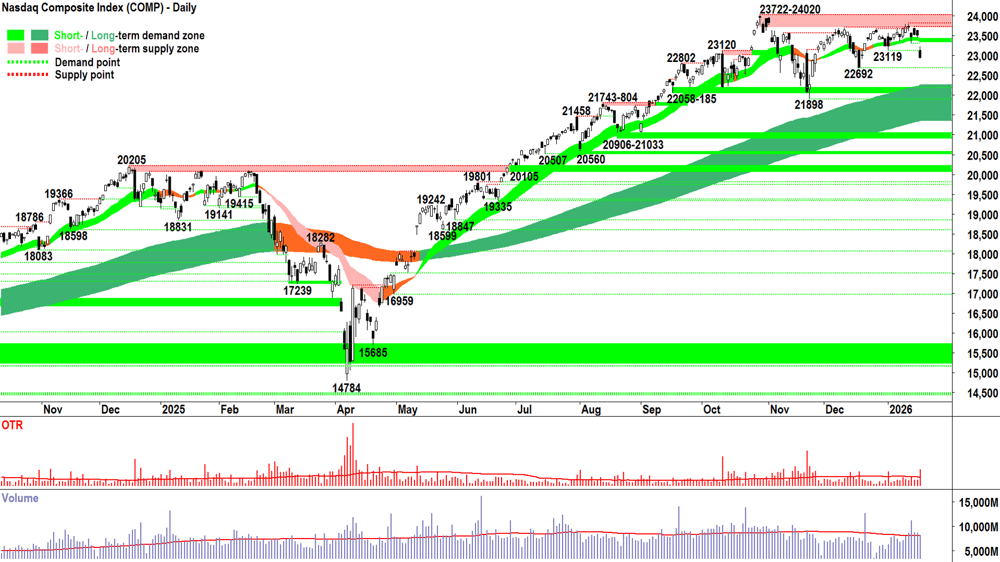
Analysis
What do they say about the best laid plans of mice and men? 🤔
Something about: When Trump’s about… they get thrown out!? 😁
What can I say? No chart, or the entire field of technical analysis for that matter, is impervious to news.
News = “new information” that was not factored into the market price.
Certain news items will have a very small impact on the balance between demand and supply, while other news items will have a very big impact.
The future is unknown — prediction is futile!
The best a trend follower can do (note the word “follower” — not “prognosticator”), is assess the price action and volume before them. Then, they attach to that data a set of probabilities for certain outcomes (e.g. in the broadest sense: ⬆️ or ↔️ or ⬇️) — and as a result, apply their risk based upon the outcome they expect to occur MOTN (i.e., More Often Than Not).
Analyse. Accept. Act.
Make one’s call + Manage one’s risk + Repeat ♾️.
Or, at least, that’s how I like to do it.
There’s no crystal ball. 🔮 Not one that works, anyway!
Stuff (insert a different “s” word here if you prefer!) is going to happen. Get used to it. Get used to dealing with “stuff”.
And on that note, we pivot to the wonderful chart above of the Comp. Hmmm…. What to do now!? 🤦
The “rock and the hard place” analogy we had been running with before the substantial escalation of the Trump vs Greenland news over the weekend (don’t forget there wasn’t any trading on Monday due to a public holiday), has caused a substantial shift in the demand-supply balance for risky assets like stocks.
The “rock” of rising demand in the form of the short term uptrend ribbon, and indeed of rising troughs in 22692 and 23119, has cracked. Tuesday’s gap-and-run supply-side candle (i.e., black-bodied and with an upward pointing shadow, close near the low of the session), suggests a new environment of short term excess supply.
The “hard place”, i.e., the well-defined supply zone near the 24020 all-time high, appears to have grown in stature with another peak set at Thursday’s high of 23722.
It may be a long time before we get another crack at it.
Candles and price action suggest the demand-side is on strike — preferring to wait for calmer seas and better visibility before standing in the way of what is clearly some motivated supply.
Average volume suggests more of a demand-side vacuum than a wholesale wall of motivated supply.
In my experience, the MOTN outcome post-Tuesday’s price action is a further decline. 22692 comes into focus — it needs to hold for the demand-side to retain any semblance of control over short term prices.
Below 22692, is the dynamic demand of the long term uptrend ribbon — below there and we’re in end of bull market kind of “stuff”.
Markets have dealt with crazier “stuff” than what’s going on now, but that doesn’t mean things can’t and won’t get worse. I propose to remain alert but not alarmed, to pare risk exposure accordingly, but most importantly, to not lose sight of the longer term trend: which remains ⬆️.
View
I am on hold for the addition of new long-side portfolio risk, but officially, remain at my 2/3RP portfolio risk limit 🪣 (RP = Risk Position — it reflects my personal allowable capital allocation limit for my investments in US stocks. So 1/2RP is 50%, 2/3RP is 67% and FRP is 100%). A close below 22692 would trigger a move to 1/2RP.
Key levels
The next point of demand is 22692. If the Comp closes below that price, we can assume the supply side is in control. On a close below 21898 the short term trend is unequivocally down and the long term uptrend is likely under significant pressure = ⚠️. 23722-24020 is the nearest critical zone of supply — the Comp must close within this zone with a strong demand-side candle to confirm the demand-side is unequivocally back in control of the Comp's price.
S&P/ASX 200 (XJO)
%20chart_21%20Jan.png)
Analysis
Given the Comp analysis above, you could say that we got away relatively unscathed today.
Sure, not a fantastic candle, but it ain’t no gap and run / black body / upward pointing shadow / close near the low.
To be fair though, we’ve had two extra candles to try to impart news information into local prices. Today’s candle is not the full response, Monday’s, Tuesday’s, and today’s candles are…
I am comforted by the fact the long term uptrend ribbon still holds, but I do note that we’ve closed below the balance point (i.e., halfway retracement point) of the 8675-8916 move. Ideally that doesn’t happen in strong short term uptrends — but hey — we’re still well above 8675, aren’t we!?
This means the price action remains intact (i.e., rising peaks and rising troughs). The same cannot be said for our Comp cousin.
Volume was subdued — I don’t think one could argue there’s a great deal of panic around just yet.
In the absence of such panic and given the short term technicals are still half-decent and the long term technicals are decent-decent — then I choose to stay the course here. Obviously, with elevated levels of concern, and obviously, watching very closely for continued signs the supply-side is moving back in to take control of the OTP’s price.
View
I remain comfortable at 2/3RP 🪣 (i.e., my personal allowable capital allocation limit for my investments in Australian stocks is now 67%).
Key levels
The short term trend ribbon is the closest zone of (dynamic) demand (presently 8743-8765). 8675 is the closest static point of demand. A close below the short term uptrend ribbon would neutralise the present short term uptrend, while a close below 8675 almost certainly would end it. The October all-time highs around 9110-9116 is the next key zone of supply.
ChartWatch *LIVE* Webinar
ChartWatch *LIVE* Webinars – WEEKLY Wednesday's @ 12pm AEDT
Learn more about technical analysis and trend following through real case studies on ASX stocks. Australia's premier technical analyst, Carl Capolingua, shares his unique insights on stocks as requested by viewers. Ask about a company in your portfolio or anything related to trading and investing and get Carl's expert opinion.
Places are limited so >REGISTER NOW!<
Economy
Today
AUD MI Leading Index m/m
+0.1% m/m in December vs 0.0% m/m in November
Later this week
Thursday
00:30 USA President Trump speaks at World Economic Forum
11:30 AUD December Unemployment Data
Employment change: +4.4% m/m forecast vs +4.3% p.a. in November
Rate: 4.4% forecast vs 4.3% in November
Friday
00:30 USA September Final Gross Domestic Product (GDP) (+4.3% q/q forecast vs +4.3% q/q previous)
00:30 USA Core Personal Consumption Expenditures (PCE) Price Index (+0.2% m/m forecast)
09:00 AUD January Flash Purchasing Managers Index (PMI) (51.6 m/m in December)
Manufacturing: previous 51.6
Services: previous 51.1
Saturday
01:15 USA January Flash PMI
Manufacturing: previous 51.6
Services: previous 51.1
Latest News
Interesting Movers
Trading higher
+119.3% Australian Strategic Materials (ASM) – Energy Fuels to acquire Australian Strategic Materials, general strength across the broader Critical Minerals sector today, rise is consistent with prevailing short and long term uptrends, a recent regular in ChartWatch ASX Scans Uptrends list 🔎📈
+26.7% Sovereign Metals (SVM) – Strategic Heavy Rare Earths Recovered at Kasiya.
+21.3% Galan Lithium (GLN) – No news, general strength across the broader Lithium sector today, rise is consistent with prevailing short and long term uptrends, a regular in ChartWatch ASX Scans Uptrends list 🔎📈
+20.3% St Barbara (SBM) – 15-Mile Processing Hub Pre-Feasibility Completed, general strength across the broader Gold sector today, rise is consistent with prevailing short and long term uptrends, a regular in ChartWatch ASX Scans Uptrends list 🔎📈
+20.0% Lake Resources (LKE) – No news, general strength across the broader Lithium sector today, rise is consistent with prevailing short and long term uptrends 🔎📈
+14.0% Tesoro Gold (TSO) – No news, general strength across the broader Gold sector today, rise is consistent with prevailing short and long term uptrends, a regular in ChartWatch ASX Scans Uptrends list 🔎📈
+13.2% Emerald Resources (EMR) – Memot Gold Project Grows to 1.7Moz, general strength across the broader Gold sector today, rise is consistent with prevailing short and long term uptrends, a regular in ChartWatch ASX Scans Uptrends list 🔎📈
+13.1% Paladin Energy (PDN) – December 2025 Quarter Presentation, general strength across the broader Uranium sector today, rise is consistent with prevailing short and long term uptrends, a regular in ChartWatch ASX Scans Uptrends list 🔎📈
+13.0% EQ Resources (EQR) – Quarterly Activities/Appendix 5B Cash Flow Report, general strength across the broader Critical Minerals sector today, rise is consistent with prevailing short and long term uptrends, a regular in ChartWatch ASX Scans Uptrends list 🔎📈
+12.2% Ioneer (INR) – No news, general strength across the broader Lithium sector today, rise is consistent with prevailing short and long term uptrends, a recent regular in ChartWatch ASX Scans Uptrends list 🔎📈
+11.8% Peninsula Energy (PEN) – No news, general strength across the broader Uranium sector today, rise is consistent with prevailing short and long term uptrends, a recent regular in ChartWatch ASX Scans Uptrends list 🔎📈
+10.6% Medallion Metals (MM8) – Results of Share Purchase Plan, general strength across the broader Gold sector today, rise is consistent with prevailing short and long term uptrends, a recent regular in ChartWatch ASX Scans Uptrends list 🔎📈
+10.2% Southern Cross Gold Consolidated (SX2) – SX2 FY26 Second Quarter Financials and Management Analysis, general strength across the broader Gold sector today, rise is consistent with prevailing short and long term uptrends, a regular in ChartWatch ASX Scans Uptrends list 🔎📈
+9.7% New Murchison Gold (NMG) – December Quarter Update, general strength across the broader Gold sector today, rise is consistent with prevailing short and long term uptrends, a regular in ChartWatch ASX Scans Uptrends list 🔎📈
+9.6% Westgold Resources (WGX) – December 2025 Quarterly Results, general strength across the broader Gold sector today, rise is consistent with prevailing short and long term uptrends, a regular in ChartWatch ASX Scans Uptrends list 🔎📈
+9.5% Evolution Mining (EVN) – December 2025 Quarterly Report, general strength across the broader Gold sector today, rise is consistent with prevailing short and long term uptrends, a regular in ChartWatch ASX Scans Uptrends list 🔎📈
Trading lower
-24.9% 29METALS (29M) – Successful Completion of Institutional Entitlement Offer.
-10.7% Cettire (CTT) – No news, general weakness across the broader Consumer Discretionary sector today.
-8.9% Droneshield (DRO) – No news, general weakness across the broader Defence sector today, pulled back in the wake of recent sharp rally.
-7.7% Telix Pharmaceuticals (TLX) – No news, general weakness across the broader HealthCare sector today, fall is consistent with prevailing short and long term downtrends, a regular in ChartWatch ASX Scans Downtrends list 🔎📉
-7.3% Qoria (QOR) – No news, general weakness across the broader Information Technology sector today, fall is consistent with prevailing short and long term downtrends, a regular in ChartWatch ASX Scans Downtrends list 🔎📉
-7.2% Elsight (ELS) – No news, general weakness across the broader Defence sector today, pulled back in the wake of recent sharp rally.
-6.0% Electro Optic Systems Holdings (EOS) – No news, general weakness across the broader Defence sector today, pulled back in the wake of recent sharp rally.
-5.5% Adairs (ADH) – No news, general weakness across the broader Consumer Discretionary sector today, fall is consistent with prevailing short and long term downtrends, a regular in ChartWatch ASX Scans Downtrends list 🔎📉
-5.2% Xero (XRO) – No news, general weakness across the broader Information Technology sector today, fall is consistent with prevailing short and long term downtrends, a regular in ChartWatch ASX Scans Downtrends list 🔎📉
-4.7% Nuix (NXL) – No news, general weakness across the broader Information Technology sector today, fall is consistent with prevailing short and long term downtrends, a regular in ChartWatch ASX Scans Downtrends list 🔎📉
-4.7% Bravura Solutions (BVS) – No news, general weakness across the broader Information Technology sector today, fall is consistent with prevailing short and long term downtrends, a recent regular in ChartWatch ASX Scans Downtrends list 🔎📉
Broker Moves
29Metals (29M)
Retained at underweight at Jarden; Price Target: $0.37 from $0.41
Retained at underperform at Jefferies; Price Target: $0.45
Retained at sector perform at RBC Capital Markets; Price Target: $0.40 from $0.55
Advanced Energy Minerals (AEM)
Initiated at speculative buy at Ord Minnett; Price Target: $0.90
ARB Corporation (ARB)
Retained at buy at Jefferies; Price Target: $33.00 from $41.00
Retained at neutral at JPMorgan; Price Target: $32.00 from $35.00
Retained at outperform at Macquarie; Price Target: $35.80 from $44.90
Retained at overweight at Morgan Stanley; Price Target: $44.00
Retained at accumulate at Morgans; Price Target: $32.00 from $42.60
Retained at buy at Ord Minnett; Price Target: $37.00 from $42.00
ASX (ASX)
Retained at hold at Morgans; Price Target: $58.10 from $67.00
Bellevue Gold (BGL)
Retained at buy at Goldman Sachs; Price Target: $1.95 from $2.00
Retained at overweight at JPMorgan; Price Target: $2.20
Retained at outperform at Macquarie; Price Target: $2.00 from $1.80
Retained at buy at Moelis Australia; Price Target: $2.25
Retained at buy at UBS; Price Target: $2.05 from $1.55
BHP Group (BHP)
Retained at neutral at Citi; Price Target: $48.00
Retained at buy at Goldman Sachs; Price Target: $58.80 from $57.70
Retained at overweight at JPMorgan; Price Target: $56.00 from $57.00
Retained at hold at Morgans; Price Target: $47.90 from $43.90
Retained at accumulate at Ord Minnett; Price Target: $49.00
Retained at sector perform at RBC Capital Markets; Price Target: $51.00 from $49.00
Retained at neutral at UBS; Price Target: $47.00 from $45.00
COG Financial Services (COG)
Upgraded to buy from accumulate at Morgans; Price Target: $2.57 from $2.63
Clearview Wealth (CVW)
Retained at buy at Morgans; Price Target: $0.73
Dyno Nobel (DNL)
Upgraded to buy from hold at Jefferies; Price Target: $4.00 from $3.45
Fortescue (FMG)
Retained at trim at Morgans; Price Target: $20.60 from $16.60
Generation Development Group (GDG)
Upgraded to buy from accumulate at Morgans; Price Target: $7.95 from $8.01
Goodman Group (GMG)
Retained at overweight at Morgan Stanley; Price Target: $41.50
HUB24 (HUB)
Retained at buy at Bell Potter; Price Target: $125.00
Retained at neutral at Citi; Price Target: $104.75 from $101.50
Upgraded to hold from underperform at Jefferies; Price Target: $99.50 from $98.40
Retained at neutral at Macquarie; Price Target: $101.75 from $100.00
Retained at overweight at Morgan Stanley; Price Target: $123.00
Retained at accumulate at Ord Minnett; Price Target: $114.00 from $112.00
Retained at neutral at UBS; Price Target: $107.00 from $106.00
Retained at buy at Unified Capital Partners; Price Target: $130.10 from $134.10
Kina Securities (KSL)
Retained at buy at Morgans; Price Target: $1.78 from $1.67
LGI (LGI)
Retained at accumulate at Ord Minnett; Price Target: $4.70
MA Financial Group (MAF)
Retained at accumulate at Morgans; Price Target: $12.16 from $10.80
Medibank Private (MPL)
Retained at overweight at Morgan Stanley; Price Target: $5.90 from $5.84
Navigator Global Investments (NGI)
Downgraded to accumulate from buy at Morgans; Price Target: $3.71 from $3.45
NIB Holdings (NHF)
Retained at equal-weight at Morgan Stanley; Price Target: $7.50 from $7.85
Origin Energy (ORG)
Retained at buy at UBS; Price Target: $14.00
PEXA Group (PXA)
Retained at accumulate at Morgans; Price Target: $16.09 from $16.87
Qoria (QOR)
Retained at buy at Bell Potter; Price Target: $0.75 from $1.00
Retained at buy at Canaccord Genuity; Price Target: $0.80 from $1.00
Retained at buy at Goldman Sachs; Price Target: $0.51 from $0.91
Retained at buy at Ord Minnett; Price Target: $0.76 from $0.96
QPM Energy (QPM)
Retained at speculative buy at Ord Minnett; Price Target: $0.10 from $0.11
REA Group (REA)
Retained at neutral at Citi; Price Target: $222.70 from $279.25
Reece (REH)
Initiated at hold at Jefferies; Price Target: $15.90 from $12.53
Rio Tinto (RIO)
Retained at trim at Morgans; Price Target: $140.00 from $117.00
SEEK (SEK)
Retained at buy at Citi; Price Target: $29.55 from $31.65
Sky Metals (SKY)
Retained at speculative buy at Bell Potter; Price Target: $0.21 from $0.12
Smart Parking (SPZ)
Retained at buy at Shaw and Partners; Price Target: $1.50
Sunstone Metals (STM)
Retained at buy at Shaw and Partners; Price Target: $0.07
Suncorp Group (SUN)
Retained at accumulate at Morgans; Price Target: $19.28 from $23.45
Tabcorp Holdings (TAH)
Retained at neutral at Macquarie; Price Target: $0.95
Telix Pharmaceuticals (TLX)
Retained at buy at Canaccord Genuity; Price Target: $28.50
Retained at buy at Jarden; Price Target: $25.10 from $28.06
Retained at buy at Jefferies; Price Target: $24.50 from $27.10
Retained at overweight at Morgan Stanley; Price Target: $25.60 from $25.40
Temple & Webster Group (TPW)
Retained at overweight at Morgan Stanley; Price Target: $28.00
Tesoro Gold (TSO)
Retained at speculative buy at Morgans; Price Target: $4.88
Tyro Payments (TYR)
Retained at buy at Morgans; Price Target: $1.70 from $1.67
Vulcan Energy Resources (VUL)
Retained at speculative buy at Canaccord Genuity; Price Target: $10.75 from $10.50
Scans
Top Gainers
Code | Company | Last | % Chg |
|---|---|---|---|
| ASM | Australian Strategic Materials Ltd | $1.59 | +119.31% |
| OSX | Osteopore Ltd | $0.02 | +53.85% |
| FL1 | First Lithium Ltd | $0.235 | +34.29% |
| AVR | Anteris Technologies Global Corp | $9.69 | +32.92% |
| RGL | Riversgold Ltd | $0.021 | +31.25% |
Top Fallers
Code | Company | Last | % Chg |
|---|---|---|---|
| 29M | 29METALS Ltd | $0.43 | -30.65% |
| RRE | Right Resources Ltd | $0.32 | -15.79% |
| PAB | PATRYS Ltd | $0.028 | -15.15% |
| HTG | Harvest Technology Group Ltd | $0.018 | -14.29% |
| RVT | Richmond Vanadium Technology Ltd | $0.18 | -14.29% |
52 Week Highs
Code | Company | Last | % Chg |
|---|---|---|---|
| FL1 | First Lithium Ltd | $0.235 | +34.29% |
| RGL | Riversgold Ltd | $0.021 | +31.25% |
| T88 | Taiton Resources Ltd | $0.19 | +31.03% |
| MRR | Minrex Resources Ltd | $0.024 | +26.32% |
| JAV | Javelin Minerals Ltd | $0.125 | +25.00% |
52 Week Lows
Code | Company | Last | % Chg |
|---|---|---|---|
| IOVDA | Ion Video Ltd | $0.22 | -8.33% |
| TLX | TELIX Pharmaceuticals Ltd | $10.61 | -7.66% |
| GSS | Genetic Signatures Ltd | $0.195 | -7.14% |
| TDO | 3D Energi Ltd | $0.08 | -6.98% |
| OFX | OFX Group Ltd | $0.48 | -4.95% |
Near Highs
Code | Company | Last | % Chg |
|---|---|---|---|
| S32 | SOUTH32 Ltd | $4.18 | +0.72% |
| QAU | Betashares Gold Bullion Currency Hedged ETF | $38.86 | +3.63% |
| GBR | Great Boulder Resources Ltd | $0.105 | +5.00% |
| WGX | Westgold Resources Ltd | $7.53 | +9.61% |
| FML | Focus Minerals Ltd | $3.95 | +10.03% |
Relative Strength Index (RSI) Oversold
Code | Company | Last | % Chg |
|---|---|---|---|
| FANG | Global X Fang+ ETF | $32.78 | -1.47% |
| ETHI | Betashares Global Sustainability Leaders ETF | $16.11 | -0.62% |
| PME | Pro Medicus Ltd | $178.37 | -4.39% |
| SGP | Stockland | $5.37 | -2.36% |
| WPR | Waypoint REIT | $2.49 | -0.80% |
