News | Market Wraps
Evening Wrap: ASX 200 dumps over 100 points as bond market blues return to haunt gold stocks, miners and banks
The S&P/ASX 200 closed 108.1 points lower, down 1.26%.

Mentioned
The S&P/ASX 200 closed 108.1 points lower, down 1.26%.
The ASX 200 slumped as a renewed surge in global benchmark bond yields — with the US 30-year hitting its highest level since 2007 — drove a broad sell-off across rate-sensitive sectors, hammering gold stocks, miners, banks, and bond-proxy names alike. Consumer staples was the only meaningful refuge on a day when eight of eleven sectors finished lower.
Be sure to click/scroll through for the usual reporting of the major sector and stock-specific moves, the broker responses to them, as well as all the key economic data in tonight's Evening Wrap. Also, I have detailed technical analysis on the Nasdaq Composite and the S&P/ASX 200 in today's ChartWatch.
Let's dive in!
Today in Review
Wed 20 May 26, 5:01pm (AEST)
Name | Value | % Chg |
|---|---|---|
Major Indices | ||
| ASX 200 | 8,496.6 | -1.26% |
| All Ords | 8,717.0 | -1.27% |
| Small Ords | 3,314.3 | -2.12% |
| All Tech | 2,776.9 | -0.75% |
| Emerging Companies | 2,897.9 | -2.31% |
Currency | ||
| AUD/USD | 0.7104 | -0.04% |
US Futures | ||
| S&P 500 | 7,384.0 | +0.08% |
| Dow Jones | 49,456.0 | -0.01% |
| Nasdaq | 29,004.25 | +0.28% |
Name | Value | % Chg |
|---|---|---|
Sector | ||
| Consumer Staples | 11,691.9 | +0.15% |
| Information Technology | 1,725.7 | +0.05% |
| Energy | 10,761.4 | +0.01% |
| Health Care | 22,676.2 | -0.23% |
| Consumer Discretionary | 3,374.9 | -0.42% |
| Financials | 9,132.7 | -1.11% |
| Industrials | 7,835.1 | -1.49% |
| Real Estate | 3,496.6 | -1.62% |
| Utilities | 9,970.0 | -1.65% |
| Communication Services | 1,735.6 | -1.67% |
| Materials | 23,364.9 | -2.12% |
Markets
%20intraday%20chart_20%20May.png)
ASX 200 Session Chart
The S&P/ASX 200 (XJO) finished 108.1 points lower at 8,496.6, 1.3% from its session high and just 0.1% from its low. Reflecting the tough time had at benchmark level, in the broader-based S&P/ASX 300 (XKO) advancers lagged decliners by a truly dismal 42 to 239.
Consumer Staples (XSJ) (+0.2%) was the session's standout — not for its gain, but for its ability to hold positive ground when almost everything else was being sold. As bond yields surged globally, fund managers rotated into the only part of the market with genuine defensive characteristics: non-discretionary consumer spending that doesn't depend on credit growth, economic expansion, or low rates. Woolworths (WOW) (+0.6%) and Coles (COL) (+0.5%) both edged higher.
Information Technology (XIJ) (+0.0%) finished flat — a relative win when the broader market was down. Catapult Sports (CAT) (+17.7%) surged on a strong earnings result, and Technology One (TNE) (+7.3%) continued to rally on broker upgrades following yesterday's results. Both were large enough moves to offset broader sector weakness.
Energy (XEJ) (+0.0%) also held flat despite ICE Brent crude futures easing 0.9% to US$110.25/bbl. Coal stocks carried the sector — Newcastle coal futures gained 1.0% to $141.90/t, supporting Yancoal Australia (YAL) (+1.6%) and Whitehaven Coal (WHC) (+0.5%). Elsewhere, Viva Energy (VEA) (+1.3%) and Woodside Energy (WDS) (+0.7%) were solid.
Health Care (XHJ) (-0.2%) barely moved lower — another relative outperformer, arguably for the same defensive reasons as Consumer Staples. ResMed (RMD) (+1.8%) and Ramsay Health Care (RHC) (+0.4%) both firmed.
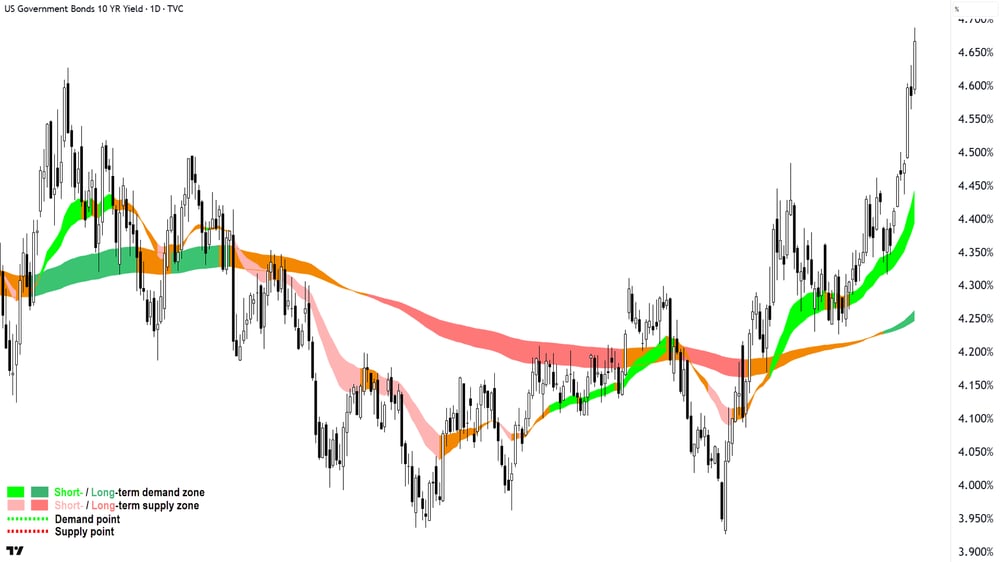
US 10-Year T-Bond yield, Daily chart
The Gold Sub-Index (XGD) (-4.5%) was the hardest-hit sector as surging benchmark bond yields — the US 30-year reaching 5.20%, its highest since 2007 — sharply increased the opportunity cost of holding gold, which offers no income and therefore competes directly with risk-free government bonds. Gold producers face a further squeeze as rising oil prices lift diesel input costs simultaneously.
COMEX gold futures fell 1.0% to US$4,467/oz and COMEX silver futures eased 0.3% to US$74.92/oz. West African Resources (WAF) (-5.2%), Westgold Resources (WGX) (-5.0%), Vault Minerals (VAU) (-4.9%), and Evolution Mining (EVN) (-4.9%) were all sharply lower. Newmont (NEM) (-4.5%) and Greatland Gold (GGP) (-6.3%) also fell heavily.
Materials (XMJ) (-2.1%) tracked the same bond yield dynamic — rising yields signal a stronger US dollar, which raises the cost of dollar-priced commodities for non-US buyers, compressing demand. SGX iron ore futures slipped 0.7% to US$107.20/t, their fifth consecutive daily decline, now nearly 5% below last week's two-year peak. BHP (BHP) (-2.3%), Rio Tinto (RIO) (-1.5%), and Fortescue (FMG) (-1.2%) all retreated. Copper futures added a modest 0.2% to US$6.214/lb — insufficient to arrest the broader selling.
Communication Services (XTJ) (-1.7%), Utilities (XUJ) (-1.7%), and Real Estate (XPJ) (-1.6%) were all dragged lower by the same bond yield surge — as bond-proxy sectors whose stable income streams are repriced against rising risk-free rates, all three are directly in the crosshairs when yields spike. REA Group (REA) (-2.0%) and Telstra (TLS) (-1.1%) led Communication Services lower. Origin Energy (ORG) (-3.1%) was the sharpest Utilities faller. Goodman Group (GMG) (-2.1%), Vicinity Centres (VCX) (-2.0%), and GPT Group (GPT) (-1.7%) were the Real Estate laggards.
Financials (XFJ) (-1.1%) were caught between two headwinds — rising yields hurt valuations of long-duration financial assets, and Morgan Stanley warned operating conditions for the big four were changing at the fastest rate in 25 years, with three RBA rate hikes, budget changes to property tax concessions, and the global energy shock creating the most uncertain outlook in a generation. Westpac (WBC) (-2.4%), ANZ (ANZ) (-2.1%), and Macquarie Group (MQG) (-2.0%) were the sharpest fallers.
Lithium stocks were mixed as GFEX lithium carbonate futures fell 0.7% to CNY 183,100/t — having earlier plunged 5% before recovering through the session — while Australian spodumene concentrate dropped 4.2% to US$2,630/t. IGO (IGO) (+2.3%), Mineral Resources (MIN) (+2.4%), and Pilbara Minerals (PLS) (+1.9%) managed gains, but Liontown Resources (LTR) (-3.1%), Develop Global (DVP) (-3.0%), and Elevra Lithium (ELV) (-2.0%) extended their multi-day slide.
Uranium stocks extended their recent selloff — Bannerman Energy (BMN) (-7.1%), Deep Yellow (DYL) (-6.4%), Paladin Energy (PDN) (-4.5%), NexGen Energy (NXG) (-4.0%), and Boss Energy (BOE) (-4.0%) all fell sharply.
In other commodities moves, NdPr rare earth prices in China fell 3.0% to CNY 690,000/t in the Asian session.
Today's best ASX Top 300 gainers
Company | Last Price | Change $ | Change % | 1mo % | 1yr % |
|---|---|---|---|---|---|
Catapult Sports (CAT) | $3.39 | +$0.51 | +17.7% | +5.6% | -21.2% |
Technology One (TNE) | $29.84 | +$2.04 | +7.3% | -0.6% | -23.1% |
Gemlife Communities (GLF) | $4.52 | +$0.2 | +4.6% | -1.5% | 0% |
Stanmore Resources (SMR) | $2.61 | +$0.11 | +4.4% | +17.0% | +34.2% |
Tyro Payments (TYR) | $0.785 | +$0.025 | +3.3% | -5.4% | -12.3% |
Alcoa (AAI) | $89.56 | +$2.73 | +3.1% | -5.0% | +100.6% |
SGH (SGH) | $41.45 | +$1.25 | +3.1% | -0.6% | -21.6% |
Dalrymple Bay (DBI) | $5.49 | +$0.16 | +3.0% | +3.8% | +33.9% |
OOH!Media (OML) | $1.370 | +$0.035 | +2.6% | +44.2% | -16.5% |
Mineral Resources (MIN) | $67.31 | +$1.57 | +2.4% | +7.2% | +186.3% |
IGO (IGO) | $8.44 | +$0.19 | +2.3% | -5.1% | +107.4% |
GQG Partners (GQG) | $1.600 | +$0.035 | +2.2% | -7.0% | -25.6% |
Sunrise Energy Metals (SRL) | $12.44 | +$0.25 | +2.1% | +5.8% | +2269.5% |
Qoria (QOR) | $0.250 | +$0.005 | +2.0% | -25.4% | -40.5% |
PLS Group (PLS) | $6.03 | +$0.11 | +1.9% | +2.4% | +341.8% |
Resmed (RMD) | $29.26 | +$0.51 | +1.8% | -7.2% | -24.3% |
Yancoal Australia (YAL) | $6.96 | +$0.11 | +1.6% | +1.6% | +36.5% |
Lynas Rare Earths (LYC) | $18.37 | +$0.25 | +1.4% | -8.0% | +141.1% |
Beach Energy (BPT) | $1.160 | +$0.015 | +1.3% | +0.9% | -12.1% |
Viva Energy (VEA) | $2.34 | +$0.03 | +1.3% | +0.9% | +21.2% |
Today's worst ASX Top 300 losers
Company | Last Price | Change $ | Change % | 1mo % | 1yr % |
|---|---|---|---|---|---|
Tuas (TUA) | $2.22 | -$0.45 | -16.9% | -63.6% | -60.5% |
Electro Optic Systems (EOS) | $7.91 | -$0.91 | -10.3% | -23.3% | +513.2% |
4DMEDICAL (4DX) | $3.28 | -$0.37 | -10.1% | -38.6% | +1092.7% |
Predictive Discovery (PDI) | $0.760 | -$0.075 | -9.0% | -17.8% | +78.8% |
G8 Education (GEM) | $0.155 | -$0.015 | -8.8% | -36.7% | -87.8% |
Guzman Y Gomez (GYG) | $16.00 | -$1.48 | -8.5% | -22.0% | -49.3% |
Southern Cross Gold (SX2) | $9.45 | -$0.78 | -7.6% | -17.5% | +66.7% |
Dateline Resources (DTR) | $0.185 | -$0.015 | -7.5% | -33.9% | +560.7% |
Bannerman Energy (BMN) | $3.42 | -$0.26 | -7.1% | -23.7% | +23.5% |
Ora Banda Mining (OBM) | $1.310 | -$0.095 | -6.8% | -17.1% | +23.6% |
Healius (HLS) | $0.345 | -$0.025 | -6.8% | -38.9% | -66.8% |
Turaco Gold (TCG) | $0.500 | -$0.035 | -6.5% | -23.7% | +28.2% |
Bellevue Gold (BGL) | $1.440 | -$0.1 | -6.5% | -17.0% | +62.7% |
St Barbara (SBM) | $0.580 | -$0.04 | -6.5% | -17.7% | +100.0% |
Brambles (BXB) | $16.40 | -$1.13 | -6.4% | -27.7% | -25.2% |
Deep Yellow (DYL) | $1.545 | -$0.105 | -6.4% | -23.5% | +28.2% |
Immutep (IMM) | $0.059 | -$0.004 | -6.3% | -19.2% | -80.3% |
Web Travel (WEB) | $2.23 | -$0.15 | -6.3% | -20.4% | -52.7% |
Greatland Resources (GGP) | $12.30 | -$0.82 | -6.3% | -15.5% | 0% |
ChartWatch
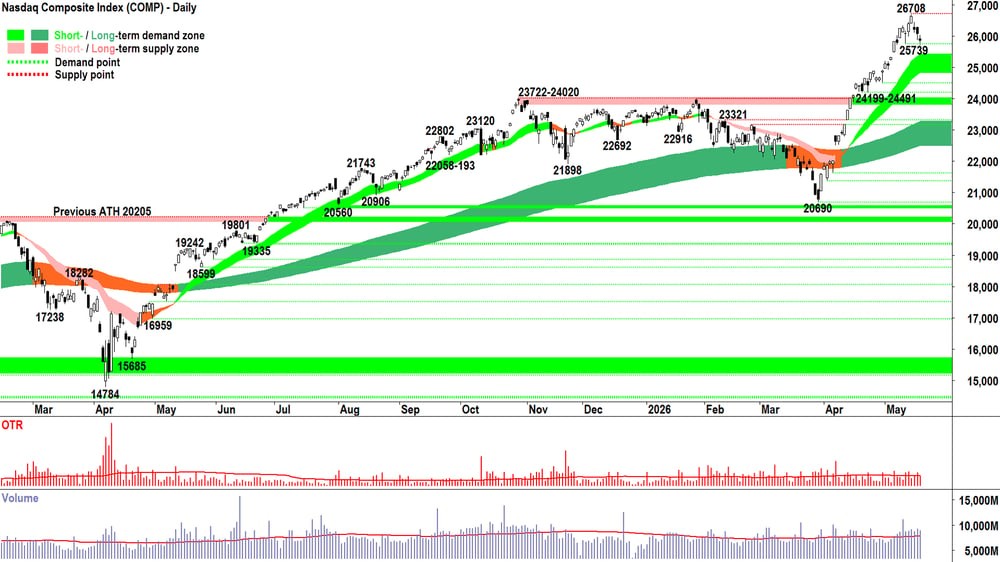
Nasdaq Composite Index
Analysis
We're still in supply test-demand response mode. Nothing goes up in a straight line forever. Even in the strongest bull markets there are always pullbacks.
Each time one manifests, it is our role as trend following technical analysts to determine how strong the supply side's test is, as well as the demand side's response.
On Tuesday, clearly the elevated supply that we've been tracking here as far back as the 11-May candle showed greater motivation than the demand side could withstand, but only mildly so. The candle was only about average in Optimised True Range (OTR) — so motivation was modest. Volume was again above average — a decent whack of supply found a decent whack of demand.
Upward and downward pointing shadows showed there was a vigorous battle with neither party really landing the knockout blow by the close.
If we zoom out from that one candle, we can see that the pullback from the 26708 peak — now the only point of supply of note on the chart — has been mild. The 25739 point of demand is holding. The short term uptrend ribbon remains untested.
Mild.
Consistent with a modest pullback that is MOTN likely to give way to a resumption of the prevailing short- and long-term uptrends.
And we reach the point in each of my Comp updates where I cover my assets: but that is what we know from the trends, price action, candles and volume that we have.
Anything can happen next. We could be at the top of the next major bear market and we wouldn't know it. But to get there, we absolutely know this stuff must occur:
Greater prevalence of black-bodied and/or upward pointing shadows (longer length = more motivated; vs shorter length = less motivated; larger volume = larger supply side ammunition)
A lower peak to 26708 is set, soon followed by a lower trough to 25739
The price closes below the short term trend ribbon, soon followed by the short term trend ribbon transitioning to amber, and eventually at some point impeding upward price action by acting as a zone of dynamic excess supply
The process is repeated at the long term trend ribbon
If my Analysis shows those things have occurred, I will Accept the outcome and look to reduce my risk exposure. For now, no change is required on the Act part.
View
FRP (RP = Risk Position — it reflects my personal allowable capital allocation limit for my investments in US stocks. So 1/2RP is 50%, 2/3RP is 67% and FRP is 100% 🪣).
Key levels
26708 is the key point of supply. 25739 is the closest point of demand, then there's the short term uptrend ribbon (presently 24473-25052). If the price closes back below this range, the supply-side is very likely back in control of the Comp's price.
S&P/ASX 200 (XJO)
%20chart_20%20May.png)
Analysis
You're thinking: "Hey Carl, how did you know a couple of days ago to cut your exposure to ASX stocks from 1/2 invested and 1/2 cash to 1/3 invested and 2/3 cash? I mean, even after yesterday's strong rally, you didn't flinch and stayed the course at the lower risk setting."
The answer is: "I had no fundamental reason, it's not like I felt Aussie stocks were overvalued, or that there were certain mitigating global macroeconomic circumstances that warranted such a move. Nope, really, I had no good reason to do that at all. Even as stocks rose yesterday, I was completely clueless. 🤷 No doubt, though, there were a few really smart and wealthy individuals out there — way smarter and way wealthier than me — that did know. You see, they're the ones that created the demand and supply which pushed the ASX 200's price into a convincing downtrend a couple of days ago. That's a big no-no for me, so I had no choice but to cut my risk. Sure, after yesterday's rally I had some doubts, but I just checked how that rally changed the broader technical picture — as in, was it enough to convincingly signal the demand side had regained control of the price? No, it wasn't even close in my opinion, so I felt it best I simply stay the course on my portfolio risk change from 1/2RP to 1/3RP. At the end of the day, my model is there to keep me safe. It doesn't get it right all the time, bit it does a pretty good job MOTN. That's enough for me... and I know I just gotta trust it and stick it out."
Today's candle only reaffirms my view that the supply side is in control of the OTP's price. Is 8262-8379 inevitable? You know I don't do predictions, but something about Blind Freddy comes to mind! 🙈
Yes, I'm feeling a little smug about some of my calls here. You can be the judge as to whether they've been any good or not... But equally, probably like you — I'm also substantially frustrated that this market is so darn terrible. I'd love nothing more than a great big double-green uptrend — and yet, I'll get what I get... 😉
View
I remain 1/3RP 🪣 on the OTP (i.e., my personal allowable capital allocation limit for my investments in Australian stocks is 33%).
Key levels
The short- and long-term downtrend ribbons (presently 8678-8745) combine to represent the key zone of supply. Beyond that, it's the not so lucky 8888 level! Demand is the 8262-8379 zone. Below that... 😱!
(Glossary of acronyms! Old Tin Pot (OTP): S&P/ASX 200 | MOTN: More Often Than Not | FOMO: Fear Of Missing Out | HOFU: Holding On For Upside | BTD: Buy The Dip | STR: Sell The Rally | RP: Risk Position)
***NEW VIDEO DROPPED! 📺***
Thinking of buying CSL shares? This is how you will know when it's time ⏰
ChartWatch *LIVE* Webinar
ChartWatch *LIVE* Webinars – WEEKLY Wednesday's @ 12pm AEDT
Learn more about technical analysis and trend following through real case studies on ASX stocks. Australia's premier technical analyst, Carl Capolingua, shares his unique insights on stocks as requested by viewers. Ask about a company in your portfolio or anything related to trading and investing and get Carl's expert opinion.
Places are limited so >REGISTER NOW!<
Economy
Today
CHN Peoples Bank of China (PBOC) Official Interest Rates Decision
1-y Loan Prime Rate: no change at +3.0% p.a. as per forecast
5-y Loan Prime Rate: no change at +3.5% p.a. as per forecast
Later this week
Thursday
02:00 US Federal Reserve May FOMC meeting minutes
AUS April Employment Data
Employment Change: +15,700 vs +17,900 in March
Unemployment Rate: unchanged at 4.3% forecast
21:45 USA Flash May Purchasing Managers Index (PMI)
Manufacturing: 53.6 forecast vs 54.5 in April
Services: 51.1 forecast vs 51.0 in April
Friday
No major economic data are scheduled for release this day
Latest News
Interesting Movers
Trading higher
+17.7% Catapult Sports (CAT) - management EBITDA rose 67% year-on-year to US$24.7 million.
+7.3% Technology One (TNE) - Barrenjoey upgraded to Overweight, Jarden upgraded to Overweight from Neutral with a price target of $31.00, and Morgans upgraded to Accumulate from Hold with a price target of $32.30; five other brokers retained buy-equivalent ratings.
+4.6% Stanmore Resources (SMR) - CEO Marcelo Matos told the company's AGM that metallurgical coal prices had recovered meaningfully from their 2025 lows and continued to improve into 2026, with Queensland supply constrained and Indian and Chinese demand strengthening.
+3.1% SGH (SGH) - RBC Capital Markets initiated coverage at Outperform, citing a mix of high-quality assets, limited negative AI exposure, and an upcoming positive catalyst from the Crux gas project, in which SGH holds a 15.5% stake.
Trading lower
-16.9% Tuas (TUA) - fell for a third consecutive session as Singapore regulator IMDA's investigation into possible unauthorised use of radio frequency bands by its Simba mobile brand continued to cloud both the proposed Simba-M1 merger and the standalone business outlook.
-11.2% Webjet Group (WJL) - issued a gloomy FY27 outlook with bookings, earnings per share, and profit all expected to decline, and disclosed that Virgin Australia had cut commissions to the platform, a move that would have reduced revenue by $3 million in the prior fiscal year.
-10.3% Electro Optic Systems (EOS) - raised $150 million at $8.00 per share via an institutional placement, alongside a $40 million strategic placement from defence-focused investors.
-6.7% Healius (HLS) - Macquarie Group disclosed it had ceased to be a substantial holder, having last reported a 5% stake in mid-April.
-1.2% Qantas (QAN) - Australian Super disclosed it had increased its stake by 1.2 percentage points to 6.29%, joining HESTA, Rest, and the Future Fund as substantial holders in the airline.
-0.9% James Hardie Industries (JHX) - March quarter adjusted EBITDA of US$380.9 million beat consensus and company guidance, but FY27 guidance came in approximately 1.8% below consensus at the midpoint as management flagged weaker repair and remodel demand and said it was "not assuming a market recovery".
Broker Moves
Broker Moves
Beacon Lighting Group (BLX)
Retained at neutral at Citi; Price Target: $1.68 from $2.75
Boss Energy (BOE)
Initiated at accumulate at Morgans; Price Target: $1.55
Brambles (BXB)
Retained at buy at Citi; Price Target: $23.55 from $27.55
Upgraded to neutral from sell at Goldman Sachs; Price Target: $19.34 from $20.95
Echo IQ (EIQ)
Retained at speculative buy at Ord Minnett; Price Target: $1.50 from $0.60
Gemlife Communities Group (GLF)
Initiated at buy at UBS; Price Target: $5.50
Imricor Medical Systems Inc (IMR)
Initiated at buy at Jarden; Price Target: $3.30
James Hardie Industries Plc (JHX)
Retained at buy at Citi; Price Target: $38.00
Meteoric Resources NL (MEI)
Retained at speculative buy at Ord Minnett; Price Target: $0.25
Mineral Resources (MIN)
Retained at buy at Argonaut Securities; Price Target: $90.00 from $79.00
Retained at outperform at Macquarie; Price Target: $75.00
Retained at outperform at RBC Capital Markets; Price Target: $70.00
New Hope Corporation (NHC)
Retained at hold at Bell Potter; Price Target: $5.00 from $4.50
NexGen Energy (Canada) (NXG)
Initiated at buy at Morgans; Price Target: $20.80
Orezone Gold Corporation (ORE)
Retained at buy at Canaccord Genuity; Price Target: $5.00
Paladin Energy (PDN)
Initiated at buy at Morgans; Price Target: $13.05
Prospect Resources (PSC)
Retained at speculative buy at Canaccord Genuity; Price Target: $0.60
Ramsay Health Care (RHC)
Retained at underweight at Morgan Stanley; Price Target: $32.90
SGH (SGH)
Initiated at outperform at RBC Capital Markets; Price Target: $47.00
Technology One (TNE)
Upgraded to overweight from neutral at Jarden; Price Target: $31.00 from $30.00
Retained at buy at Jefferies; Price Target: $34.00
Retained at overweight at JPMorgan; Price Target: $32.00
Retained at outperform at Macquarie; Price Target: $30.50 from $29.00
Retained at overweight at Morgan Stanley; Price Target: $32.00
Upgraded to accumulate from hold at Morgans; Price Target: $32.30 from $31.20
Retained at outperform at RBC Capital Markets; Price Target: $33.00
Temple & Webster Group (TPW)
Retained at buy at Bell Potter; Price Target: $7.00 from $13.00
Viridis Mining and Minerals (VMM)
Retained at speculative buy at Ord Minnett; Price Target: $3.60
Wesfarmers (WES)
Retained at hold at Ord Minnett; Price Target: $70.00
Scans
Top Gainers
Code | Company | Last | % Chg |
|---|---|---|---|
| MCO | Myeco Group Ltd | $0.022 | +83.33% |
| CLG | Close the Loop Ltd | $0.033 | +50.00% |
| DWG | Dataworks Group Ltd | $0.175 | +45.83% |
| HYD | HYDRIX Ltd | $0.018 | +38.46% |
| OSL | Oncosil Medical Ltd | $0.525 | +34.62% |
Top Fallers
Code | Company | Last | % Chg |
|---|---|---|---|
| SNG | Siren Gold Ltd | $0.06 | -27.71% |
| CCE | Carnegie Clean Energy Ltd | $0.079 | -24.76% |
| ACM | Australian Critical Minerals Ltd | $0.042 | -20.76% |
| GUL | Gullewa Ltd | $0.084 | -20.00% |
| QEM | QEM Ltd | $0.029 | -19.44% |
52 Week Highs
Code | Company | Last | % Chg |
|---|---|---|---|
| MCO | Myeco Group Ltd | $0.022 | +83.33% |
| HYD | HYDRIX Ltd | $0.018 | +38.46% |
| MYE | Mastermyne Group Ltd | $0.23 | +17.95% |
| TTX | Tetratherix Ltd | $6.15 | +10.81% |
| AVR | Anteris Technologies Global Corp | $11.05 | +6.25% |
52 Week Lows
Code | Company | Last | % Chg |
|---|---|---|---|
| SEQ | Sequoia Financial Group Ltd | $0.125 | -16.67% |
| KAM | K2 Asset Management Holdings Ltd | $0.055 | -15.39% |
| MTH | Mithril Silver and Gold Ltd | $0.268 | -12.30% |
| TRP | Tissue Repair Ltd | $0.11 | -12.00% |
| PR2 | Piche Resources Ltd | $0.037 | -11.91% |
Near Highs
Code | Company | Last | % Chg |
|---|---|---|---|
| CNEW | Vaneck China New Economy ETF | $8.18 | +0.49% |
| GXAI | Global X Artificial Intelligence ETF | $16.30 | -0.18% |
| HGBL | Betashares Global Shares Currency Hedged ETF | $82.57 | -0.25% |
| MQGPG | Macquarie Group Ltd | $103.85 | -0.12% |
| DGVA | Dimensional Global Value Trust - Active ETF | $29.03 | -0.07% |
Relative Strength Index (RSI) Oversold
Code | Company | Last | % Chg |
|---|---|---|---|
| CMA | Carma Ltd | $0.60 | -4.00% |
| TUA | Tuas Ltd | $2.22 | -16.85% |
| MIR | Mirrabooka Investments Ltd | $2.47 | -0.80% |
| DGL | DGL Group Ltd | $0.345 | -4.17% |
| IRE | Iress Ltd | $5.66 | -2.08% |
