News | Market Wraps
Evening Wrap: ASX 200 extends gains as tech shares lead, Life360 +27% on profit upgrade
The S&P/ASX 200 closed 11.4 points higher, up 0.13%.

Mentioned
The S&P/ASX 200 closed 11.4 points higher, up 0.13%.
The ASX 200 tracked slightly higher today, with Tech doing the heavy lifting to keep the index anchored in positive territory. Life360 (360) surged 27% after a strong preliminary 2025 result flagged 32% year-on-year growth.
Gold continued to extended its dream 2025 run well into the new year, pushing through US/oz$4,900 at the backdrop of a weakening US dollar. Gold stocks, naturally, continued their run — likely a massive relieve to investors after they took an uncharacteristic tumble yesterday.
Be sure to click/scroll through for the usual reporting of the major sector and stock-specific moves, the broker responses to them, as well as all the key economic data in tonight's Evening Wrap.
Also, I have detailed technical analysis on the Nasdaq Composite and the S&P/ASX 200 in today's ChartWatch.
Let's dive in!
Today in Review
Fri 23 Jan 26, 5:36pm (AEST)
Name | Value | % Chg |
|---|---|---|
Major Indices | ||
| ASX 200 | 8,860.1 | +0.13% |
| All Ords | 9,189.9 | +0.19% |
| Small Ords | 3,992.5 | +0.64% |
| All Tech | 3,307.2 | +2.23% |
| Emerging Companies | 3,489.0 | +1.98% |
Currency | ||
| AUD/USD | 0.685 | +0.13% |
US Futures | ||
| S&P 500 | 6,962.75 | +0.26% |
| Dow Jones | 49,620.0 | +0.13% |
| Nasdaq | 25,729.0 | +0.28% |
Name | Value | % Chg |
|---|---|---|
Sector | ||
| Information Technology | 2,099.0 | +3.83% |
| Materials | 23,212.2 | +1.44% |
| Communication Services | 1,707.1 | +0.26% |
| Health Care | 34,425.5 | 0.00% |
| Energy | 8,943.8 | -0.23% |
| Real Estate | 3,886.3 | -0.28% |
| Utilities | 9,696.0 | -0.37% |
| Industrials | 8,475.0 | -0.48% |
| Financials | 9,105.4 | -0.50% |
| Consumer Discretionary | 4,004.6 | -0.72% |
| Consumer Staples | 11,643.6 | -1.11% |
Markets
%20intraday%20chart_23%20Jan.png)
ASX 200 Session Chart
The S&P/ASX 200 (XJO) finished 11.4 points higher at 8,860.1, 0.28% from its session high and 0.23% from its low. In the broader-based S&P/ASX 300 (XKO) decliners beat advancers by a very healthy 149 to 127.
For the week, the XJO finished down 43.8 points or 0.49% lower, 1.1% from its intraweek low and 0.49% from its intraweek high.
Fund flows: Out of the pot and into the fire 🔥
It was that kind of a week. The Gold (XGD) sector got smashed nearly 6% Thursday. Up nearly 5% today! Gold price: unchanged. 🤦
Tech (XIJ) got wrecked Monday and Wednesday. Today: +3.8%, led by a stock that was getting obliterated on its chart — Life360 (360) — up 27%. 🤦
Financials (XFJ) (-0.50%) swung, as we’d expect, but I put to you: in an even more intense fashion — from a wipe-out Wednesday to a broker-upgrade inspired melt-up yesterday. Today… down again! 🤦
Resources (XJR) (+1.3%) was similarly all over the place, as were other sectors which we had been tracking as consistent Losers, like Consumer Discretionary (XDJ) (-0.7%), which today backed away from its massive white candle yesterday… 🤦
It feels like things are speeding up. Moves that would have usually played out over weeks and possibly months are now playing out over a few days. Pullbacks are exacerbated, as are the reversions to the underlying trends.
The global funds are well and truly flowing… and they’re wreaking havoc with our little corner of the share market world.
But as they say in the classics: if you don’t like the heat… jump out of the Old Tin Pot! 🍲
Stock Specific: 360 did a 180 🙃
The trend is your friend until it bends. It’s one of the oldest market sayings. And we can see in the chart below for Life360 that the prevailing downtrend didn’t just bend today — it folded in half!
%20chart_23%20Jan.png)
What this chart really shows is how modern markets can move on forces that have little to do with a company’s fundamentals. Many large funds now trade using algorithms that follow price trends or big global themes — things like rotating out of growth stocks, selling “long-duration” assets, or favouring defence and geopolitical exposures (like gold and base metals!).
When those themes take hold, money flows can push share prices well past where the fundamentals alone would suggest. For months, Life360 appears to have been caught in that tide, with selling driven more by global positioning than by anything specific to the business.
That changed today. The profit upgrade from Life360 delivered genuinely new information — the kind that forces markets to reassess what a company is actually worth. The response was swift and dramatic: shares surged 27% as buyers rushed in and short sellers scrambled to cover positions built during the downtrend.
In simple terms, this was price discovery snapping back into place. Markets can overshoot when driven by momentum and themes, but when fresh company-level facts arrive, reality has a habit of reasserting itself — often in a hurry.
So, what is a trend follower to do? Particularly given that as a follower, one will NEVER see a move like today's coming!? 🤔
My answer is the same one I always give you here:
Follow the trend. ✅ Manage risk. ✅
Analyse — trends, price action, candles, and volume. Determine what future price path (⬆️ or ⬇️ or ↔️) is likely on a MOTN basis (More Often Than Not!).
Accept that outcome — even if it feels uncomfortable with your traditional life-time anchoring of what "cheap" and "expensive" mean.
Act — manage risk: Either +R (add risk), =R (maintain risk), or -R (reduce risk).
Repeat the process each day ♾️.
Arguably, plenty changed today with respect to the market's perception of the value of 360's shares. But nothing has changed with respect to how a trend follower analyses, accepts, and acts.
For me, as someone who would have very happily been running short positions on 360, today's massive demand-side pulse (gap and run + substantial volume) requires a de-risking. I will act in that regard (perhaps take a loss... perhaps break even in this case...). And move on. Next trade! ♻️
Today's best blue chip gainers
Company | Last Price | Change $ | Change % | 1mo % | 1yr % |
|---|---|---|---|---|---|
Life360 (360) | $33.79 | +$7.26 | +27.4% | +2.3% | +42.0% |
Lotus Resources (LOT) | $3.24 | +$0.38 | +13.3% | +56.5% | +22.5% |
Immutep (IMM) | $0.460 | +$0.045 | +10.8% | +15.0% | +43.8% |
Regis Resources (RRL) | $8.35 | +$0.77 | +10.2% | +8.3% | +177.4% |
Audinate Group (AD8) | $4.60 | +$0.4 | +9.5% | +6.5% | -35.6% |
Greatland Resources (GGP) | $13.94 | +$0.99 | +7.6% | +28.8% | 0% |
Iperionx (IPX) | $8.37 | +$0.58 | +7.4% | +60.3% | +86.4% |
Ramelius Resources (RMS) | $4.92 | +$0.34 | +7.4% | +18.0% | +110.3% |
Temple & Webster Group (TPW) | $13.62 | +$0.93 | +7.3% | -1.3% | +1.0% |
Catapult Sports (CAT) | $3.86 | +$0.23 | +6.3% | -10.2% | +9.3% |
Nuix (NXL) | $1.970 | +$0.105 | +5.6% | +3.4% | -63.7% |
Westgold Resources (WGX) | $7.67 | +$0.4 | +5.5% | +17.1% | +184.1% |
Resolute Mining (RSG) | $1.360 | +$0.07 | +5.4% | +6.3% | +240.0% |
Northern Star Resources (NST) | $27.60 | +$1.42 | +5.4% | +2.7% | +59.9% |
Black Cat Syndicate (BC8) | $1.560 | +$0.08 | +5.4% | +32.8% | +113.7% |
Genesis Minerals (GMD) | $7.86 | +$0.4 | +5.4% | +7.8% | +167.3% |
Evolution Mining (EVN) | $14.86 | +$0.75 | +5.3% | +14.1% | +162.5% |
Silex Systems (SLX) | $7.15 | +$0.36 | +5.3% | -17.6% | +20.6% |
Zip Co. (ZIP) | $3.04 | +$0.15 | +5.2% | -6.2% | -3.5% |
Clarity Pharmaceuticals (CU6) | $3.46 | +$0.17 | +5.2% | +9.5% | -11.3% |
Today's worst blue chip losers
Company | Last Price | Change $ | Change % | 1mo % | 1yr % |
|---|---|---|---|---|---|
WA1 Resources (WA1) | $17.41 | -$1.19 | -6.4% | -8.2% | +26.4% |
Droneshield (DRO) | $4.47 | -$0.26 | -5.5% | +49.0% | +572.2% |
Abacus Storage King (ASK) | $1.525 | -$0.07 | -4.4% | -1.3% | +33.2% |
Electro Optic Systems Holdings (EOS) | $10.35 | -$0.45 | -4.2% | +18.7% | +762.5% |
The A2 Milk Company (A2M) | $8.18 | -$0.35 | -4.1% | -11.0% | +40.1% |
Eagers Automotive (APE) | $27.97 | -$1.13 | -3.9% | +9.7% | +143.3% |
Botanix Pharmaceuticals (BOT) | $0.125 | -$0.005 | -3.8% | +8.7% | -72.8% |
GPT Group (GPT) | $5.29 | -$0.2 | -3.6% | -5.4% | +15.5% |
Downer EDI (DOW) | $7.78 | -$0.29 | -3.6% | -2.5% | +43.0% |
Nine Entertainment Co. Holdings (NEC) | $1.090 | -$0.04 | -3.5% | -3.5% | +15.6% |
Capstone Copper Corp. (CSC) | $14.95 | -$0.52 | -3.4% | +1.3% | +52.6% |
Imdex (IMD) | $3.77 | -$0.13 | -3.3% | +6.5% | +46.7% |
ARB Corp. (ARB) | $26.51 | -$0.91 | -3.3% | -16.9% | -33.4% |
Ricegrowers Class B-Voting (SGLLV) | $16.20 | -$0.55 | -3.3% | -5.8% | +50.4% |
Light & Wonder (LNW) | $163.00 | -$5.47 | -3.2% | +3.8% | +11.9% |
G8 Education (GEM) | $0.680 | -$0.02 | -2.9% | -2.2% | -50.0% |
BWP Group (BWP) | $3.74 | -$0.11 | -2.9% | -8.8% | +12.0% |
Aspen Group (APZ) | $5.52 | -$0.16 | -2.8% | +2.0% | +131.9% |
Resmed Inc (RMD) | $37.41 | -$1.03 | -2.7% | +1.0% | -3.7% |
Austal (ASB) | $7.64 | -$0.21 | -2.7% | +15.9% | +135.8% |
ChartWatch
Nasdaq Composite Index
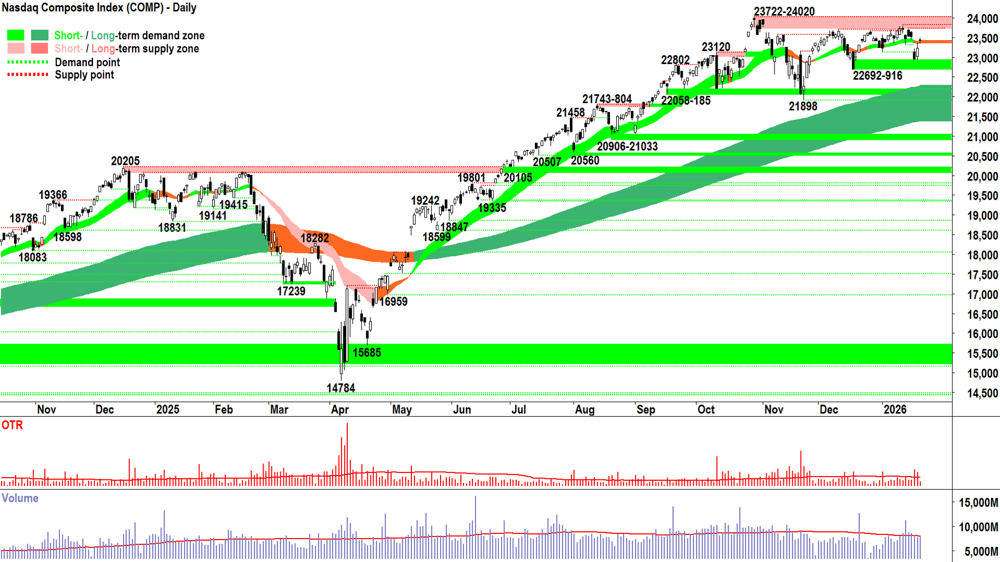
Analysis
You know the drill. It’s Friday. It’s a long weekend. It’s been a bit of an annoying week (can we call it “unnecessary volatility” caused by you know who… 🌮!)
A modest follow through on Thursday, better than I expected after Wednesday’s less than convincing display, anyway. But: totally consistent with the broader long term uptrend.
Hence why I maintained my portfolio RP limit through the turbulence of the week (Risk Position).
Never doubt the bull in a bull market — particularly when it comes to bull markets in the Good-Old US-of-A! 🌭
Am I convinced the demand-side is in confident and total control of the Comp’s short term price action? 🤔
Are you!? (Hey — why does it always have to be about what I think in ChartWatch… oh, yeah… makes sense! 😉)
Let’s see how it plays out. We have some very, very (x 10 very) solid demand-and-supply barriers to work with:
Impenetrable supply barrier: 23722-24020
Impenetrable demand barrier: 22692-22916 + Long term uptrend ribbon (dynamic, presently 21385-22275)
So, we will:
Maintain course and RP until one of them is consumed
Watch very, very (x 10 very) closely the price action and the volume we get in / near each barrier.
You know the drill:
White-bodied candles and downward pointing shadows = Fingerprints of demand📈
Black-bodied candles and upward pointing shadows = Fingerprints of supply📉
Volume = commitment and removal of the opposing party 🥊
But, to be fair… that’s the same measured and disciplined course of action we always take! 🧐
Analyse + Accept + Act = ✅✅✅
View
I remain at a 2/3RP portfolio risk limit 🪣 (RP = Risk Position — it reflects my personal allowable capital allocation limit for my investments in US stocks. So 1/2RP is 50%, 2/3RP is 67% and FRP is 100%). A close below 22692 would trigger a move to 1/2RP.
Key levels
The next zone of demand is 22692-916. If the Comp closes below that zone, we can assume the supply side is in control. On a close below 21898 the long term uptrend is likely under significant pressure = ⚠️. 23722-24020 is the nearest critical zone of supply — the Comp must close within this zone with a strong demand-side candle to confirm the demand-side is unequivocally back in control of the Comp's price.
S&P/ASX 200 (XJO)
%20chart_23%20Jan.png)
Analysis
Close enough is good enough this week for the ASX 200, a.k.a. the Old Tin Pot.
It didn’t shoot the lights out this week, heck, it wasn’t even up for the week — but given the shenanigans both at global macro and local fund flows levels — the downward pointing shadow of the weekly candle = “I’ll take it!”
Not the best week for the OTP... but I'll take it! 😅
For me, the most important aspect of this week’s technicals, is that it hasn’t disrupted the improvement we saw in last week’s technicals. I argue that we’re still on track to continue building on:
The new short term-long term trend realignment ✅
Rising peaks and rising troughs price action ✅, and
A still-predominance of demand-side candles ✅
With totally benign signals (or lack-thereof) from volume ✅
But! Momentum is key… we don’t want to languish… a week’s pause is fine, but not two. Next week will be shortened due to Monday’s public holiday, but the rest of the week will require the OTP to kick on.
Kick on… and up… to deliver a proper challenge to the overhead supply that it will no doubt encounter at 9110-16.
View
I remain comfortable at 2/3RP 🪣 (i.e., my personal allowable capital allocation limit for my investments in Australian stocks is now 67%).
Key levels
The short term trend ribbon is the closest zone of (dynamic) demand (presently 8755-8780). 8675 is the closest static point of demand. A close below the short term uptrend ribbon would neutralise the present short term uptrend, while a close below 8675 almost certainly would end it. After 8916, the October all-time highs around 9110-9116 is the next key zone of supply.
ChartWatch *LIVE* Webinar
ChartWatch *LIVE* Webinars – WEEKLY Wednesday's @ 12pm AEDT
Learn more about technical analysis and trend following through real case studies on ASX stocks. Australia's premier technical analyst, Carl Capolingua, shares his unique insights on stocks as requested by viewers. Ask about a company in your portfolio or anything related to trading and investing and get Carl's expert opinion.
Places are limited so >REGISTER NOW!<
Economy
Today
09:00 AUD January Flash Purchasing Managers Index (PMI)
Manufacturing: 52.4 vs 51.6 in December
Services: 56 vs 51.1 in December
Later this week
Saturday
01:15 USA January Flash PMI
Manufacturing: previous 51.6
Services: previous 51.1
Latest News
Interesting Movers
Trading higher
+27.4% Life360 (360) – Update on Preliminary Q4 2025 and Full Year Results.
+20.0% Manuka Resources (MKR) – No news, general strength across the broader Precious Metals sector today, rise is consistent with prevailing short and long term uptrends, a regular in ChartWatch ASX Scans Uptrends list 🔎📈
+18.8% Energy Transition Minerals (ETM) – No news, general strength across the broader Critical Minerals sector today, rise is consistent with prevailing short and long term uptrends, a recent regular in ChartWatch ASX Scans Uptrends list 🔎📈
+15.5% Boab Metals (BML) – No news, general strength across the broader Precious Metals sector today, rise is consistent with prevailing short and long term uptrends, a regular in ChartWatch ASX Scans Uptrends list 🔎📈
+15.2% Southern Palladium (SPD) – No news, general strength across the broader Precious Metals sector today, rise is consistent with prevailing short and long term uptrends, a regular in ChartWatch ASX Scans Uptrends list 🔎📈
+13.3% Lotus Resources (LOT) – No news, general strength across the broader Uranium sector today, rise is consistent with prevailing short and long term uptrends, a recent regular in ChartWatch ASX Scans Uptrends list 🔎📈
+13.0% Maronan Metals (MMA) – No news, general strength across the broader Precious Metals sector today, rise is consistent with prevailing short and long term uptrends, a regular in ChartWatch ASX Scans Uptrends list 🔎📈
+12.6% Coronado Global Resources (CRN) – No news, rise is consistent with prevailing short term uptrend and long term trend is transitioning from down to up, a recent regular in ChartWatch ASX Scans Uptrends list 🔎📈
+12.2% Argent Minerals (ARD) – No news, general strength across the broader Precious Metals sector today, rise is consistent with prevailing short and long term uptrends, a regular in ChartWatch ASX Scans Uptrends list 🔎📈
+12.1% American Tungsten & Antimony (AT4) – AT4 Signs With Deutsche Bank For Nasdaq Listing, general strength across the broader Critical Minerals sector today, rise is consistent with prevailing short and long term uptrends 🔎📈
+12.1% Delta Lithium (DLI) – Lithium Exploration Update, general strength across the broader Critical Minerals sector today, rise is consistent with prevailing short and long term uptrends, a regular in ChartWatch ASX Scans Uptrends list 🔎📈
+12.0% Podium Minerals (POD) – No news, general strength across the broader Critical Minerals sector today, rise is consistent with prevailing short and long term uptrends 🔎📈
+12.0% Dateline Resources (DTR) – $35M Institutional Raise Lifts Dateline Funds to $58M, general strength across the broader Critical Minerals sector today, rise is consistent with prevailing short and long term uptrends, a recent regular in ChartWatch ASX Scans Uptrends list 🔎📈
+10.2% Regis Resources (RRL) – No news since 22-Jan Quarterly Activities Report, general strength across the broader Precious Metals sector today, rise is consistent with prevailing short and long term uptrends, a regular in ChartWatch ASX Scans Uptrends list 🔎📈
+10.0% Rox Resources (RXL) – Quarterly Activities/Appendix 5B Cash Flow Report, general strength across the broader Precious Metals sector today, rise is consistent with prevailing short and long term uptrends, a regular in ChartWatch ASX Scans Uptrends list 🔎📈
+10.0% Aura Energy (AEE) – Investment establishes C$50M valuation for Haggan project, general strength across the broader Uranium sector today, rise is consistent with prevailing short and long term uptrends 🔎📈
+9.7% Polymetals Resources (POL) – No news, general strength across the broader Precious Metals sector today, rise is consistent with prevailing short and long term uptrends, a regular in ChartWatch ASX Scans Uptrends list 🔎📈
+9.5% Audinate Group (AD8) – No news, general strength across the broader Information Technology sector today.
+6.4% Elsight (ELS) – No news, rise is consistent with prevailing short and long term uptrends, a regular in ChartWatch ASX Scans Uptrends list 🔎📈
+6.3% Catapult Sports (CAT) – No news, general strength across the broader Information Technology sector today.
Trading lower
-7.1% Resolution Minerals (RML) – Resolution to Advance Golden Gate Tungsten Mine Stockpiles.
-6.1% Cettire (CTT) – No news, fall is consistent with prevailing short and long term downtrends 🔎📉
-5.5% Droneshield (DRO) – No news, pulled back in the wake of recent sharp rally.
-5.3% Metals X (MLX) – No news, pulled back in the wake of recent sharp rally.
Broker Moves
Amplitude Energy (AEL)
Retained at buy at Bell Potter; Price Target: $3.40 from $3.08
Retained at outperform at Macquarie; Price Target: $4.25 from $4.00
Australian Finance Group (AFG)
Retained at outperform at Macquarie; Price Target: $3.03 from $2.96
Auckland International Airport (AIA)
Retained at neutral at Citi; Price Target: $7.13
Aurelia Metals (AMI)
Retained at buy at Shaw and Partners; Price Target: $0.42
Abacus Storage King (ASK)
Downgraded to neutral from overweight at JPMorgan; Price Target: $1.70
Boab Metals (BML)
Retained at buy at Shaw and Partners; Price Target: $1.08 from $0.77
Bank of Queensland (BOQ)
Upgraded to neutral from underweight at JPMorgan; Price Target: $6.30 from $6.10
Bhagwan Marine (BWN)
Retained at buy at Shaw and Partners; Price Target: $0.80
BWP Trust (BWP)
Downgraded to underweight from neutral at JPMorgan; Price Target: $3.80 from $3.70
Carindale Property Trust (CDP)
Downgraded to neutral from overweight at JPMorgan; Price Target: $5.90
Charter Hall Group (CHC)
Retained at buy at Citi; Price Target: $27.00 from $26.10
Charter Hall Long Wale REIT (CLW)
Upgraded to neutral from underweight at JPMorgan; Price Target: $4.30
Centuria Capital Group (CNI)
Upgraded to overweight from neutral at JPMorgan; Price Target: $2.30
Deep Yellow (DYL)
Retained at speculative buy at Canaccord Genuity; Price Target: $2.48 from $1.98
Evolution Mining (EVN)
Retained at buy at Bell Potter; Price Target: $16.70 from $12.35
Fenix Resources (FEX)
Retained at buy at Bell Potter; Price Target: $0.70
Fortescue (FMG)
Retained at underweight at Jarden; Price Target: $17.15 from $17.00
Retained at neutral at UBS; Price Target: $20.00
FleetPartners Group (FPR)
Retained at outperform at Macquarie; Price Target: $3.36 from $3.59
Retained at overweight at Morgan Stanley; Price Target: $3.60
Retained at buy at Ord Minnett; Price Target: $3.40 from $3.50
Generation Development Group (GDG)
Retained at buy at Bell Potter; Price Target: $7.90 from $8.40
Retained at buy at Citi; Price Target: $7.50
Retained at outperform at Macquarie; Price Target: $6.75 from $6.70
Retained at overweight at Morgan Stanley; Price Target: $7.50
Retained at buy at Morgans; Price Target: $7.97 from $7.95
GenusPlus Group (GNP)
Retained at buy at Bell Potter; Price Target: $8.70 from $7.50
GPT Group (GPT)
Downgraded to neutral from overweight at JPMorgan; Price Target: $5.90 from $5.80
Hazer Group (HZR)
Retained at buy at Shaw and Partners; Price Target: $0.70
IVE Group (IGL)
Retained at buy at Bell Potter; Price Target: $3.25
JB Hi-Fi (JBH)
Retained at neutral at UBS; Price Target: $94.00 from $110.00
Lynas Rare Earths (LYC)
Retained at sell at Bell Potter; Price Target: $11.15 from $9.60
Monadelphous Group (MND)
Downgraded to sell from hold at Argonaut Securities; Price Target: $23.00
Nine Entertainment Co. Holdings (NEC)
Downgraded to neutral from overweight at JPMorgan; Price Target: $1.20 from $1.45
Northern Star Resources (NST)
Retained at buy at Bell Potter; Price Target: $31.10 from $30.00
Retained at buy at Canaccord Genuity; Price Target: $34.15 from $34.35
Retained at neutral at Citi; Price Target: $28.50 from $27.50
Retained at underweight at Jarden; Price Target: $17.20
Retained at accumulate at Ord Minnett; Price Target: $27.40 from $28.20
Retained at sector perform at RBC Capital Markets; Price Target: $29.00 from $28.00
Downgraded to neutral from buy at UBS; Price Target: $26.90 from $29.45
Netwealth Group (NWL)
Retained at buy at Citi; Price Target: $28.90 from $29.80
Retained at positive at E&P; Price Target: $34.70 from $37.60
Downgraded to neutral from overweight at Jarden; Price Target: $27.15 from $31.30
Upgraded to outperform from neutral at Macquarie; Price Target: $32.40 from $33.05
Retained at overweight at Morgan Stanley; Price Target: $41.00
Retained at hold at Ord Minnett; Price Target: $25.50 from $27.75
Retained at neutral at UBS; Price Target: $28.50
Orora (ORA)
Retained at neutral at Citi; Price Target: $2.30 from $2.35
Peninsula Energy (PEN)
Retained at speculative buy at Canaccord Genuity; Price Target: $1.29 from $1.03
Pantoro Gold (PNR)
Retained at buy at Argonaut Securities; Price Target: $7.20
Retained at speculative buy at Euroz Hartleys; Price Target: $8.18 from $6.16
Retained at buy at Goldman Sachs; Price Target: $7.55 from $8.00
Retained at trim at Morgans; Price Target: $5.00 from $5.02
Retained at buy at Ord Minnett; Price Target: $7.10
Regis Resources (RRL)
Retained at buy at Bell Potter; Price Target: $8.85 from $7.05
Retained at neutral at Goldman Sachs; Price Target: $8.70
Retained at hold at Morgans; Price Target: $8.05 from $6.17
Retained at outperform at RBC Capital Markets; Price Target: $10.00 from $9.70
Retained at buy at UBS; Price Target: $8.55 from $8.30
Resolute Mining (RSG)
Retained at buy at Canaccord Genuity; Price Target: $2.55 from $2.40
Retained at outperform at Macquarie; Price Target: $1.55 from $1.45
South32 (S32)
Retained at neutral at Goldman Sachs; Price Target: $3.50 from $3.40
Retained at buy at Jefferies; Price Target: $5.00 from $4.40
Retained at outperform at Macquarie; Price Target: $4.60 from $4.20
Retained at buy at Morgans; Price Target: $5.00 from $4.30
Upgraded to buy from neutral at UBS; Price Target: $4.90
SEEK (SEK)
Retained at outperform at Macquarie; Price Target: $32.50
Sandfire Resources (SFR)
Retained at hold at Jefferies; Price Target: $17.50 from $17.00
Retained at neutral at JPMorgan; Price Target: $20.80 from $20.70
Retained at neutral at Macquarie; Price Target: $19.60 from $16.90
Retained at hold at Morgans; Price Target: $18.90 from $17.50
Retained at sell at UBS; Price Target: $17.75 from $16.85
Stockland (SGP)
Upgraded to overweight from underweight at JPMorgan; Price Target: $6.10 from $6.00
SRG Global (SRG)
Downgraded to hold from buy at Argonaut Securities; Price Target: $3.00
Santos (STO)
Retained at buy at Citi; Price Target: $7.00 from $7.25
Retained at underweight at Jarden; Price Target: $6.00 from $5.95
Retained at outperform at Macquarie; Price Target: $7.75
Retained at equal-weight at Morgan Stanley; Price Target: $6.55
Retained at hold at Morgans; Price Target: $6.60 from $6.80
Upgraded to buy from accumulate at Ord Minnett; Price Target: $7.60 from $7.80
Retained at sector perform at RBC Capital Markets; Price Target: $6.75
Retained at buy at UBS; Price Target: $7.80
Southern Cross Electrical Engineering (SXE)
Downgraded to hold from buy at Argonaut Securities; Price Target: $2.25
Xero (XRO)
Retained at buy at UBS; Price Target: $174.00 from $194.00
Scans
Top Gainers
Code | Company | Last | % Chg |
|---|---|---|---|
| DTI | DTI Group Ltd | $0.017 | +88.89% |
| FAU | First Au Ltd | $0.011 | +37.50% |
| EMN | Euro Manganese Inc | $0.215 | +30.30% |
| NVO | Novo Resources Corp | $0.195 | +30.00% |
| NWM | Norwest Minerals Ltd | $0.022 | +29.41% |
Top Fallers
Code | Company | Last | % Chg |
|---|---|---|---|
| OSX | Osteopore Ltd | $0.02 | -23.08% |
| MOH | Moho Resources Ltd | $0.011 | -21.43% |
| AZI | Altamin Ltd | $0.023 | -14.82% |
| IFG | Infocus Group Holdings Ltd | $0.013 | -13.33% |
| N1H | N1 Holdings Ltd | $0.10 | -13.04% |
52 Week Highs
Code | Company | Last | % Chg |
|---|---|---|---|
| FAU | First Au Ltd | $0.011 | +37.50% |
| NVO | Novo Resources Corp | $0.195 | +30.00% |
| NWM | Norwest Minerals Ltd | $0.022 | +29.41% |
| SLZ | Sultan Resources Ltd | $0.015 | +25.00% |
| IOVDA | Ion Video Ltd | $0.26 | +23.81% |
52 Week Lows
Code | Company | Last | % Chg |
|---|---|---|---|
| N1H | N1 Holdings Ltd | $0.10 | -13.04% |
| BTN | Butn Ltd | $0.063 | -11.27% |
| ENL | Enlitic Inc | $0.014 | -6.67% |
| PKP | Peak Processing Ltd | $0.018 | -5.26% |
| GFL | Global Masters Fund Ltd | $3.35 | -4.29% |
Near Highs
Code | Company | Last | % Chg |
|---|---|---|---|
| WGX | Westgold Resources Ltd | $7.67 | +5.50% |
| FML | Focus Minerals Ltd | $3.96 | +7.32% |
| AWJ | Auric Mining Ltd | $0.31 | +6.90% |
| SMLL | Betashares Australian Small Companies Select ETF | $5.00 | +1.01% |
| DYM | Dynamic Metals Ltd | $0.61 | -0.41% |
Relative Strength Index (RSI) Oversold
Code | Company | Last | % Chg |
|---|---|---|---|
| FANG | Global X Fang+ ETF | $32.78 | +0.31% |
| YANK | Betashares Strong US Dollar Complex ETF | $11.02 | -1.34% |
| ETHI | Betashares Global Sustainability Leaders ETF | $16.06 | -0.06% |
| PME | Pro Medicus Ltd | $180.92 | +1.96% |
| WPR | Waypoint REIT | $2.46 | -1.20% |
