News | Market Wraps
Evening Wrap: ASX 200 dips as oil tops US$100, stoking RBA rate hike fears, iron ore spike sends FMG +4%, RIO +3%
The S&P/ASX 200 closed 11.9 points lower, down 0.14%.

Mentioned
The S&P/ASX 200 closed 11.9 points lower, down 0.14%.
The ASX 200 finished slightly lower as escalating tensions in the Middle East and the threat of an oil-driven inflation shock kept investors cautious. Higher energy prices have increased expectations the RBA may lift interest rates next week. Banks and insurers were strong, while gold and mining stocks dragged.
In stock specific news:
Lifestyle Communities (LIC) (+17.2%) — surged after US-based prefab housing giant Hometown America acquired a significant stake in the retirement village operator.
Electro Optic Systems (EOS) (+18.4%) — jumped after securing about US$45 million in new defence orders, including a major Middle East contract for its Slinger counter-drone weapon system.
DroneShield (DRO) (+6.4%) — rallied alongside EOS as heightened geopolitical tensions boosted demand for counter-drone technologies.
Syrah Resources (SYR) (-29.2%) — plunged after the US International Trade Commission rejected tariffs on Chinese graphite anode materials, dealing a blow to the company’s growth outlook.
Northern Star Resources (NST) (-18.8%) — tumbled after warning it may struggle to meet the bottom end of its production guidance following weaker milling and output at key operations.
Be sure to click/scroll through for the usual reporting of the major sector and stock-specific moves, the broker responses to them, as well as all the key economic data in tonight's Evening Wrap.
Also, I have detailed technical analysis on the Nasdaq Composite and the S&P/ASX 200 in today's ChartWatch.
Let's dive in!
Today in Review
Fri 13 Mar 26, 4:55pm (AEST)
Name | Value | % Chg |
|---|---|---|
Major Indices | ||
| ASX 200 | 8,617.1 | -0.14% |
| All Ords | 8,839.1 | -0.14% |
| Small Ords | 3,426.8 | -0.28% |
| All Tech | 2,732.7 | -0.14% |
| Emerging Companies | 3,069.4 | -1.45% |
Currency | ||
| AUD/USD | 0.7065 | -0.16% |
US Futures | ||
| S&P 500 | 6,694.5 | +0.25% |
| Dow Jones | 46,885.0 | +0.35% |
| Nasdaq | 24,585.25 | +0.10% |
Name | Value | % Chg |
|---|---|---|
Sector | ||
| Financials | 9,596.5 | +1.03% |
| Information Technology | 1,711.9 | +0.80% |
| Communication Services | 1,684.9 | +0.68% |
| Energy | 10,481.1 | +0.40% |
| Utilities | 9,733.3 | +0.33% |
| Consumer Discretionary | 3,465.3 | +0.22% |
| Real Estate | 3,346.7 | -0.17% |
| Industrials | 7,996.4 | -0.26% |
| Consumer Staples | 12,243.4 | -0.30% |
| Health Care | 28,165.6 | -0.33% |
| Materials | 22,086.8 | -2.06% |
Markets
%20intraday%20chart_13%20Mar.png)
ASX 200 Session Chart
The S&P/ASX 200 (XJO) finished points lower at 8,617.1, 0.55% from its session high and 0.37% from its low. In the broader-based S&P/ASX 300 (XKO) advancers lagged decliners by 1330 to 143. For the week, the XJO finished down 234 points or 2.6% lower, 2.7% from its intraweek high and 1.9% from its intraweek low.
Commonwealth Bank of Australia (CBA) (+1.3%) and National Australia Bank (NAB) (+1.5%) did the heavy lifting today, staving off a potentially greater decline in the benchmark ASX 200. Higher borrowing costs can expand banks’ lending margins.
However, they were joined by a strong move in insurance companies after broker Macquarie released a research report that suggested fears that AI-disruption would crimp insurers margins are likely overblown (you can read my take on the report here).
Medibank Private (MPL) (+3.4%), Insurance Australia Group (IAG) (+3.3%), and Suncorp Group (SUN) (+2.6%) were all stronger. Between these insurers and the big banks, the Financials (XFJ) (+1.0%) ended up topping the sector performance list — on a down day.
Some of that “AI is not making the sky fall” theory likely rubbed off on beaten down “SaaSpocalypse” stocks in the Information Technology (XIJ) (+0.8%) sector. Nextdc (NXT) (+3.9%) and Xero (XRO) (+2.6%) were solid.
Energy stocks were still in high demand as the Brent crude oil price continued to hover around the psychological US$100/bbl mark. Coal producer Yancoal Australia (YAL) (+4.5%) backed up its strong performance from yesterday and Viva Energy Group (VEA) (+3.4%) was also pretty good.
Weakness in precious metals producers dragged on the market as investors rotated away from gold stocks despite only modest moves in bullion prices. Gold Sub-Index (XGD) (-6.2%) slumped with Northern Star Resources (NST) (-18.8%), Genesis Minerals (GMD) (-6.0%) and Evolution Mining (EVN) (-3.2%) falling sharply.
More broadly, Resources (XJR) (-1.7%) also slipped as BHP Group (BHP) (-2.3%) declined after China widened restrictions on its iron ore shipments, helping Fortescue (FMG) (+4.1%) and Rio Tinto (RIO) (+3.1%) which also rallied on stronger iron ore prices.
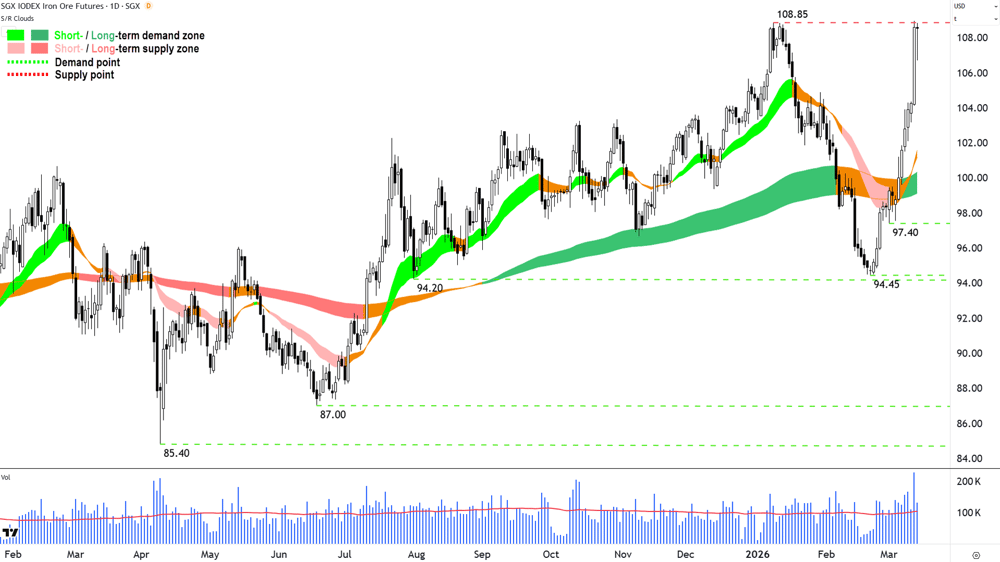
Iron Ore Futures SGX chart
In commodities, gold and silver eased slightly in Asian trade after recent gains, with gold down 0.34% to about US$5,107/oz and silver falling 1.7% to around US$83.69/oz.
Lithium prices weakened in China trade, with benchmark lithium carbonate futures falling 3.1% to around 151,300 CNY/t. Despite the softer pricing, PLS Group (PLS) (+2.3%) and Liontown Resources (LTR) (+4.0%) both advanced after early strength in the lithium market and supportive broker commentary for LTR (see Broker Moves).
Today's best blue chip gainers
Company | Last Price | Change $ | Change % | 1mo % | 1yr % |
|---|---|---|---|---|---|
Fortescue (FMG) | $20.48 | +$0.8 | +4.1% | -5.3% | +29.2% |
Nextdc (NXT) | $13.19 | +$0.49 | +3.9% | -2.4% | +1.4% |
Medibank Private (MPL) | $4.25 | +$0.14 | +3.4% | -5.1% | -0.2% |
Insurance Australia (IAG) | $7.25 | +$0.23 | +3.3% | +6.6% | -4.0% |
Rio Tinto (RIO) | $157.89 | +$4.8 | +3.1% | -6.5% | +36.1% |
Xero (XRO) | $80.53 | +$2.05 | +2.6% | +4.7% | -48.6% |
Suncorp Group (SUN) | $15.62 | +$0.39 | +2.6% | -1.9% | -16.7% |
PLS Group (PLS) | $4.89 | +$0.11 | +2.3% | +10.4% | +180.2% |
Vicinity Centres (VCX) | $2.31 | +$0.05 | +2.2% | -9.1% | +10.0% |
Ampol (ALD) | $30.85 | +$0.58 | +1.9% | +5.3% | +28.0% |
IGO (IGO) | $7.69 | +$0.14 | +1.9% | -11.7% | +100.3% |
National Australia Bank (NAB) | $47.11 | +$0.71 | +1.5% | +1.2% | +41.9% |
Soul Pattinson (SOL) | $38.56 | +$0.56 | +1.5% | +1.3% | +20.4% |
South32 (S32) | $4.41 | +$0.06 | +1.4% | -2.4% | +24.9% |
Telstra Group (TLS) | $5.19 | +$0.07 | +1.4% | +6.4% | +26.9% |
REA Group (REA) | $170.22 | +$2.29 | +1.4% | +1.8% | -25.2% |
Dyno Nobel (DNL) | $3.00 | +$0.04 | +1.4% | -8.3% | +12.8% |
Commonwealth Bank (CBA) | $173.76 | +$2.16 | +1.3% | -2.8% | +20.7% |
Steadfast Group (SDF) | $4.22 | +$0.05 | +1.2% | -3.4% | -22.9% |
Aristocrat Leisure (ALL) | $46.19 | +$0.54 | +1.2% | -9.4% | -30.7% |
Today's worst blue chip losers
Company | Last Price | Change $ | Change % | 1mo % | 1yr % |
|---|---|---|---|---|---|
Northern Star Resources (NST) | $21.75 | -$5.02 | -18.8% | -26.0% | +25.1% |
Genesis Minerals (GMD) | $6.26 | -$0.4 | -6.0% | -13.1% | +94.4% |
Amcor PLC (AMC) | $56.96 | -$2.62 | -4.4% | -18.5% | -27.2% |
Pinnacle Investment (PNI) | $13.73 | -$0.62 | -4.3% | -21.8% | -23.5% |
Capricorn Metals (CMM) | $11.90 | -$0.52 | -4.2% | -15.4% | +51.8% |
ALS (ALQ) | $21.63 | -$0.91 | -4.0% | -11.8% | +42.3% |
Block (XYZ) | $85.76 | -$3.28 | -3.7% | +13.5% | -2.0% |
Ramelius Resources (RMS) | $4.07 | -$0.14 | -3.3% | -13.2% | +89.3% |
Light & Wonder (LNW) | $118.20 | -$3.95 | -3.2% | -22.2% | -26.1% |
Evolution Mining (EVN) | $13.51 | -$0.45 | -3.2% | -15.7% | +109.1% |
Hub24 (HUB) | $79.77 | -$2.65 | -3.2% | -0.1% | +13.5% |
Life360 (360) | $19.78 | -$0.61 | -3.0% | -19.2% | -6.5% |
Cochlear (COH) | $174.42 | -$4.74 | -2.6% | -29.0% | -33.1% |
Car Group (CAR) | $24.65 | -$0.64 | -2.5% | -3.6% | -27.8% |
James Hardie (JHX) | $28.28 | -$0.69 | -2.4% | -24.1% | -43.0% |
BHP Group (BHP) | $49.80 | -$1.18 | -2.3% | -4.4% | +30.2% |
JB HI-FI (JBH) | $76.54 | -$1.81 | -2.3% | -3.7% | -11.3% |
Treasury Wine Estates (TWE) | $3.94 | -$0.09 | -2.2% | -25.5% | -60.6% |
Lynas Rare Earths (LYC) | $20.70 | -$0.47 | -2.2% | +29.4% | +193.2% |
ChartWatch
Nasdaq Composite Index
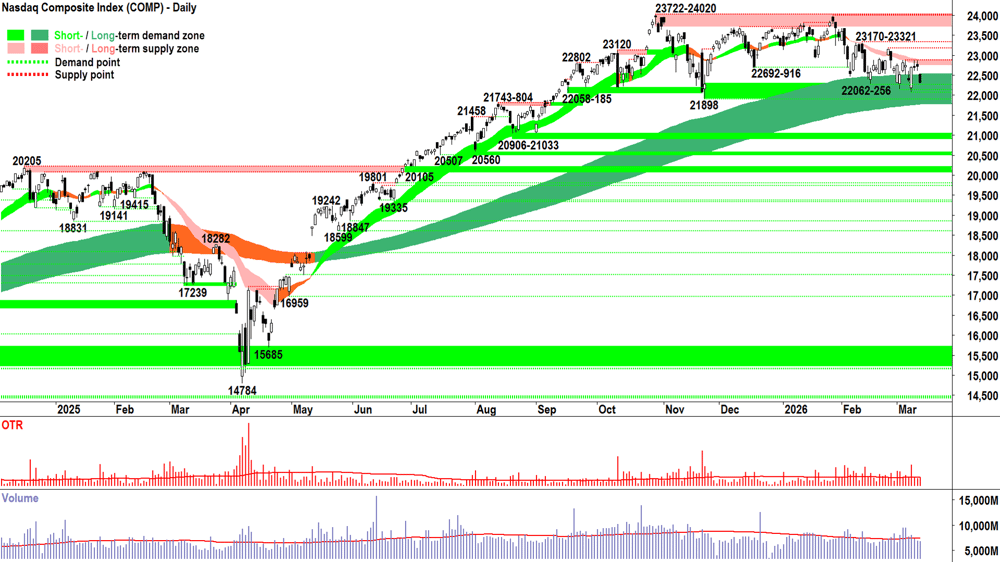
Analysis
It looks from last night’s candle that the short term trend ribbon is gaining the upper hand in its rivalry with the long term uptrend ribbon for control of the Comp’s price!
Is Thursday’s gap-and-run black-bodied candle, with its close near the session low — a very credible supply-side showing — decisive enough to trigger the break of the long term uptrend ribbon? 🤔
You won’t get a prediction out of me (!!), but I do note that it’s the first “proper” manifestation of motivated supply since that long batch of white-bodied candles.
It marks only the second close inside the long term uptrend ribbon since it first turned dark green in this cycle all the back on 13 March 2025 — and it’s the deepest probe of what has been a very reliable zone of dynamic excess demand so far.
More broadly, we are:
Short term downtrend, price is below the short term downtrend ribbon and the short term downtrend ribbon is showing clear signs of acting as a zone of dynamic excess supply ⚠️
Falling peaks and falling troughs = supply reinforcement + demand removal = sell the rally and reluctance to buy the dip = lack of FOMO (Fear of Missing Out) and lack of HOFU (Holding On for Further Upside) ⚠️
But also:
Long term uptrend ribbon (note we cannot say “the price is above the long term downtrend ribbon and the long term downtrend ribbon is showing clear signs of acting as a zone of dynamic excess demand” anymore ⚠️)
Arguably a predominance of demand-side candles (but perhaps some squinting required now after last night's candle) = dominant programmed algorithmic buy orders + buy the dip ✅
It’s a very close call based on what are clearly an ambiguous set of technicals.
Definite damage done last night. Enough to swing the balance away from “wow, look at all those white candles at the long term uptrend ribbon” and “it’s in the nature of bull markets to rise” — to “there’s no doubt there presently exists a delicate equilibrium between the demand- and supply-sides”.
The only things I am sure of are the following:
A close below 22062, and more importantly 21898, would dramatically increase the probability the demand-side has been cracked / consumed / or has plain given up. Plus, it will be certain that the supply-side is gaining size and motivation… ⚠️
Nothing less than a close above the short term downtrend ribbon — with an emphatic, long, white-bodied candle, closing smack-bang at its high — is required to swing the market back to FOMO and HOFU. Preferably such a signal is accompanied by substantially above-average volume to demonstrate greater demand-side participation and the consumption of a good portion of the pool of latent supply.
Even so on that last item, there would still be even more work to be done — i.e., at the very least getting back above the points of supply at 22907, 23170, and 23321.
I know I’m going to sound like a broken record here, but: all the above is rather moot if one has managed their portfolio risk accordingly up to this point.
So, when you really think about it, the brand of technical analysis I teach you here each day and in the webinars on Wednesday doesn’t really need to predict, does it? 🤔
Nope, it does just fine following… 💪
View
1/2RP feels valid with respect to my US portfolio risk limit (RP = Risk Position — it reflects my personal allowable capital allocation limit for my investments in US stocks — how full I can fill my US "Risk Bucket" if you prefer. 1/2RP is 50%, 2/3RP is 67% and FRP is 100% 🪣).
Key levels
21898-22256 is the critical zone of demand — a close below it implies the long term uptrend is likely under significant pressure (over!?) = ⚠️. The short term downtrend ribbon (presently 22755-22872) is the nearest critical zone of point supply, and 22907-23170-23321 aren't far beyond that.
S&P/ASX 200 (XJO)
%20chart_13%20Mar.png)
Analysis
No flip-flop of the long term trend ribbon today! It stayed amber = equilibrium. ⚖️
And today’s candle was a similar showing of equilibrium = upward and downward pointing shadows with a close roughly in the middle (albeit a small black-body). Below average volume. ⚖️
Neither the demand- nor the supply-sides wish to engage with any great force. Why? Because neither of them can see a set of fundamentals that requires pushing any harder in their preferred direction from here.
And so, we wait… 🕰️
With risk levels adjusted accordingly (for me, this means 50-50 risk-to-cash with a good portion of the risk I’m allowed to take devoted to short trades).
One item that isn’t signalling equilibrium, however, is the newly “pinked” short term downtrend ribbon. We know how instrumental the Comp’s short term downtrend ribbon has been for weeks in defining that index’s path — could we see the same occur here? 🧐
After the shock of getting to the middle (i.e., from an all time high made less than 2 weeks ago — but albeit on the worst market breadth I’ve seen in a very long time!), once you’re in the middle there’s actually not a great deal to do…
It’s like the eye of the hurricane! Yep… at some point… you know the wind is going to change… 🌪️!
“Skip, we’re going to make it…”
View
1/2RP, logically, feels like the right place for me to be 🪣 (i.e., my personal allowable capital allocation limit for my investments in Australian stocks is 50%).
Key levels
8383-8457 is the closest zone of demand (static). Beyond it — the bear market awaits...⚠️🚨 The ASX 200 must at least close back above the long term uptrend ribbon (presently 8674 - 8779 to reclaim any semblance of demand-side control.
ChartWatch *LIVE* Webinar
ChartWatch *LIVE* Webinars – WEEKLY Wednesday's @ 12pm AEDT
Learn more about technical analysis and trend following through real case studies on ASX stocks. Australia's premier technical analyst, Carl Capolingua, shares his unique insights on stocks as requested by viewers. Ask about a company in your portfolio or anything related to trading and investing and get Carl's expert opinion.
Places are limited so >REGISTER NOW!<
Economy
Today
There weren't any major economic data releases in our time zone today
Later this week
Friday
11:30 USA February Core PCE Price Index m/m (+0.4% m/m forecast vs -0.1% m/m in January)
Saturday
01:00 USA February JOLTS Job Openings (+6.84 million m/m forecast vs +6.54 million m/m in January)
Latest News
Interesting Movers
Trading higher
+18.3% Electro Optic Systems (EOS) – Counter-Drone Orders (US$45m), general strength across the broader Defence sector today, rise is consistent with prevailing short and long term uptrends, a regular in ChartWatch ASX Scans Uptrends list 🔎📈
+17.2% Lifestyle Communities (LIC) – Ceasing to be a Substantial Holder from HMC and Becoming a substantial holder (HMC Capital Partners' 8% stake was sold via JP Morgan block trade to Hometown Australia).
+12.7% Sunrise Energy Metals (SRL) – No news since.
+11.7% Lindian Resources (LIN) – Continued positive response to yesterday's Half Yearly Report and Accounts, rise is consistent with prevailing short and long term uptrends, a regular in ChartWatch ASX Scans Uptrends list 🔎📈
+7.9% Qoria (QOR) – ASX Listing Rule waiver and confirmation.
+7.8% Dateline Resources (DTR) – No news, rise is consistent with prevailing short and long term uptrends, a recent regular in ChartWatch ASX Scans Uptrends list 🔎📈
+7.4% EQ Resources (EQR) – Half Year Financial Report.
+6.4% Droneshield (DRO) – No news, general strength across the broader Defence sector today, rise is consistent with prevailing short and long term uptrends, a recent regular in ChartWatch ASX Scans Uptrends list 🔎📈
+6.0% Dalrymple Bay Infrastructure/Notes (DBI) – DBI prices AUD$350m Australian Medium-Term Note Issuance and upgraded to buy from hold at Morgans.
+5.7% NIB (NHF) – No news, general strength across the broader Insurance sector today.
+4.5% Yancoal Australia (YAL) – No news, rise is consistent with prevailing short and long term uptrends, a regular in ChartWatch ASX Scans Uptrends list 🔎📈
+4.1% Fortescue (FMG) – No news, general strength across the broader Iron Ore sector today.
+4.0% Liontown Ltd (LTR) — Upgraded to overweight from neutral at JPMorgan with price target raised to $2.10 from $2.30, also, upgraded to neutral from sell at Citi.
Trading lower
-18.8% Northern Star Resources (NST) – Operational Update, general weakness across the broader Gold sector today.
-15.0% Meeka Metals (MEK) – No news, general weakness across the broader Gold sector today.
-14.1% Iperionx (IPX) – Continued negative response to 12-Mar Half Year Accounts.
-8.0% Tivan (TVN) – No news since 12-Mar TVN advances IPCM grant funding for Speewah Fluorite Project.
-7.3% Benz Mining Corp. (BNZ) – No news, general weakness across the broader Gold sector today.
-7.1% Karoon Energy (KAR) – Brazilian crude oil export tax announced.
-7.0% Forrestania Resources (FRS) – British Hill Drilling Confirms Significant Depth Extensions, general weakness across the broader Gold sector today.
-6.4% Unico Silver (USL) – Half-year financial report - 31 December 2025, general weakness across the broader Silver sector today.
-6.3% Kingsgate Consolidated (KCN) – No news, general weakness across the broader Gold sector today.
-6.0% Genesis Minerals (GMD) – No news, general weakness across the broader Gold sector today.
-6.0% Pantoro Gold (PNR) – Continued negative response to 10-Mar Development of Third Underground Mine at Norseman, general weakness across the broader Gold sector today.
-5.9% Ora Banda Mining (OBM) – No news since 12-Mar Drilling Expands Little Gem, New Sapphire Trend Discovered, general weakness across the broader Gold sector today.
-5.6% Black Cat Syndicate (BC8) – No news, general weakness across the broader Gold sector today.
-5.3% Andean Silver (ASL) – No news, general weakness across the broader Silver sector today.
Broker Moves
Life360 Inc (360)
Retained at buy at Citi; Price Target: $32.20 from $40.75
BHP Group (BHP)
Retained at neutral at Macquarie; Price Target: $52.00
Collins Foods (CKF)
Retained at buy at Canaccord Genuity; Price Target: $12.78 from $12.57
Retained at outperform at CLSA; Price Target: $13.70 from $12.50
Retained at neutral at Macquarie; Price Target: $11.10 from $11.20
Upgraded to buy from accumulate at Morgans; Price Target: $12.70 from $12.40
Retained at hold at Ord Minnett; Price Target: $12.00 from $10.50
Retained at buy at UBS; Price Target: $13.50 from $13.10
COG Financial Services (COG)
Retained at buy at Shaw and Partners; Price Target: $2.45
Dalrymple Bay Infrastructure (DBI)
Upgraded to buy from hold at Morgans; Price Target: $5.35
FINEOS Corporation Holdings PLC (FCL)
Retained at buy at Citi; Price Target: $2.95 from $3.25
Harvey Norman Holdings (HVN)
Retained at equal-weight at Morgan Stanley; Price Target: $6.00
Insurance Australia Group (IAG)
Retained at outperform at Macquarie; Price Target: $9.00
JB Hi-Fi (JBH)
Retained at underweight at Morgan Stanley; Price Target: $75.40
Liontown (LTR)
Retained at buy at Bell Potter; Price Target: $2.42
Upgraded to neutral from sell at Citi; Price Target: $1.65 from $1.70
Upgraded to overweight from neutral at JPMorgan; Price Target: $2.10 from $2.30
Retained at neutral at Macquarie; Price Target: $1.75
Lynas Rare Earths (LYC)
Upgraded to buy from sell at Argonaut Securities; Price Target: $24.00 from $14.00
Magellan Financial Group (MFG)
Upgraded to buy from hold at Morgans; Price Target: $12.43 from $9.80
Metro Mining (MMI)
Retained at buy at Shaw and Partners; Price Target: $0.15
Medibank Private (MPL)
Retained at neutral at Macquarie; Price Target: $4.80
NIB Holdings (NHF)
Retained at underperform at Macquarie; Price Target: $6.05
Northern Star Resources (NST)
Retained at outperform at Macquarie; Price Target: $32.00
Premier Investments (PMV)
Retained at buy at UBS; Price Target: $18.00 from $19.00
Pantoro Gold (PNR)
Retained at buy at Ord Minnett; Price Target: $6.60 from $7.10
QBE Insurance Group (QBE)
Retained at neutral at Macquarie; Price Target: $24.40
Steadfast Group (SDF)
Retained at outperform at Macquarie; Price Target: $4.80
Service Stream (SSM)
Retained at buy at UBS; Price Target: $2.85
Suncorp Group (SUN)
Retained at outperform at Macquarie; Price Target: $18.90
Torque Metals (TOR)
Retained at speculative buy at Morgans; Price Target: $0.90 from $0.80
Scans
Top Gainers
Code | Company | Last | % Chg |
|---|---|---|---|
| H2G | GREENHY2 Ltd | $0.013 | +30.00% |
| EOS | Electro Optic Systems Holdings Ltd | $11.74 | +18.35% |
| CR9 | Corella Resources Ltd | $0.013 | +18.18% |
| GMN | Gold Mountain Ltd | $0.13 | +18.18% |
| LIC | Lifestyle Communities Ltd | $5.31 | +17.22% |
Top Fallers
Code | Company | Last | % Chg |
|---|---|---|---|
| IMM | Immutep Ltd | $0.045 | -88.61% |
| SYR | Syrah Resources Ltd | $0.17 | -29.17% |
| DWG | Dataworks Group Ltd | $0.125 | -21.88% |
| NST | Northern Star Resources Ltd | $21.75 | -18.75% |
| CP8 | Canadian Phosphate Ltd | $0.065 | -18.75% |
52 Week Highs
Code | Company | Last | % Chg |
|---|---|---|---|
| EOS | Electro Optic Systems Holdings Ltd | $11.74 | +18.35% |
| CR9 | Corella Resources Ltd | $0.013 | +18.18% |
| LIN | Lindian Resources Ltd | $0.91 | +11.66% |
| WEC | White Energy Company Ltd | $0.055 | +10.00% |
| OMA | Omega Oil & Gas Ltd | $0.625 | +7.76% |
52 Week Lows
Code | Company | Last | % Chg |
|---|---|---|---|
| IMM | Immutep Ltd | $0.045 | -88.61% |
| SYR | Syrah Resources Ltd | $0.17 | -29.17% |
| M2M | MT Malcolm Mines NL | $0.011 | -15.39% |
| TWL | Trade Window Holdings Ltd | $0.165 | -15.39% |
| GTI | Gratifii Ltd | $0.064 | -14.67% |
Near Highs
Code | Company | Last | % Chg |
|---|---|---|---|
| HGBL | Betashares Global Shares Currency Hedged ETF | $76.47 | -0.27% |
| MQGPG | Macquarie Group Ltd | $103.33 | +0.08% |
| AHL | Adrad Holdings Ltd | $1.10 | +4.76% |
| COI | Comet Ridge Ltd | $0.15 | +3.45% |
| AZJ | Aurizon Holdings Ltd | $4.00 | +0.50% |
Relative Strength Index (RSI) Oversold
Code | Company | Last | % Chg |
|---|---|---|---|
| VAP | Vanguard Australian Property Securities INDEX ETF | $85.90 | +0.11% |
| WAF | West African Resources Ltd | $2.83 | -2.08% |
| MTS | Metcash Ltd | $2.97 | +0.34% |
| SGP | Stockland | $4.64 | +0.22% |
| GMG | Goodman Group | $25.71 | -1.80% |
